What's new in Dynatrace SaaS version 1.310
- Release notes
- 10-min read
- Rollout start on Mar 11, 2025
This page showcases new features, changes, and bug fixes in Dynatrace SaaS version 1.310.
To learn about new Dynatrace Apps and feature updates with this release, select an item from the table below.
| Category | Updates in this release |
|---|---|
| Across platform | 10 |
 Kubernetes Kubernetes | 1 |
 Dashboards and Dashboards and  Notebooks Notebooks | 4 |
Across platform
Feature update  Platform | Distributed Tracing
Distributed Tracing powered by Grail
Distributed Tracing powered by Grail is now in General Availability. Traces powered by Grail allow you to access your trace data with the fetch span DQL command across the platform, providing you with powerful capabilities to:
- Solve advanced trace analytics use cases with DQL
- Extend your trace retention up to 10 years
- Extend the trace ingest rates
For more information, see:
- Distributed tracing with Dynatrace just got even better blog post
- Distributed Tracing documentation
As part of this general availability, the Traces powered by Grail product category has been introduced and is available to DPS customers. You can find more details in the full rate card.
Feature update Application Observability | Services
Calculated service metrics in Grail
Calculated service metrics are now available in Grail.
- Enhanced precision: Grail stores the metrics' full dimension cardinality—not just the Top X values—providing more accurate insights.
- Seamless data exploration: Use the power of DQL and the new Dashboards to explore, filter, and analyze your metrics with ease.
- Improved flexibility: Placeholders used in the metric's dimension values are now separated into distinct metric dimensions, making querying and dashboarding simpler.
- Coming soon Services App Integration: Metrics upgraded to Grail will automatically appear in the
 Services app’s Metrics tab for effortless access alongside other service data.
What you need to know
- Automatic upgrade: Most calculated service metrics will be automatically upgraded to Grail.
- For metrics that can’t be automatically upgraded, use
 OpenPipeline or create a DQL report in Notebooks to access similar insights. For details, see Calculated service metrics upgrade guide.
 - Future direction: All new calculated service metrics should be created via metric extraction from span data in OpenPipeline. This approach provides greater flexibility and control. Note that the current calculated service metrics functionality will be deprecated in the future (there's no deprecation date yet; details will follow).
Coming soon
- Improved Listing: The
 Settings Classic app will soon include better filtering/tracking for migrated calculated service metrics.
 - Adjustments for Services App: As noted in the upgrade guide, some calculated service metrics may need adjustments to display correctly. These adjustments are still not applied to the Services app. For now, we recommend opening calculated service metrics in Notebooks via the Open with button from the Settings Classic app, as the generated DQL automatically applies the necessary adjustments and provides a DQL query that can be used as a foundation for other queries or dashboards.
Feature update Grail | DQL
New XML matcher parameter
You can now use the ignoreNamespace parameter with the following XML matchers with DPL:
Feature update Infrastructure Observability
Resilient updates for Environment ActiveGates
We're excited to announce enhancements to the ActiveGate auto-update mechanism. The new update process ensures that updates within network zones, ActiveGate groups, and Synthetic private locations are performed in a rolling fashion. These improvements brings several benefits:
- Minimized downtime: By updating ActiveGates sequentially, we reduce the risk of service interruptions.
- Enhanced stability: Rolling updates ensure that only a subset of ActiveGates is updated at any given time, maintaining overall system stability.
- Improved reliability: This method allows for better monitoring and quick interruption if any issues arise during the update process.
These changes will significantly enhance the performance and reliability of ActiveGate deployments.
Feature update Application Security | Code-level vulnerabilities & Attacks
Detection of SSRF vulnerabilities and attacks on Java
OneAgent version 1.309+
Detection of server-side request forgery (SSRF) is now supported for code-level vulnerabilities and attacks in Java technology.
To enable SSRF monitoring, follow the instructions below.
- Enable OneAgent monitoring: In Settings > Preferences > OneAgent features, turn on
Java SSRF code-level vulnerability and attack evaluationand make sure thatJava code-level vulnerability evaluationis turned on. - Verify Runtime Vulnerability Analytics settings: In Settings > Application Security > Vulnerability Analytics > General settings, make sure that
Enable Code-level Vulnerability Analyticsis turned on andGlobal Java code-level vulnerability detection controlis set toMonitor.
Feature update Runtime Application Protection | Attacks
Enhanced allowlisting capabilities for attacks
OneAgent version 1.309+
When creating a rule to allowlist an attack (Settings > Application Security > Application Protection > Allowlist), you can now
- Filter specific attacks with more precise control
- Define conditions that must be met to allowlist an attack
- Specify where the rule is applied
Feature update Runtime Vulnerability Analytics | Vulnerabilities
Support for Python technology
OneAgent version 1.309+
Dynatrace extends the list of supported technologies for Runtime Vulnerability Analytics to include Python.
To detect Python vulnerabilities
- Enable Dynatrace monitoring: In Settings > Monitoring > Monitoring technologies, find Python and enable Monitor Python.
- Enable OneAgent monitoring: In Settings > Preferences > OneAgent features, find and enable Python software component reporting, then restart your processes.
- Enable Runtime Vulnerability Analytics monitoring: In Settings > Application Security > Vulnerability Analytics > General settings, enable Python.
Feature update Application Security | Third-party vulnerabilities
Python support for the origin of vulnerable components
OneAgent version 1.309+
Information regarding the origin of the vulnerable component is now available for Python software components on the remediation tracking pages for process groups and processes affected by a vulnerability.
Feature update Platform | Platform Services
Additional audit events for Dynatrace REST API usage
Dynatrace now provides access to additional audit events in dt.system.events for keeping track of which Dynatrace REST APIs are used.
API calls now get audited in dt.system.events via the following:
event.kind == "AUDIT_EVENT"event.provider == CLASSIC_API
The fields resource and event.type allow you to filter for specific APIs.
Sample query:
fetch dt.system.events| filter event.kind == "AUDIT_EVENT"| filter event.provider == "CLASSIC_API"| filter event.type == "POST"| filter contains(resource, "entity")
Context-specific information allows you to deeply analyze the data. As usual, the full power of DQL is available to make use of this additional source of data.
Upcoming change Platform
IP address changes of OneAgents and ActiveGates connecting to Dynatrace SaaS
In March 2025, Dynatrace will change the underlying IP addresses that ActiveGates and OneAgents use when connecting to Dynatrace SaaS on AWS. This will result in a change of frontend IP addresses.
- This change will be completely transparent and won't require immediate action.
- Later this year, however, action may be required, depending on your deployment.
For more information, see IP address changes of OneAgents and ActiveGates connecting to Dynatrace SaaS.
Platform bug fixes, patches, and maintenance
Resolved issues in this release
-
Built-in log processing rule
cloud:aws:lambdalinks logs to both AWS_LAMBDA_FUNCTION and CUSTOM_DEVICE entities to support both AWS integrations (AWS Lambda and AWS Lambda built-in). (APPOBS-1018) -
Fixed an issue that broke metric queries that use more than one
nefilter inside anorfilter. (MGD-3063) -
Fixed duplicated types for the limit override for DevOps Alerting setting on the web UI. (DI-19122)
-
Service metrics in Grail derived from aggregated spans (for example, database calls) are now multiplied correctly based on the aggregation count. (APPOBS-5177)
-
Fixed the name formatting for the root cause entity in the Problems card. (DI-19131)
-
ActiveGate extension modules: in the case of a corrupted module version, the version is normalized to allow for successful module update. (MGD-2961)
-
Mobile Session Replay: Fixed an issue in which some images in some sessions were not being loaded because the timeframe used to request them was wrong. (DEM-6048)
-
Dashboards Classic: Resolved an Error 431 that resulted when selecting "View Synthetic event" from a dashboard tile. (DEM-5401)
-
Dashboards Classic: Timeseries with one-hour resolutions are no longer shifted to display grouped data points at the beginning of the resolution timeframe. (PAPA-23431)
Kubernetes
Feature update Infrastructure Observability | Log Monitoring
Collect and manage Kubernetes logs without full OneAgent
Dynatrace provides a flexible approach to Kubernetes observability, allowing you to easily select the level of observability required for your needs. This includes log collection and management for your Kubernetes environments. Our updated log capabilities for Kubernetes allow you to:
- Stream Kubernetes logs without running a OneAgent host module, to start small and extend later
- Get insights into logs from short-lived containers and pods such as InitContainers and Jobs
- Analyze logs in context of automatically enriched Kubernetes metadata (and traces if OneAgent code modules are in place)
- Easily onboard log analytics within the Kubernetes app
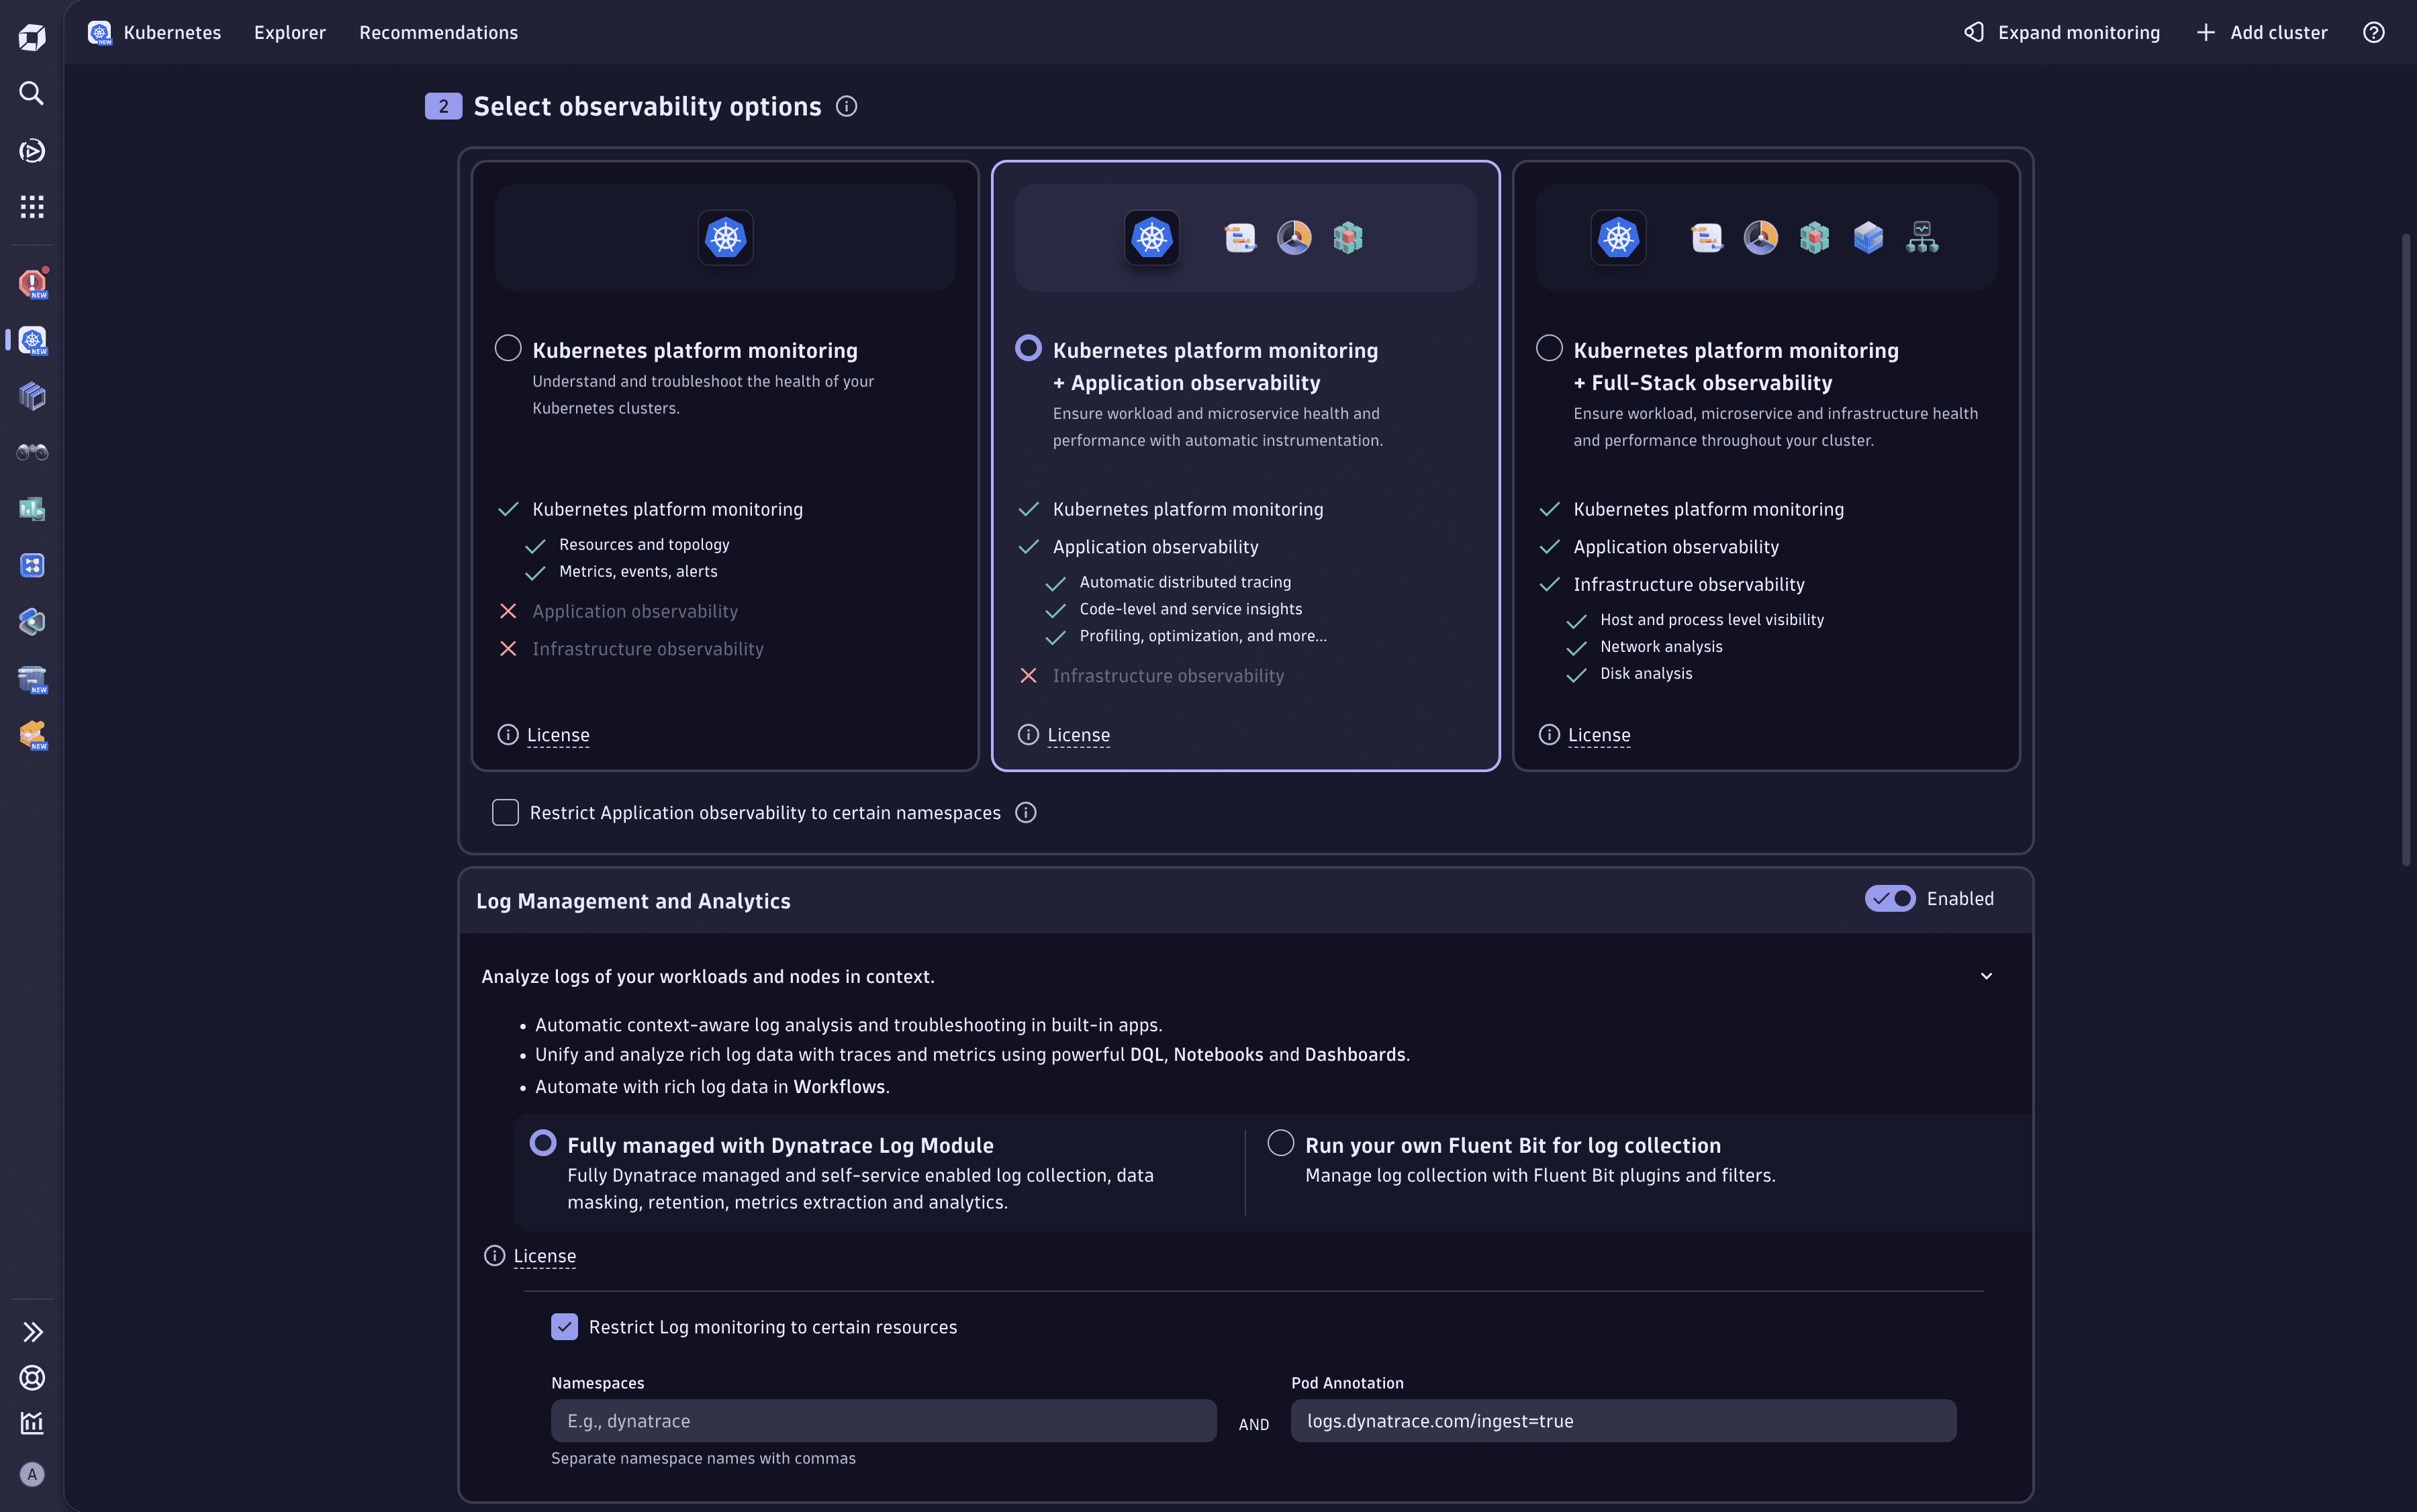
See the Deployment and Kubernetes logging made easy: Comprehensive Kubernetes visibility with Dynatrace post to learn more about the Dynatrace Log Module for Kubernetes.
Dashboards and Notebooks
Note: to check your app version, open the menu in the upper-right corner of the app and select What's new.
Feature update Dashboards
Enhanced mechanism for upgrading Dashboards Classic dashboards to the new Dashboards app
Dashboards version 1.310+
When upgrading your dashboards from Dashboards Classic to the new Dashboards, the mechanism now supports your health tiles for applications, hosts, services, databases, and synthetic monitors.
After the upgrade, health tiles now immediately appear as honeycomb tiles with pre-defined conditional colors matching your previous tiles in Dashboards Classic showing whether entities are affected by an open problem or not.
For details, see Upgrade from Dashboards Classic to Dashboards.
Upcoming change Ready-made dashboards
Ready-made dashboards distributed with extensions
Dashboards version 1.310+
We removed the following dashboards from the ready-made dashboards set:
To use these dashboards in your environment:
- Go to the dashboard in the Playground using the link above.
- Download the dashboard JSON from Playground.
- Upload the dashboard in your environment.
In upcoming releases, the extension-distributed dashboards will automatically appear among ready-made dashboards after you install the extensions in your environment.
Related extensions:
For details on ready-made dashboards, see Ready-made dashboards.
Feature update Platform | Dashboards and Notebooks
Snippets for fetching data from remote Dynatrace environments
Dashboards version 1.310+ Notebooks version 1.310+
You can now leverage additional snippets right from the menu in the Dashboards and Notebooks apps to create remote environment dashboard tiles or notebook sections when fetching data from another Dynatrace environment.
- Fetch external data
- Remote environment data via Platform token
- Remote environment data via OAuth
For more information, see Remote environment data.
Feature update Platform | Dashboards and Notebooks
Show the full content of a table cell
Dashboards version 1.310+ Notebooks version 1.310+
In a table visualization, right-click a cell with string contents, or hover over the cell and select , to display a menu of cell-specific commands. From that menu, you can now select View in fullscreen to display the cell content in its own window.
The window offers the following options:
- and navigate from record to record.
- copies the current value to the clipboard.
- closes the window and returns to the table.
For more about table interactions, see Table visualization.
Kubernetes
Feature update Infrastructure Observability | Log Monitoring
Kubernetes log collection and management without full OneAgent
Dynatrace provides a flexible approach to Kubernetes observability, allowing you to easily select the level of observability required for your needs. This includes log collection and management for your Kubernetes environments. Our updated log capabilities for Kubernetes allow you to:
- Stream Kubernetes logs without running a OneAgent host module, to start small and extend later
- Get insights into logs from short-lived containers and pods such as InitContainers and Jobs
- Analyze logs in context of automatically enriched Kubernetes metadata (and traces if OneAgent code modules are in place)
- Easily onboard log analytics within the Kubernetes app
See the documentation and the accompanying blog post to learn more about the Dynatrace Log Module for Kubernetes.
Dynatrace API
To learn about changes to the Dynatrace API in this release, see Dynatrace API changelog version 1.310.