What's new in Dynatrace SaaS version 1.313
- Release notes
- 10-min read
- Rollout start on Apr 22, 2025
This page showcases new features, changes, and bug fixes in Dynatrace SaaS version 1.313. It contains:
Kubernetes | Log Analytics
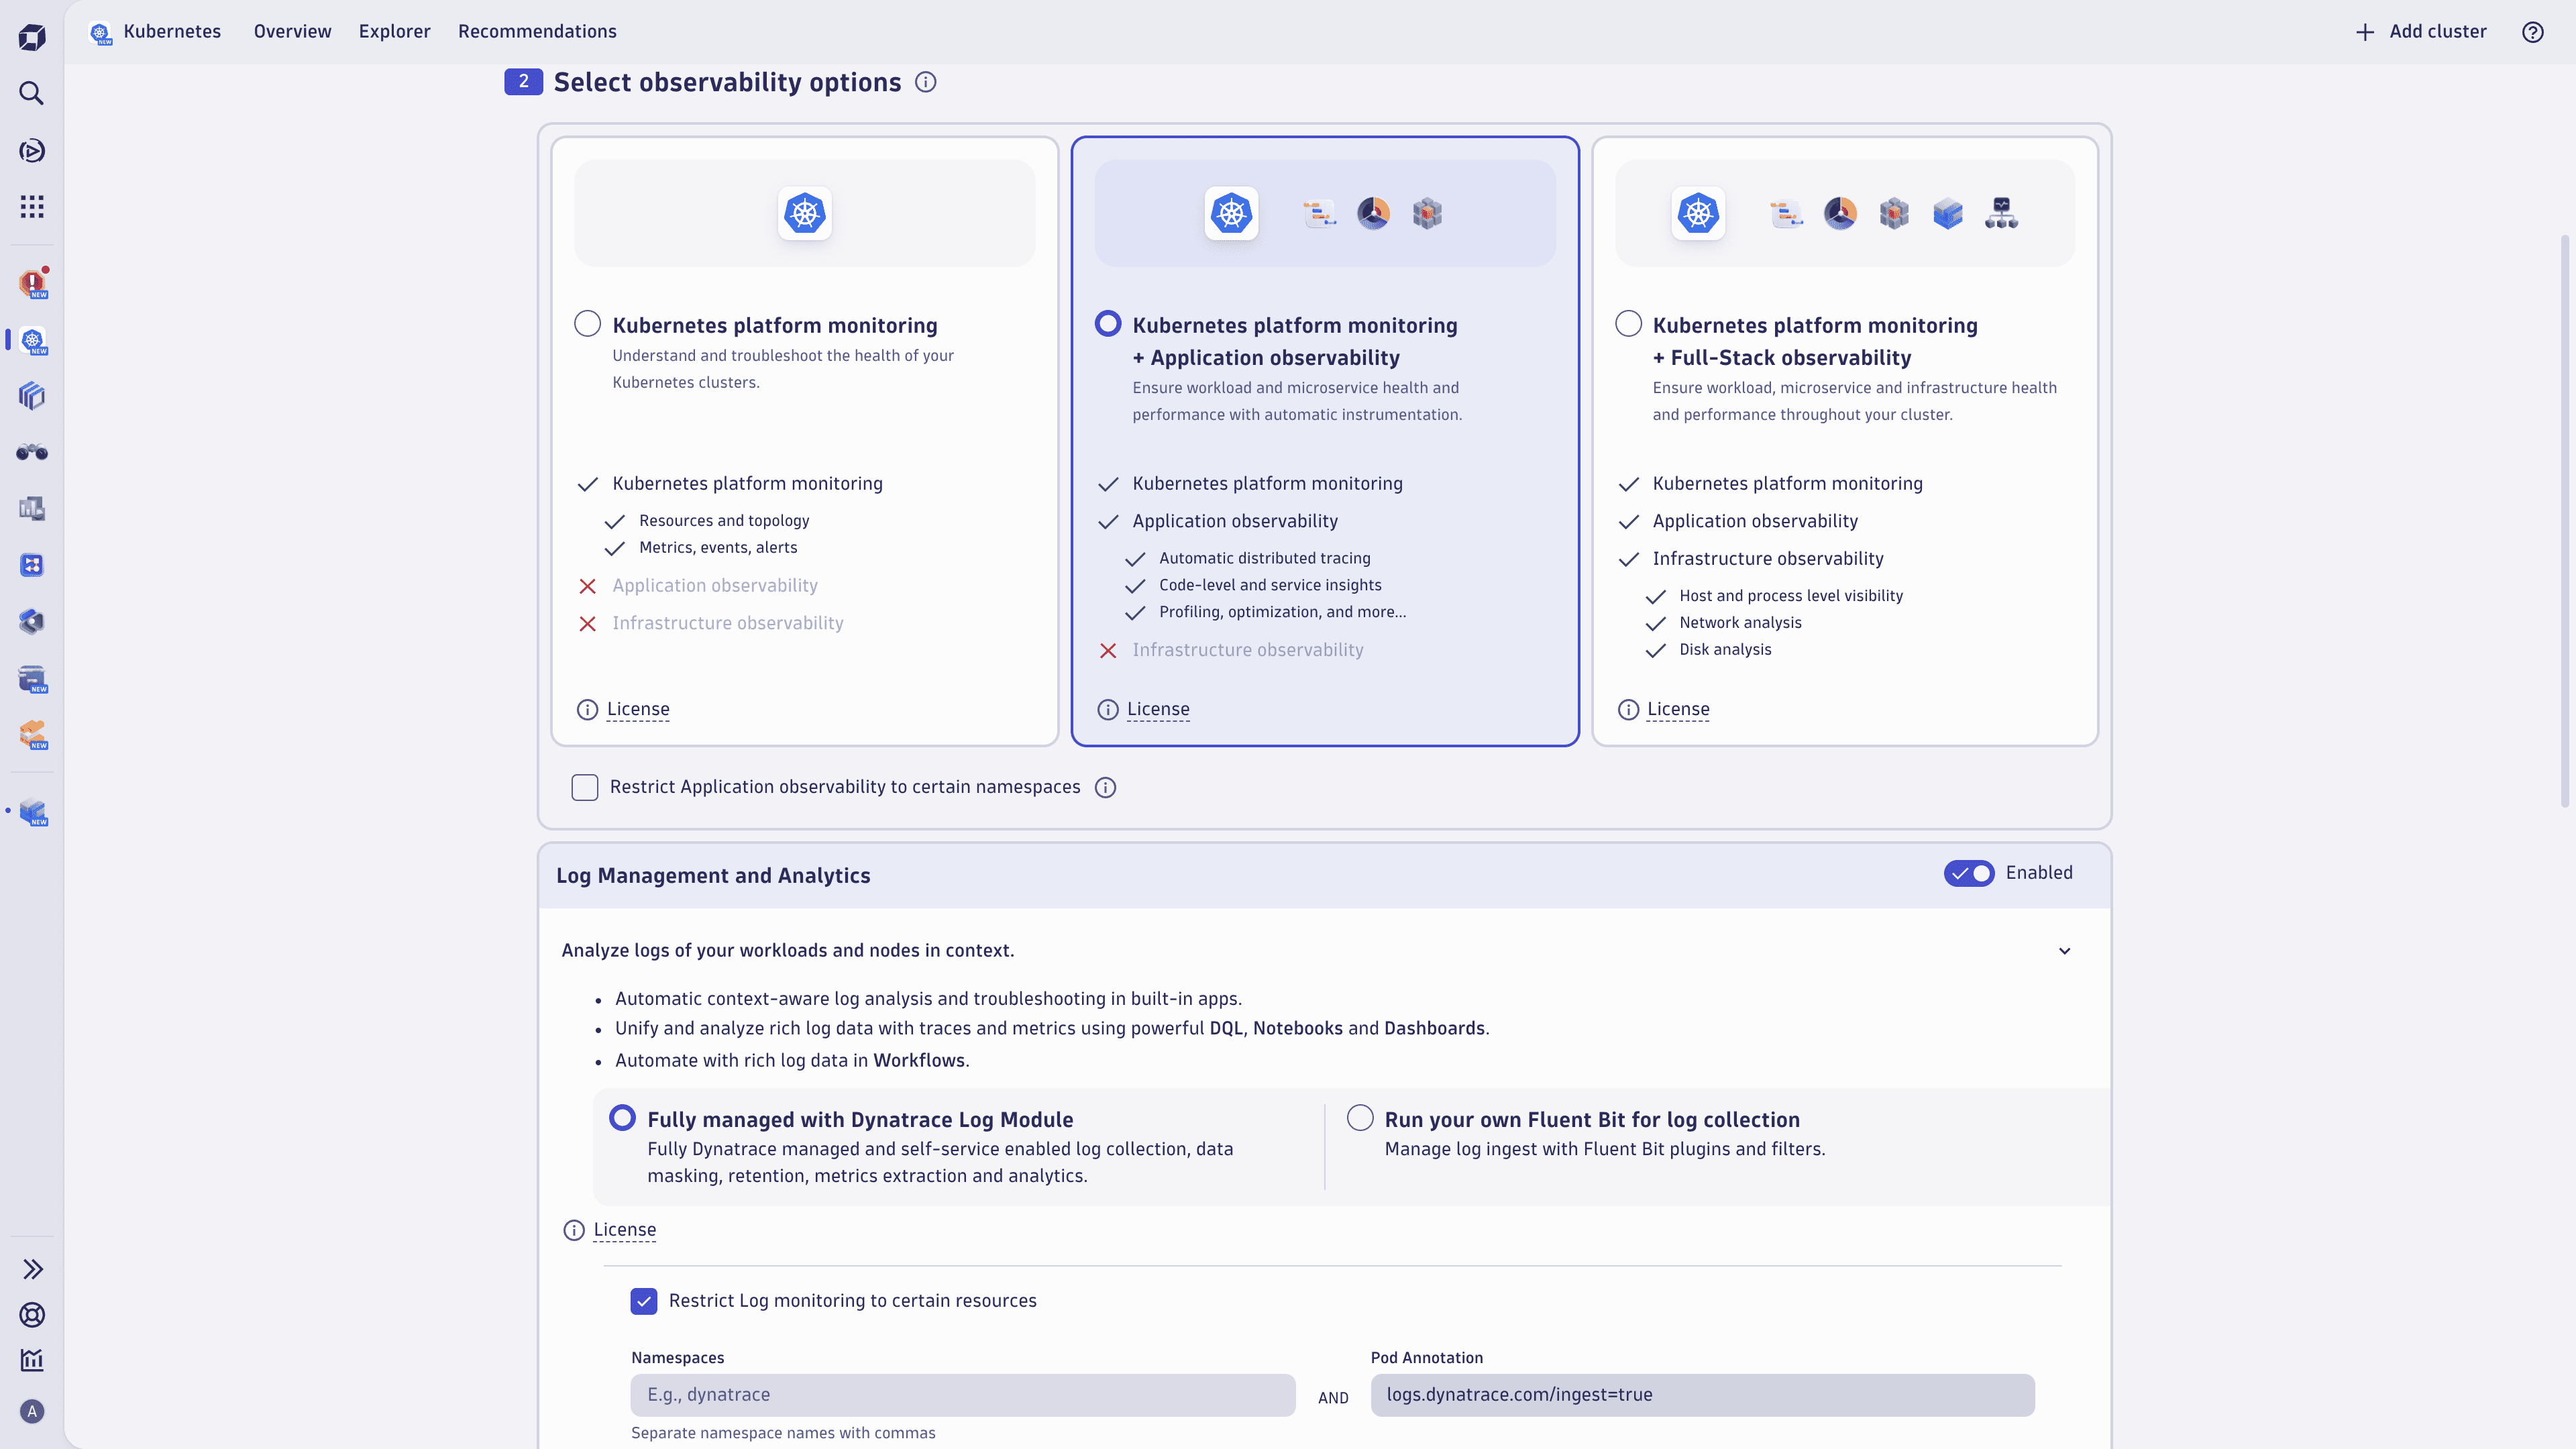
Stay in control of your Kubernetes logs with Dynatrace’s fully automated log management
The Dynatrace Log Module for Kubernetes provides you with automated, centralized log collection—all without needing OneAgent on every node.
With our enhanced Log Module for Kubernetes, you get:
-
No more manual log shipping
Centrally manage logs across your clusters, eliminating the hassle of configuring individual log collectors. -
Insights into short-lived containers
Easily analyze logs from init containers, jobs, and ephemeral workloads that were previously difficult to capture. -
Fine-grained log access controls
Define who can access logs at the namespace or cluster level for better security and compliance. -
Flexible observability
Start with Kubernetes platform monitoring, then scale up to full-stack observability—including traces, security analytics, and real-user monitoring.
Further information
- Want the full story on how we make Kubernetes logging easy? Check out our blog to see how this update transforms your experience!
- Looking for in-depth guidance? Explore our documentation: Stream Kubernetes logs with Dynatrace Log Module.
Feature updates
All | Monitoring Consumption
Benefit from Full-Stack-included trace and metrics volume when using OpenTelemetry in Kubernetes
We have improved the documentation for DPS Host monitoring in SaaS (including Full-Stack Monitoring and Infrastructure Monitoring) to make it more clear which metrics and spans are covered by the included volume in the Full-Stack Monitoring and Infrastructure Monitoring capabilities.
Metrics
When you have the Metrics powered by Grail capability on your rate card, metrics that are scraped and sent via the Dynatrace OpenTelemetry Collector in Kubernetes are now covered by the metric data points volume in Full-Stack or Infrastructure monitoring if the underlying host is monitored via OneAgent by either leveraging Classic Full-Stack or Cloud Native Full-Stack deployment.
For details, see Host monitoring: Metrics.
As in all other scenarios, metric data points that exceed your included volume of metric data points are charged as Metrics powered by Grail - this explicitly includes Prometheus metrics sent via ActiveGate, which will be enforced now.
Distributed traces
Trace data sent via the OneAgent Trace API or, more generally, OpenTelemetry traces that originate at a Full-Stack Monitoring host or application and are sent via the OTLP API are now also counted into the included trace data volume. Any OpenTelemetry trace data that is sent this way that exceeds your included trace-data volume in a given 15-minute interval is charged as Traces - Ingest & Process.
For details, see Host monitoring with Dynatrace.
Platform | DQL
More detailed query execution events for failed DQL queries
The query execution events available in dt.system.query_executions provide visibility into the query load in Grail, with precise context of query source. You can now retrieve the client context and failure reason in case of failed queries.
Sample query:
fetch dt.system.query_executions| filter status == "FAILED"| filter client.application_context == "dynatrace.dashboards"| filter failure_reason == "INSUFFICIENT_PERMISSIONS"
Context-specific information allows you to perform detailed analysis of failed queries. As usual, the full power of DQL is available to make use of this additional source of data.
For more information, see Query Execution Events in the Semantic Dictionary.
Software Delivery | Site Reliability Guardian
 Site Reliability Guardian app header enhanced for easier access to supporting resources
The redesigned app header in the Site Reliability Guardian is streamlined for a more intuitive interface, providing simplified navigation and easier access to help and documentation.
For app details, see Site Reliability Guardian.
Platform
Metric extraction now allows dt.security_context
You can now use dt.security_context in metric extraction for logs, spans, and events. Note: Metric extraction from spans requires the DPS rate card Metrics Ingest and Process.
Application Security | Vulnerabilities
New monitoring rules for third-party vulnerabilities
You can now set up monitoring rules based on resource attributes (for processes) and Kubernetes labels (for Kubernetes nodes and hosts) in Settings > Application Security > New monitoring rules: Third-party.
For detailed information, examples, and use cases, see Monitoring rules - Third-party Vulnerability Analytics and Use cases for monitoring rules.
Workflows | Connectors
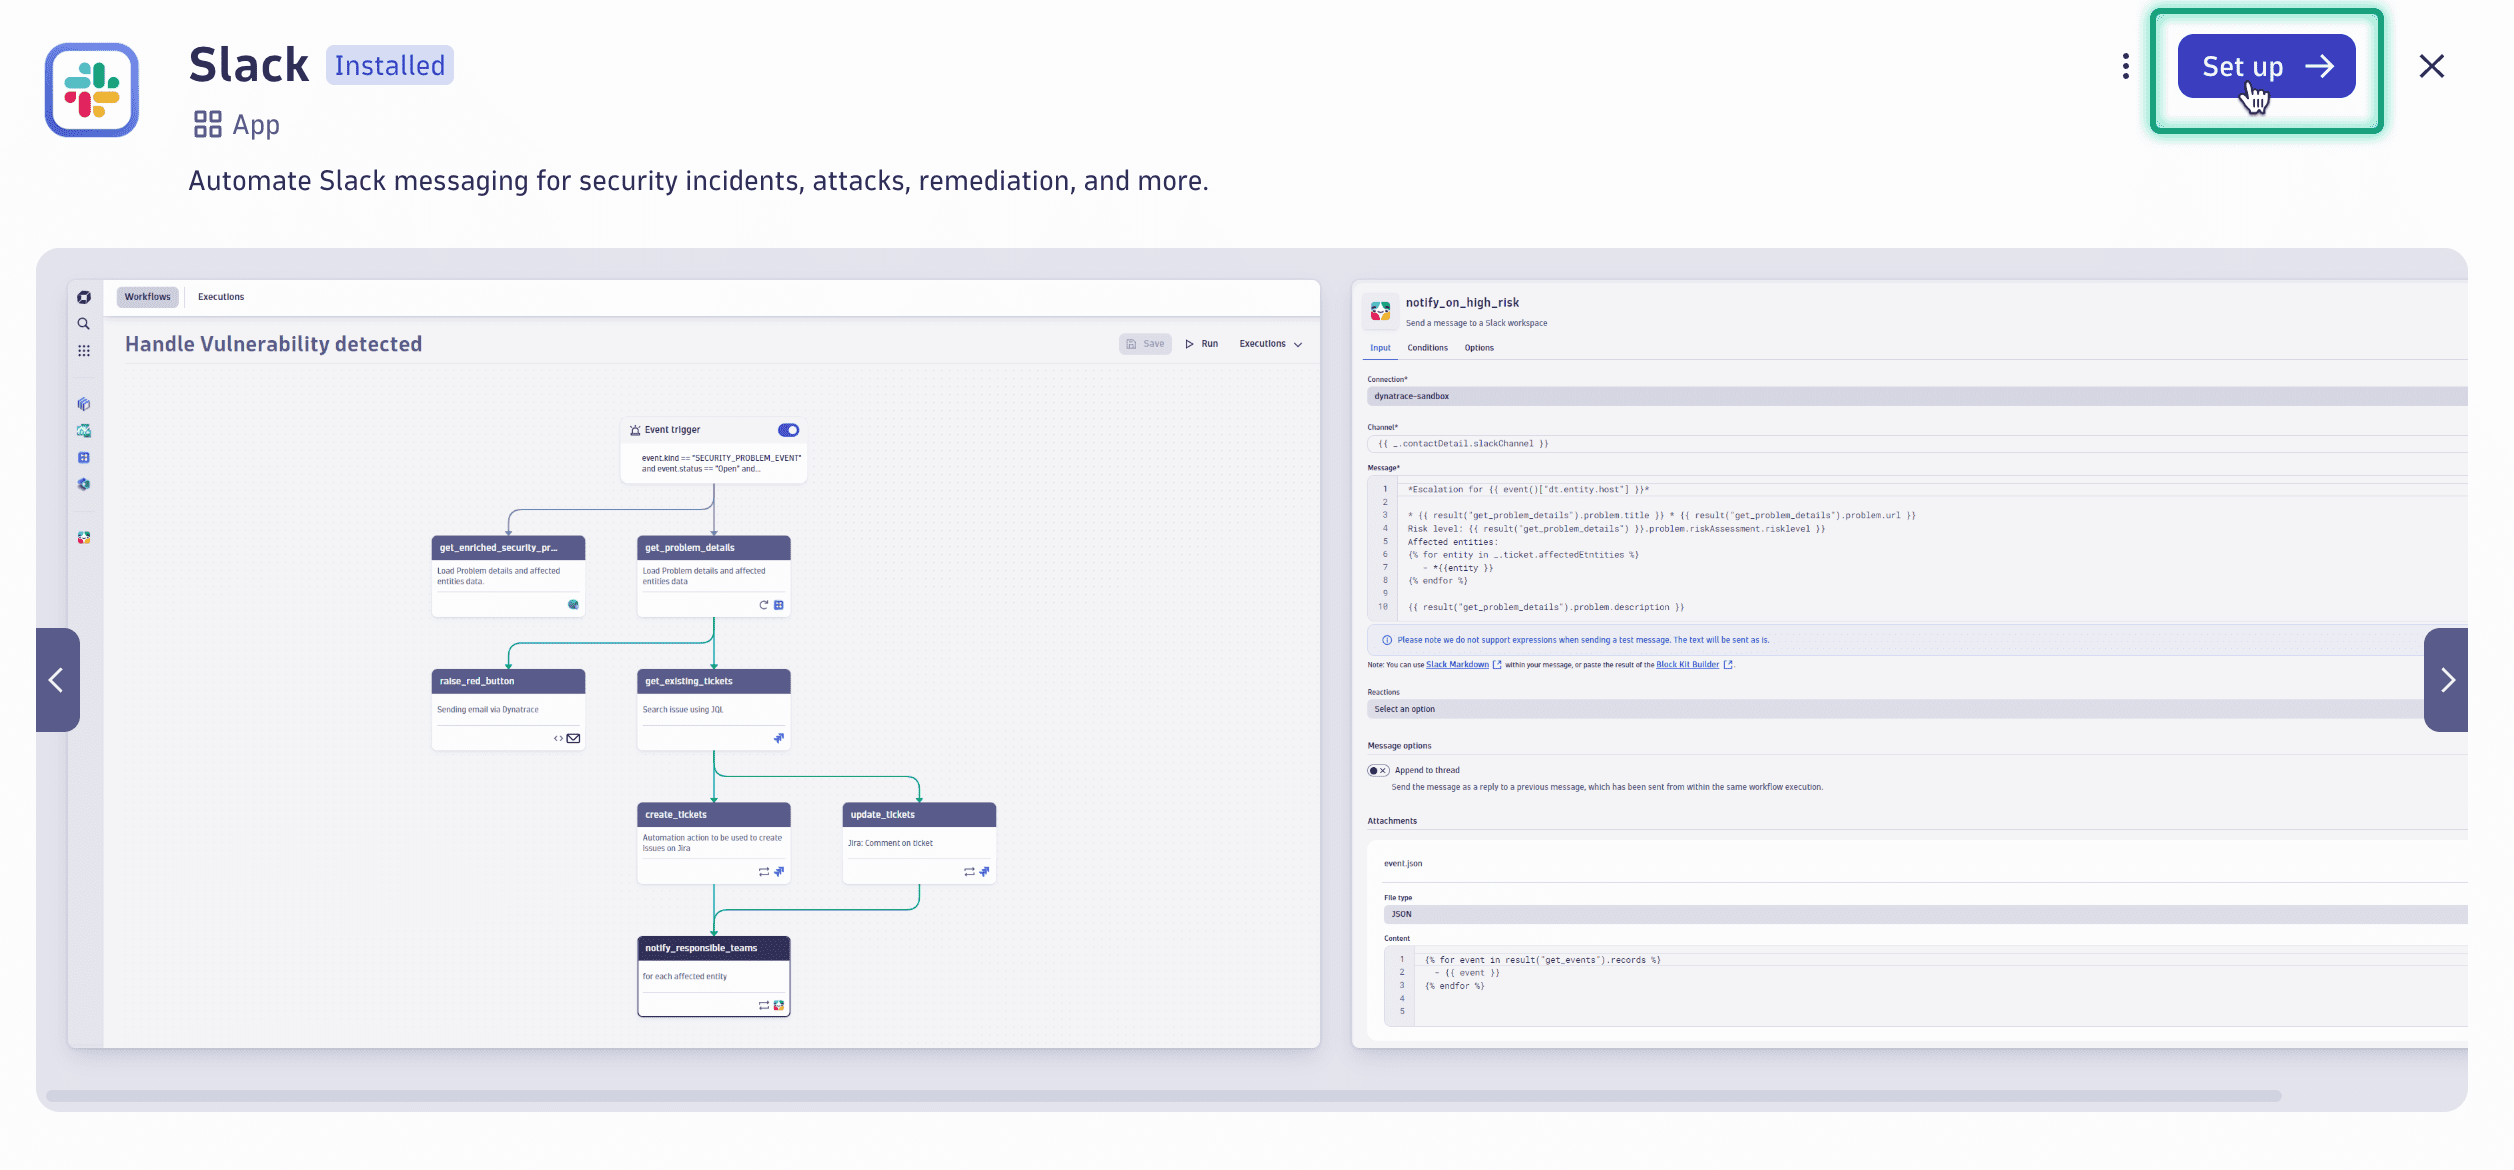
Set up Workflows Connectors via Hub
You can now start setting up your Workflows Connectors and actions directly in Dynatrace Hub.
Breaking changes
Platform | Dashboards
Variable replacement strategies in DQL tiles
We now offer variable replacement strategies when referencing variables in DQL tiles.
While introducing new strategies, we adapted the default strategy, which automatically wraps variable values with double quotation marks on replacement in the tile. Previously, quotation marks within such variable values were automatically removed to avoid breaking queries. We have improved this by escaping quotation marks within variable values instead.
This change enhances the transparency of the actual values to the user and the security. If you now encounter unwanted quotation marks in your variable values, remove them at the source (on ingest) or use DQL functions (on read).
Replacement strategies and DQL functions
-
Default replacement: replaces the variable with its value using double quotes. It is useful for Strings such as entity names or categories.
Example:
$variableEscape double-quotes in variable values.
-
No-quote replacement: Replace the variable with its value without adding quotes.
Example:
$variable:noquoteValues can only include alphanumeric characters, underscore (
_), dash (-), and dot (.). Query will show an error on query execution for other characters. -
Triple-quote replacement: Replaces the variable with its value using triple quotes, allowing raw content without escaping.
Example:
$variable:triplequoteShow an error if
"""is part of the value on query execution. -
Backtick replacement: Replaces the variable with its value using backticks, useful for field names in DQL.
Example:
$variable:backtickEscape backticks in variable values.
For details, see Variable replacement.
Dynatrace Hub
Change in the Dynatrace Hub CDN URL
Effective July 1st, the URL for the Dynatrace Hub CDN will change from https://dt-cdn.net/hub to https://cdn.hub.central.dynatrace.com. If you directly access Hub CDN URLs, for example to download extensions within your network, you must update your network configuration accordingly. To avoid any disruptions, please ensure that the new URL, https://cdn.hub.central.dynatrace.com, is added to your allowlists alongside https://dt-cdn.net at your earliest convenience.
Fixes and maintenance
Resolved issues in this release
- Fixed an issue with the "Databases" > database details > "Top requests" button not showing the expected results. (APPOBS-6107)
- Resolved an issue with settings pages for management zones and automatically applied tags that broke the web UI during editing via an HTTP/2 connection. (PS-32517)
- Fixed a bug that led to a 500 error when trying to access the custom device page. (MGD-4037)
- Improved Classic Windows services monitoring to OS services monitoring migration: enhanced the migration process between the features to correctly handle values that include parentheses. (OA-45186)
- Dashboards Classic: Validation added to prevent spaces-only tile names. (APPOBS-5930)
- Resolved issue with handle reporting unassigned status for extension when ActiveGate group name is missing. (DAQ-5899)
- Fixed an issue that caused some policy-based permissions to not be considered in the classic web UI when using custom URLs. (PS-31968)
- Built-in log processing rules
cloud:aws:rdsandcloud:aws:rdsaurora, along with corresponding OpenPipeline Technology bundles, now link logs to bothRELATIONAL_DATABASE_SERVICEandCUSTOM_DEVICEentities to support both legacy and generic AWS integrations. (APPOBS-4827) - Fixed an issue that would break some tiles on the "Technology overview" page. (MGD-3917)
- Fixed an issue with settings inheritance that caused environment-global anomaly detection settings to be ignored for services that don’t belong to a host group, which caused a fallback to default settings. (PS-32294)
- Containerized private Synthetic locations: Changed requirements for S-size containerized location node disk space from 6 Gi to 8 Gi. (DEM-7206)
- Fixed potential false positive alerts when missing data alerts are enabled in Davis anomaly detector and Grail runs into the timeout of 10 seconds. (DI-20078)
Dynatrace API
To learn about changes to the Dynatrace API in this release, see Dynatrace API changelog version 1.313.