Add a variable to a dashboard
- Latest Dynatrace
- How-to guide
- 10-min read
Use variables to filter your dashboards, to act as variable values in code tiles, and as placeholders in tile titles and Markdown tile text.
dt.entity.* fieldsIf you see the following message:
The dt.entity.* fields are deprecated. Please use dt.smartscape.* fields instead.
we recommend that you use an equivalent dt.smartscape.* field instead.
The deprecated dt.entity.* fields will eventually be removed.
Add a variable
To add a variable to a dashboard
-
In the dashboard header, open the (Add) menu and select Variables.
Keyboard shortcut: Shift+V
The Variable panel is displayed.
-
Define the variable.
-
Name: the name of the variable.
- Only alpha-numerical values are allowed
- Don't start a variable name with
dt_
-
Type: can be one of the following:
- DQL: the value is returned from a query you enter when you define the variable.
- Select Run to test your query.
- Code: the value is returned from code you enter when you define the variable.
- List: a comma-separated values (CSV) list of values.
- To define possible values, enter them (separated by commas) in the box under Data.
- To define a default value, select one from the Default value list.
- To allow multiple values to be selected at the same time, turn on Multi-select.
- Free Text: free text. You can enter a Default value. Your changes are saved automatically.
- DQL: the value is returned from a query you enter when you define the variable.
-
-
Set Display settings.
-
If the variable dropdown should be displayed on the dashboard, turn on Display as filter on dashboard.
Turn it off when you want it hidden, such as when the variable is used as a static value across tiles but should not be displayed to the dashboard user. -
If your dashboard's users should be able to select multiple values at the same time within the variable dropdown, turn on Multi-select.
Turn it off when you want to use only single values of the variable dropdown. -
Select a Default value for the variable dropdown. If you don't enter anything in this field, the first available value is selected.
-
-
When you're finished, select < Variable at the top to go to the Variables panel, or select to dismiss the Variables panel.
Variables in dashboards can be defined to depend on other variables.
-
The value of a variable is recalculated if its definition refers to another variable and the other variable's value changes.
For example, if the value of variable A changes, the value of any variable whose definition refers to variable A is recalculated.
-
Loops aren't allowed.
For example, if the value of variable A depends on the value of variable B, the value of variable B can't depend on the value of variable A.
How you edit a variable depends on the Type. For details and examples, see:
Use a variable
After you create a variable, you're ready to use it in a query.
Always remember to prepend a variable name with $ in your queries.
For example, if you create a variable named MyTotal, you need to refer to it as $MyTotal in your query.
For example:
-
Open the menu and select Variables to add a variable to your dashboard.
-
Define the following variable:
- Name:
Host - Type: DQL
- Query:
fetch dt.entity.host| fields entity.name
- Name:
-
Turn on Multi-select so you can select more than one value at a time to show in your visualizations.
Your changes are saved automatically.
-
Select to dismiss the Variable panel.
Use with a DQL tile
-
Open the menu and select DQL.
-
Copy and paste the following query into the DQL box and select Run.
Note that the query refers to our new
Hostvariable as$Host, with the dollar sign indicating that it's a variable name.fetch logs, scanLimitGBytes: 20| filter in(host.name, array($Host))| makeTimeseries count(), by:{ host.name }or when not using a multi-select variable you can reference it like
fetch logs, scanLimitGBytes: 20| filter host.name == $Host| makeTimeseries count(), by:{ host.name } -
Because you added a multi-select variable, you can use the value selector to determine which values are displayed in your visualizations.
-
You can of course use your variable in multiple queries.
Use with an Explore tile
To use a variable in an Explore data tile
-
Open the menu and select Logs.
-
Select and then select host.name from the Available filters.
-
In the added filter field, type
$to get suggestions for all available variables and then select$Host.
Note: Adding variables in Explore tiles only works for single-select variables in combination with the = operator.
List variables
To list all variables, do one of the following:
-
Open the menu and select All variables.
Note that this menu is available only after you add at least one variable to a dashboard.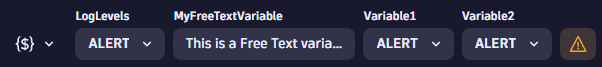 Dashboards: example: variables on a dashboard
In this example, four variables are defined for the dashboard—
LogLevels,MyFreeTextVariable,Variable1, andVariable2—and we can see their current values under their names. -
Select the settings icon in the upper-right corner of the dashboard, and then select Variables.
Example:
In the above example:
-
Four variables are defined for the dashboard—
LogLevels,MyFreeTextVariable,Variable1, andVariable2. -
Two of the variables—
Variable1andVariable2—display a warning icon. For details, see the Troubleshoot variables section.
From here, you have the following variable-specific options:
-
To review or change a variable definition, select its name.
-
To add a variable, select Variable.
-
To hide or display a variable, select .
-
To move a variable up or down the list, select and drag the variable to a new position in the list.
-
To see other variable-specific options—Edit, Duplicate, Move up, Move down, and Delete—open the menu.
Reset variables
To apply default values to variables, open the menu and select Reset to default.
This sets all variables to the default values specified in the variable configuration.
Edit a variable
-
Open the menu and select All variables.
-
In the Name column, select the name of the variable that you want to edit.
-
Edit and verify the variable.
How you edit a variable depends on the Type. For details and examples, see: -
Select to dismiss the Variables panel.
Delete a variable
To delete a variable from a dashboard
- Open the menu and select All variables.
- Find the variable you want to delete in the Name column, open the menu for that row, and select Delete.
- Select to dismiss the Variables panel.
Change variable values
If a dashboard has one or more variables, they are listed by name along the upper-left of the dashboard, under the dashboard name. When you change variable values, the dashboard contents are recalculated and displayed according to the new values.
To change the value of a variable
-
In the upper-left of the dashboard, locate the variable name.
-
Use the menu or edit box under the variable name to change the value.
- If the variable allows just one selection (value) at a time, select the value that you want to apply to the dashboard.
- If the variable allows multiple selections (values) at a time, select the checkbox for each value you want to apply to the dashboard. The menu name for that variable shows how many values are selected.
- For a Free Text variable, you can edit the text in the box under the variable name.
Change variable order
To change the order of variables in your dashboard
-
Open the menu and select All variables.
-
Drag the variables into the order you want.
Alternative: open the menu for the variable you want to move and select Move up or Move down
Variable types
DQL variable
To define a DQL variable
- Set Name the name you want to give your variable.
- It will be displayed at the top of the dashboard, listed on the Variables panel, and referred to in code.
- It can contain only letters (uppercase or lowercase) and numbers (for example,
status,myHosts, orVariable01) and it can't start withdt_.
- Set Type to
DQL. - In Data, enter a query. Be sure to use
summarizeandcollectDistinctto get distinct values from data sources such as logs. - Select Run and inspect the results in the Preview section to make sure it works as expected.
- If you want to be able to select more than one value at a time, turn on Multi-select.
If you add both examples below to your dashboard, you can filter your dashboard by host and log severity level. Be sure to turn on Multi-select if you want to select more than one at a time.
Example DQL variable
- Name: Hosts
- Type: DQL
- Definition:
fetch dt.entity.host| fields id
If you want to use a human-readable name, use | fields entity.name instead of | fields id.
Variable replacement
In DQL tiles, you have four options for wrapping a variable value and how the variable placeholder is replaced before the query is executed. These options apply only to DQL tiles and are ignored for Code and Markdown tiles.
$varName
default
If you don't specify a strategy (for example, $varName), the variable value is wrapped in doublequote (") characters. This is useful for strings such as entity names or categories.
-
Any quotes inside the variables are escaped and ignored
-
To escape a doublequote character, use a double backslash:
\\"
For example, for a service named PaymentBackend, in a DQL query where we filter for this service, with the default strategy, we would replace the variable placeholder after the = on the right side of the filter like this:
| filter dt.entity.service = "PaymentBackend"
$varName:noquote
If you follow the variable name with :noquote (for example, $varName:noquote), the variable value is not wrapped with quotes. This is useful for numbers, units, or function names.
- Only alphanumeric characters and dot (
.), underscore (_), and hyphen (-) are allowed - The query fails if values contains any other characters
For example, for a service named PaymentBackend, in a DQL query where we filter for this service, with the no-quote strategy, we would replace the variable placeholder after the = on the right side of the filter like this:
| filter dt.entity.service = PaymentBackend
$varName:backtick
If you follow the variable name with :backtick (for example, $varName:backtick), the variable value is wrapped in backtick characters.
-
To escape a backtick, use a double backslash:
\\` -
Any backticks inside the variables are escaped and ignored
-
Example use: field identifiers
For example, for a service named PaymentBackend, in a DQL query where we filter for this service, with the backtick strategy, we would replace the variable placeholder after the = on the right side of the filter like this:
| filter dt.entity.service = `PaymentBackend`
$varName:triplequote
If you follow the variable name with :triplequote (for example, $varName:triplequote), the variable value is wrapped in """ characters. This is useful for raw content such as JSON without escaping.
- Nothing is escaped within the value
- Query fails if the value contains
"""
For example, for a service named PaymentBackend, in a DQL query where we filter for this service, with the triple quote strategy, we would replace the variable placeholder after the = on the right side of the filter like this:
| filter dt.entity.service = """PaymentBackend"""
List variable
To define a List variable
-
Set Name to the name you want to give your variable.
- It will be displayed at the top of the dashboard, listed on the Variables panel, and referred to in code.
- It can contain only letters (uppercase or lowercase) and numbers (for example,
status,myHosts, orVariable01) and it can't start withdt_.
-
Set Type to
List. -
In Data, enter a comma-separated list of possible values for this variable, such as
dog,cat,horse. Be sure to trim extra spaces from your list. -
Inspect the results in the Preview section to make sure it works as expected.
-
If you want to be able to select more than one value at a time, turn on Multi-select.
Your changes are saved automatically.
-
Close the Variable panel.
Example List variable
This example would add a $Status variable to your dashboard with the ability to select more than one status at a time, and with four possible values: WARN, ERROR, INFO, NONE.
- Name: Status
- Type: List
- Definition:
WARN,ERROR,INFO,NONE
- Multi-select: on
Code variable
To define a code variable
-
Set Name the name you want to give your variable.
- It will be displayed at the top of the dashboard, listed on the Variables panel, and referred to in code.
- It can contain only letters (uppercase or lowercase) and numbers (for example,
status,myHosts, orVariable01) and it can't start withdt_.
-
Set Type to
Code. -
In Data, enter the JavaScript code.
For security reasons, when using variables in code tiles, you can only access them within the default function.
-
Select Run and inspect the results in the Preview section to make sure it works as expected.
-
If you want to be able to select more than one value at a time, turn on Multi-select.
Your changes are saved automatically.
-
Close the Variable panel.
Example code variable
- Name: CodeVariable
- Type: Code
- Definition:
/** This will run JavaScript in the DYNATRACE* serverless environment.* To generate variable options return string array.*/export default async function () {return ["val1", "val2", "val3"]}
Free Text variable
To define a Free Text variable
- Set Name the name you want to give your variable.
- It will be displayed at the top of the dashboard, listed on the Variables panel, and referred to in code.
- It can contain only letters (uppercase or lowercase) and numbers (for example,
status,myHosts, orVariable01) and it can't start withdt_.
- Set Type to
Free Text. - You can enter a Default value.
Limitations when using variables in tiles
- Variables in your tiles can be of string or numeric type. Cases requiring a different data type (for example, duration) lead to failed queries. Below are some examples of how to work around such situations.
- For security reasons, when using variables in code tiles, you can only access them within the default function.
Resolution in DQL command
Straightforward usage of a $resolution variable (as in the following query) doesn't work because resolution requires a predefined data format, while a variable returns a string value.
fetch logs| ...| summarize count(), by: {loglevel, bin(timestamp, $resolution)}
As a workaround, you can use the duration function together with a DQL conversion function. This provides the required output based on your $resolution value.
fetch logs| ...| summarize count(), by: {loglevel, bin(timestamp, duration(toLong($resolution), unit:"m"))}
Convert your variable values to other data types
If you want to filter a numeric value but compare it with a string representation, you can use a native DQL conversion function such as toString.
fetch logs| filter amount = toString($amount)| ...
Maximum total size of variables in dashboard URL
If variable values are larger than 30 KB, they can't be stored in the dashboard URL.
- If you share a dashboard URL with variable values that exceed the size limit, the variable values won't be stored in the URL, so a person opening the dashboard from the shared URL won't see the selected values.
- If you save a dashboard URL as a bookmark with variable values that exceed the size limit, and you open the dashboard from that bookmark after 90 days, the selected values won't be set.
Troubleshoot variables
A dashboard with one or more variables defined displays the variables in a row under the dashboard name. In this example, you can see:
- The variables menu
- Four variables:
LogLevels,MyFreeTextVariable,Variable1, andVariable2 - A warning icon
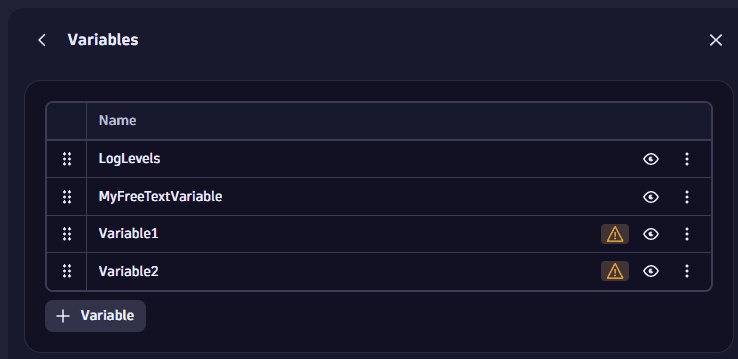
To investigate the warning, select the warning icon (or select > All variables) to list all variables.
- There are the four variables again:
LogLevels,MyFreeTextVariable,Variable1, andVariable2. - Two of those variables—
Variable1andVariable2—display a warning icon, indicating possible issues with each of them. To see why there's a warning for a specific variable, select it.
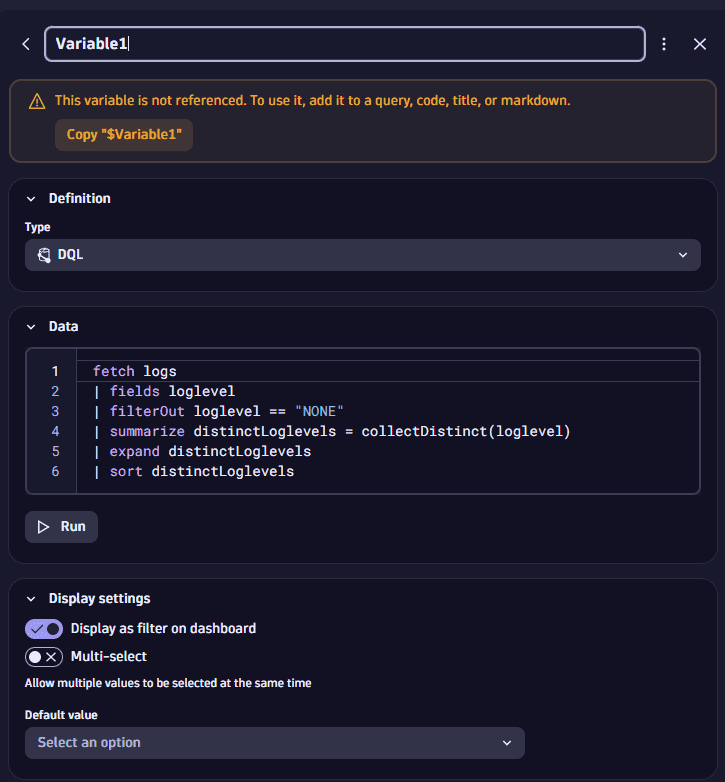
In this example, we selected Variable1 to display the variable definition and any related error or warning message. From here, we see that we forgot to reference the variable anywhere.