Notebooks
- Latest Dynatrace
- App
- 11-min read
Prerequisites
Permissions
The following table describes the required permissions.
With  Notebooks, you can create powerful, data-driven documents for custom analytics.
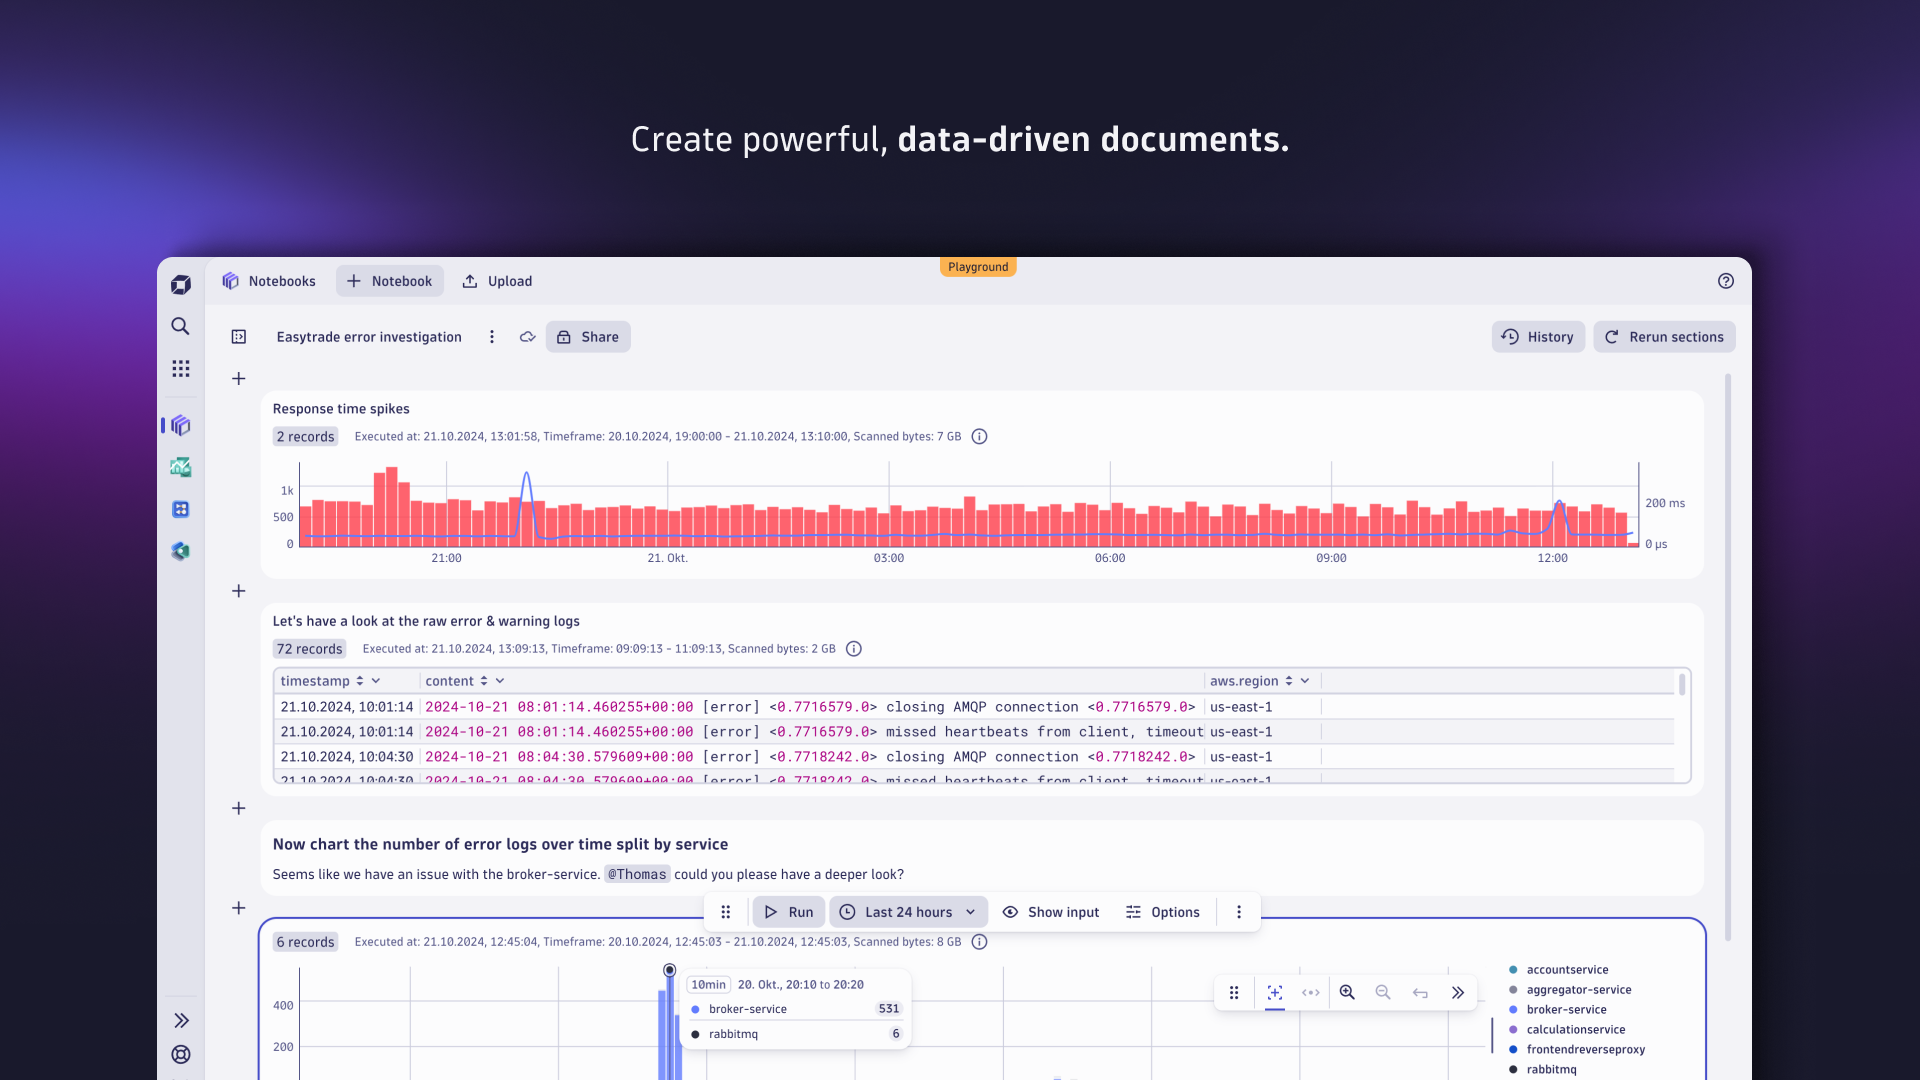
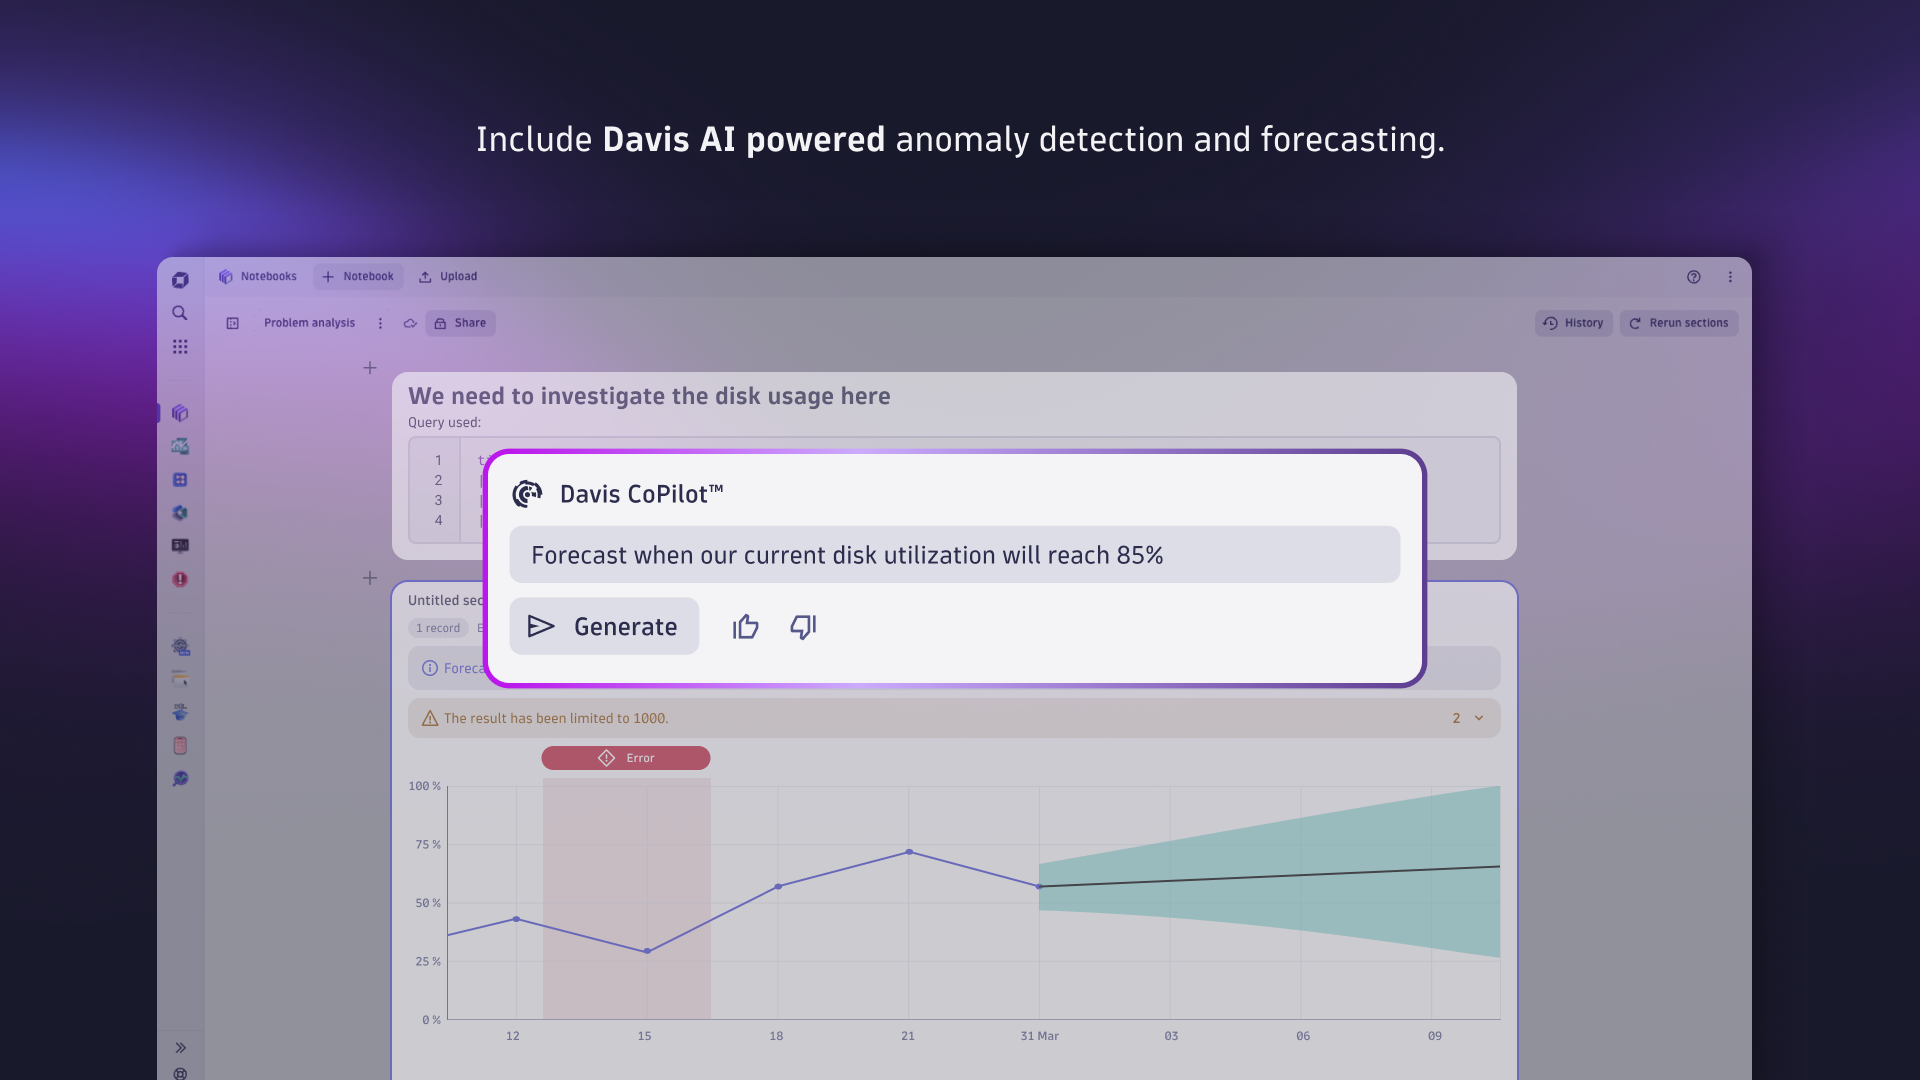
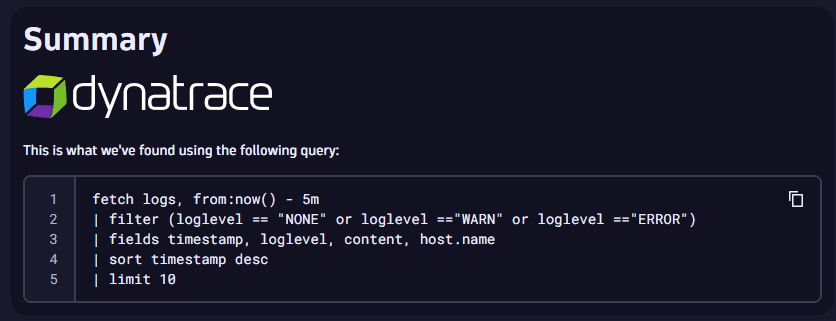
These procedures describe the basics of using Notebooks and get you started on the way to customizing and creating your own dashboards.
Learning tips
A fast way to learn about notebooks is to open a ready-made notebook, make a copy, and start experimenting. You can undo and redo as needed.
Open a ready-made notebook
To open a ready-made notebook
-
Go to
Notebooks. -
In the Notebooks panel, select Ready-made notebooks.
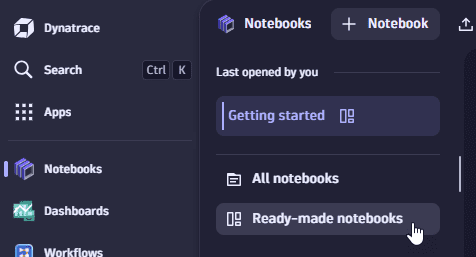 Select "Ready-made notebooks"
Alternatively, you can select All notebooks and then change the tab at the top of the table from All to Ready-made.
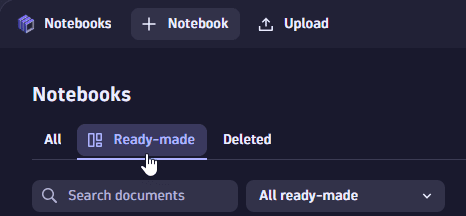 Notebooks: Select "Ready-made" tab
 -
Select a notebook to open it.
Make a copy
To make a copy of the current notebook
- At the top of the notebook, open the menu next to the notebook name.
- Select Duplicate from the menu.
Alternatively, go to the Last opened by you section of the sidebar, hover over the notebook you want to copy, and select > Duplicate.
Undo and redo
You can quickly undo or redo a notebook edit.
-
The (Undo) and (Redo) controls are displayed in the upper-left of your notebook after you make a change.
-
If you prefer, you can use keyboard shortcuts.
Undo Redo Windows Ctrl+Z Ctrl+Shift+Z Mac Cmd+Z Cmd+Shift+Z
The number of undos could be limited depending on your notebook's size.
Use notebooks
Use shortcuts
keyboard shortcuts help you work faster in Notebooks.
To list keyboard shortcuts, in Notebooks, open the menu and select Keyboard shortcuts or use keyboard shortcut Shift+?
| Action | Keyboard shortcut |
|---|---|
General | |
Close section | Esc |
Add section | Ctrl/Cmd+Shift+Enter |
Move section down | Ctrl/Cmd+Alt+ |
Move section up | Ctrl/Cmd+Alt+ |
Delete selected sections | Del |
Duplicate selected sections | Ctrl/Cmd+Shift+D |
Select all | Ctrl/Cmd+A |
Undo | Ctrl/Cmd+Z |
Redo | Ctrl/Cmd+Shift+Z |
Open with… | O |
Data sections | |
Add section | Shift+D |
Run query | Ctrl/Cmd+Enter |
Code sections | |
Add section | Shift+C |
Execute code | Ctrl/Cmd+Enter |
Markdown sections | |
Add section | Shift+M |
Toggle between view and edit mode | Ctrl/Cmd+Enter |
List notebooks
To list notebooks
-
Go to
Notebooks. -
In the Notebooks panel, select All notebooks.
-
To sort the table, select the Name, Created, Modified, or Opened by you header.
-
To filter the table, you have several options:
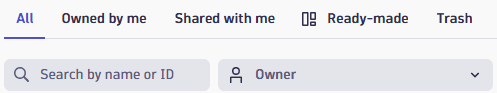 Listing your documents: filter options
- All: list all notebooks.
- Owned by me: list only notebooks you own.
- Shared with me: list only notebooks someone else owns but which are shared with you.
- Ready-made: list only ready-made notebooks. You can further filter the Ready-made tab by notebook source:
- All ready-made
- Dynatrace
- Extensions
- Trash: list notebooks in the trash can.
- : filter the table by notebook name or ID.
- Owner: filter the table by owner (available on All and Shared with me tabs).
-
Find a notebook
The easiest way to search for a notebook is through the global search.
The search can be triggered from any context using the Ctrl/Cmd+K keyboard shortcut. Notebooks with matching titles will show up in the results.
Alternatively, list all notebooks and then enter a search term to list only matching notebooks.
Create a notebook
To create a new notebook
- Go to Notebooks.
- In the app header, select Notebook.
Now you need to create one or more sections within your notebook. For details, see Create a section.
Duplicate a notebook
To make a copy of the current notebook
- At the top of the notebook, open the menu next to the notebook name.
- Select Duplicate from the menu.
Alternatively, go to the Last opened by you section of the sidebar, hover over the notebook you want to copy, and select > Duplicate.
Pin notebook to Dock
To add a notebook to the Dock for easy access
-
Display the notebook.
-
Open the menu next to the notebook name (in the upper-left corner of the notebook).
-
Select Add to dock.
If you change the name of the notebook, it's automatically updated on the Dock.
To remove a notebook from the Dock
- Hover over the notebook name in the Dock.
- Select Unpin from dock.
Delete a notebook
To delete a notebook
- At the top of the notebook, open the menu next to the notebook name.
- Select Delete from the menu.
Alternatively, you can also trigger the same action in the Last opened by you section of the sidebar. Select > Delete.
To delete multiple notebooks, select All notebooks and use the buttons in the table.
Create a section
Every notebook needs one or more sections.
Create a Prompt section
To create a notebook section using Dynatrace Intelligence agentic and generative AI to translate your natural language questions into DQL queries
-
Go to
Notebooks and open or create a notebook you can edit. -
Open the Add menu and select Prompt. A new Generative AI notebook section is created with an empty prompt box.
-
In the prompt box, type a prompt. Try
average cpu usage percentage by hostor see the examples displayed in the web UI for inspiration. -
Optional If your prompt doesn't specify the timeframe, you can still specify it in your section header. The default is Last 2 hours.
-
Select Run. Generative AI creates and runs the query for you.
Optional If you want to see the generated query before running it, open the menu next to the Run button and select Generate DQL only.
-
Review the results.
- You can review the query by expanding DQL on the right.
- Optional You can't edit the query directly in Dynatrace Intelligence generative AI, but you have two options for reusing it:
- Copy the query and paste it elsewhere manually.
- Open the menu in the section header and select Create DQL section to create a DQL section from this query.
- You can edit your original prompt, regenerate the query, and run it to update the results.
If you select Rerun sections, the Notebooks app will first check if any prompts have been edited.- If a prompt has been edited, the DQL will first be regenerated and then run.
- If no prompts have been edited, the existing generated DQL will simply be run.
-
Optional Select the Options in the section header to change the visualization (refer to the visualization-specific documentation for more information).
Automatically select visualization
To have Dynatrace automatically select a visualization for your query, turn on Auto select in the upper-right corner of your visualization settings pane.
- If you manually select a different visualization, the Auto select switch will turn off.
- To have Dynatrace once again automatically select a visualization, turn Auto select back on.
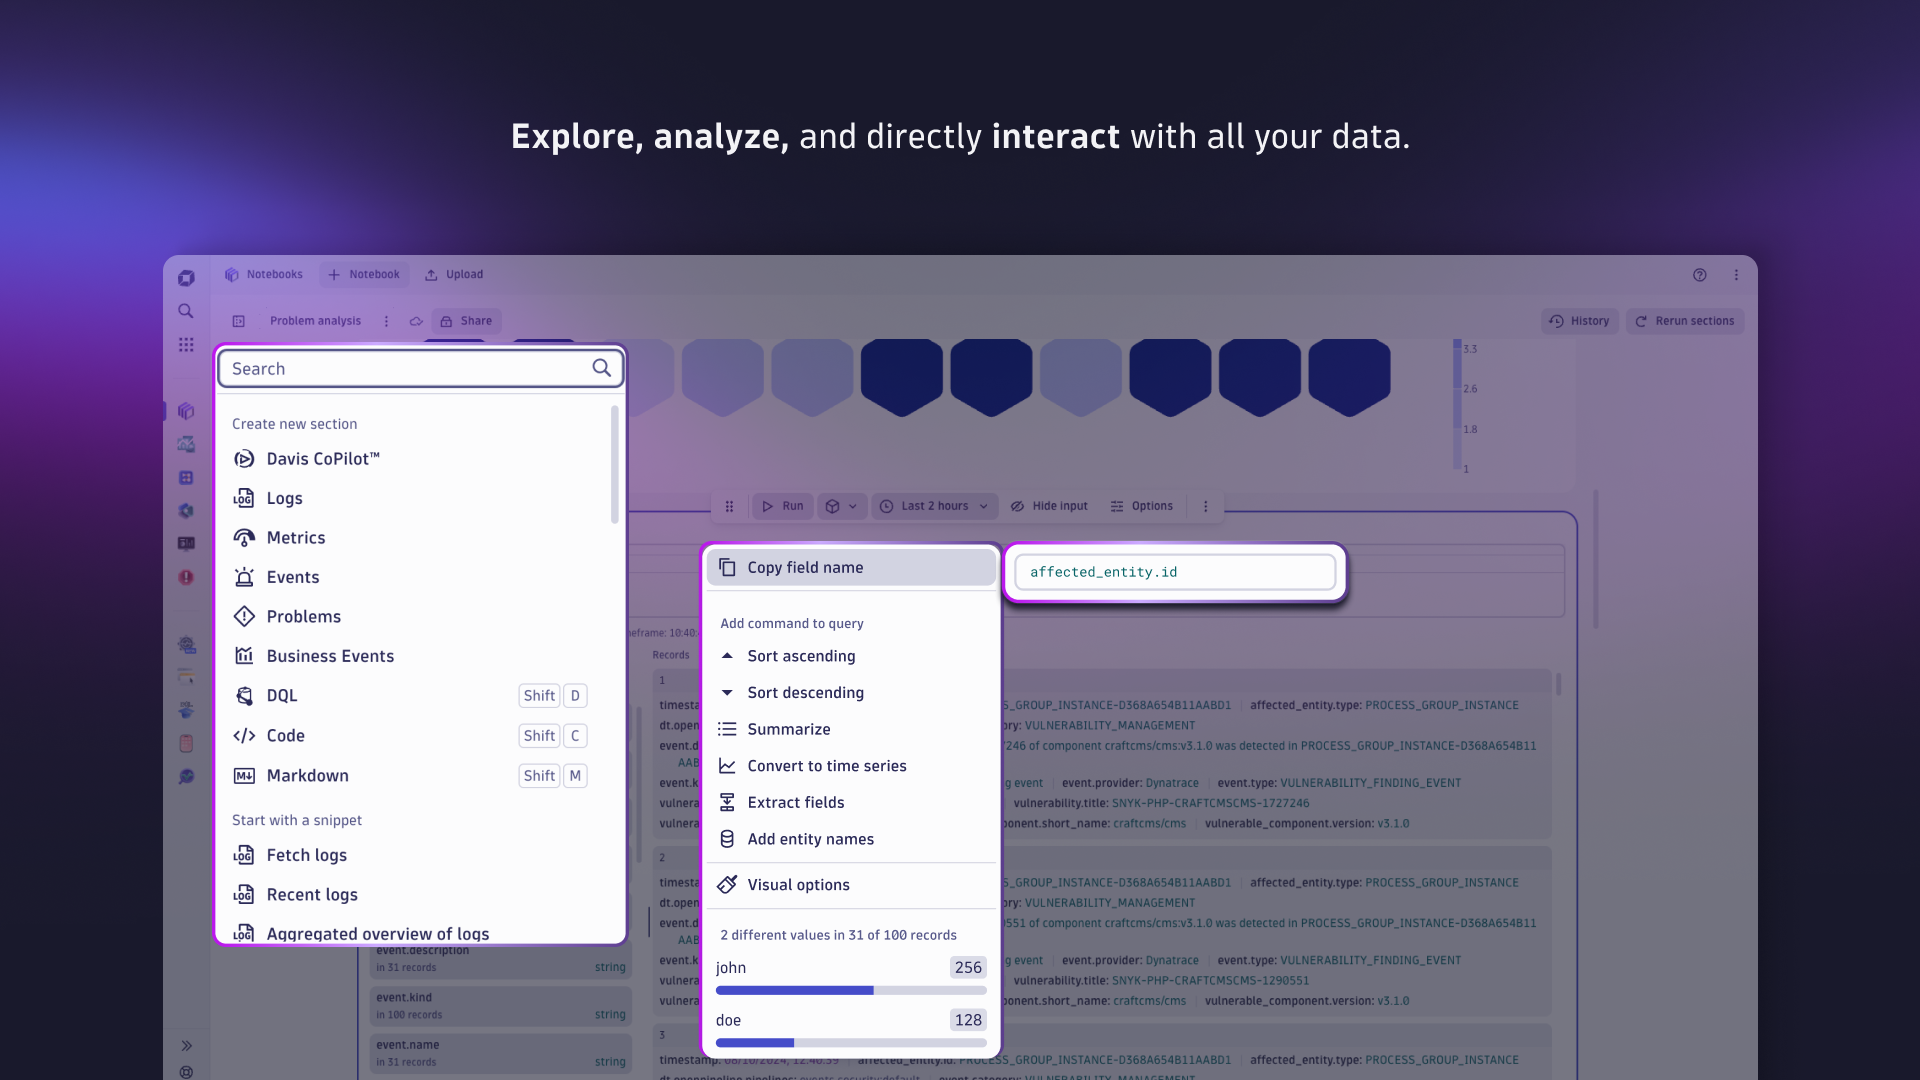
Create an Explore section
The Explore sections offer the easiest way to get started.
- To learn more about Explore sections first, see Explore data.
- To dive right in, just display a notebook, open the (Add) menu, and select an Explore option such as Logs, Metrics, Events, Problems, or Business Events.
Create a Grail query section
The fastest and easiest way to explore your data is with an Explore section. In a few seconds, you can find and analyze your logs, metrics, or business events. No DQL required!
dt.entity.* fieldsIf you see the following message:
The dt.entity.* fields are deprecated. Please use dt.smartscape.* fields instead.
we recommend that you use an equivalent dt.smartscape.* field instead.
The deprecated dt.entity.* fields will eventually be removed.
To add data to a notebook
-
Open the (Add) menu and select DQL.
Keyboard shortcut: Shift+D
An empty section is added to the notebook and an Options side panel opens on the right.
-
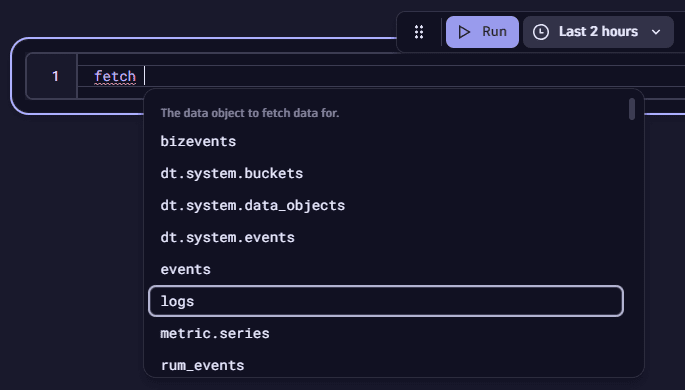
In the section edit box, use the Dynatrace Query Language (DQL) to define your query.
-
Select Run to execute the DQL query.
Keyboard shortcut: Ctrl/Cmd+Enter
Notebooks automatically visualizes the result. -
Select Add title to add the title header to this notebook section.
-
Select a visualization to display your results in your preferred format. Adjust visualization settings as needed.
Automatically select visualizationTo have Dynatrace automatically select a visualization for your query, turn on Auto select in the upper-right corner of your visualization settings pane.
- If you manually select a different visualization, the Auto select switch will turn off.
- To have Dynatrace once again automatically select a visualization, turn Auto select back on.
Create a code section
To add code fetching data for your notebook using Dynatrace functions
-
Open the (Add) menu and select Code.
Keyboard shortcut: Shift+C
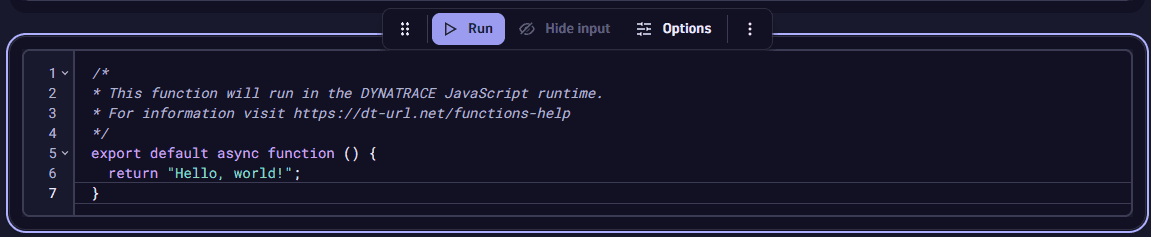
Notebooks creates a code section with sample JavaScript code in the edit box. -
Select Run to execute the code.
Keyboard shortcut: Ctrl/Cmd+Enter
Notebooks runs the sample code and displays the result: "Hello, world!" -
Edit the section as needed.
- To change the code, edit it directly in the edit box above the result. For details, see App functions.
- To configure the visualization, select Options. For details, see Edit visualizations for Notebooks and Dashboards.
To try an example code section
-
In your notebook, open the (Add) menu, scroll down the menu to the Library section, and select any of the code section examples.
This adds the selected example code section to your notebook.
-
Read the comments in the code example for essential details.
Create a Markdown section
To add a Markdown-formatted annotation to a notebook
-
Open the (Add) menu and select Markdown.
Keyboard shortcut: Shift+M
-
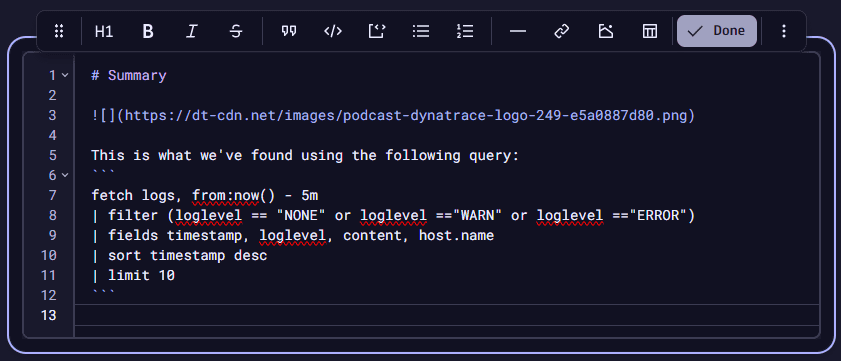
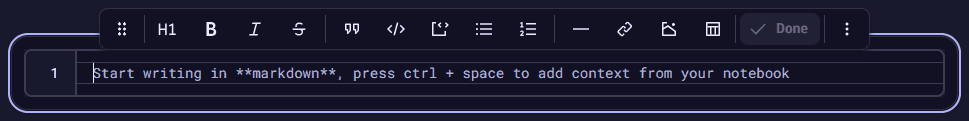
Enter your text. Use Markdown to format your text and add links and images.
- While you're typing in the edit box, your Markdown is rendered in the section.
- Press Ctrl+Space on an empty line to pop up a selectable list of available Markdown elements.
You can use the toolbar to insert common elements like a heading, bold text, or a link:
 Example: Notebooks: edit Markdown section
-
Italics: wrap text in single asterisks (
*like this*) to get italics like this. -
Bold: wrap text in double asterisks (
**like this**) to get bold text like this. -
Strikethrough: wrap text in double tildes (~~like this~~) to get strikethrough (crossed out) text
like this. -
Blockquote: start a line with
>to get blockquotes, where everything before you press Enter is quoted. -
Code:
- Wrap text in backticks (`like this`) to get code text
like this. - Wrap text in triple backticks (```like this```) to show a code block (multiple lines of
code text).
- Wrap text in backticks (`like this`) to get code text
-
Headings: start a line with one or more
#characters to create headings. -
Horizontal line: to visually separate sections of your annotation, add a horizontal line with three dashes (
---). -
Lists: each line of an unordered (bulleted) list starts with an asterisk (
*):* Line 1* Line 2Alternatively, you can use a dash (
-):- Line 1- Line 2An ordered (numbered) list starts with a number and a period (
1.) followed by a space and then your text:1. The first line of my procedure.2. The second line of my procedure.3. The third line of my procedure.If you use
1.for each line number, the lines are renumbered automatically when you display the notebook. -
Tables: to add a table, define the headers, the column formatting row, and then the rows of data you want to display
| Header 1 | Header2--- | ---content2 | content2 -
Special characters: you can use any printable characters, including emojis such as 😃 and 🌍 and ❤️.
-
Links: You can link to other places in your notebook and elsewhere.
A link in Markdown is a label and link of the form
[label](address), where:- The
labelis freeform text to display on the link in your Markdown tile or section - The
addressspecifies what to open when someone selects the link, such as a website or a Dynatrace app
Link to Syntax and examples Website
[My label](https://www.example.com/)Notebooks app
[My label](/ui/apps/dynatrace.notebooks/notebooks)Specific notebook
Syntax:
[label](/ui/apps/dynatrace.notebooks/notebook/<notebookid>)Example:
[My label](/ui/apps/dynatrace.notebooks/notebook/274edae4-dfe8-41fb-aced-5020fb1270bc)To get the address
- Display the target notebook.
- Copy everything on the browser address line starting from
/ui/. - Paste it into your Markdown as the address of a link.
Specific notebook section
Syntax:
[label](/ui/apps/dynatrace.notebooks/notebook/<notebookid>#<sectionid>)Example:
[My label](/ui/apps/dynatrace.notebooks/notebook/274edae4-dfe8-41fb-aced-5020fb1270bc#cb69caf1-52ed-4e73-8a3e-120e8cd7e8f8)To get the address
- Display the target notebook.
- Select the target section of the notebook.
- Copy everything on the browser address line starting from
/ui/. - Paste it into your Markdown as the address of a link.
Dashboards app
[My label](/ui/apps/dynatrace.dashboards/)Specific dashboard
Syntax:
[label](/ui/apps/dynatrace.dashboards/<dashboardid>)Example:
[My label](/ui/apps/dynatrace.dashboards/dashboard/9f24c36e-ca5f-401c-8e00-5e4b05c46bd2)To get the address
- Display the target dashboard.
- Copy everything on the browser address line starting from
/ui/. - Paste it into your Markdown as the address of a link.
Specific dashboard tile
Syntax:
[label](/ui/apps/dynatrace.dashboards/dashboard/<dashboardid>#tileIds=n)Example:
[My label](/ui/apps/dynatrace.dashboards/dashboard/9f24c36e-ca5f-401c-8e00-5e4b05c46bd2#from=now%28%29-2h&to=now%28%29&tileIds=6)To include a specific tile ID in the link
- Display the target dashboard.
- Select the target tile in the target dashboard.
- Copy everything on the browser address line starting from
/ui/. - Paste it into your Markdown as the address of a link.
- The
-
Images:
There are three ways to add an image to Markdown:
- Add the URL of an image
- Upload an image file to the library
- Select an image from the library
To add an image to your Markdown
-
Add or edit Markdown.
-
On the Markdown toolbar, select and choose the image source:
-
Insert from URL: to add a link to a picture using this format:
 -
Upload image: to upload your image file to the image library and add it to your Markdown. Use one of these methods:
- Select
 and browse for the image file you want to upload.
 - Drag an image file to the window.
From this point, you can also select Library to browse for an image from a library of previously uploaded images.
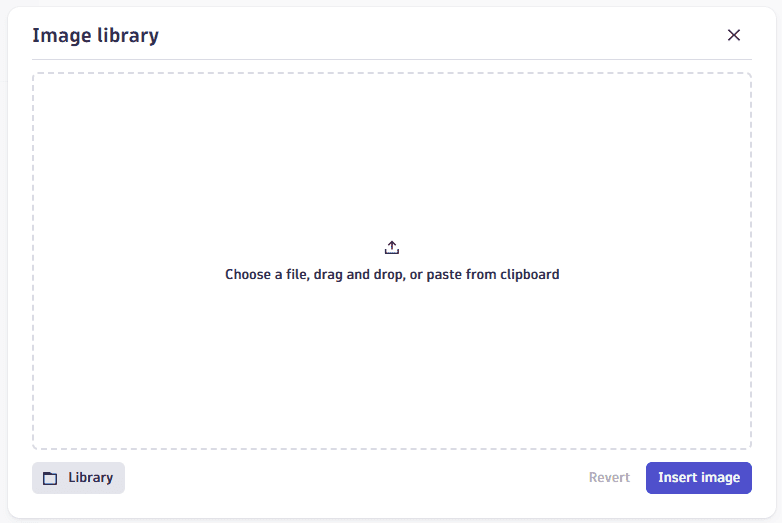 "Image library" window
 - Select
-
Media library: to select an image from a library of images you have already uploaded.
-
Start with a predefined section
Use predefined sections from the library to start your data analytics journey.
To add a predefined section to a notebook
-
In a notebook, select (Add).
Keyboard shortcut: Ctrl/Cmd+Shift+Enter
-
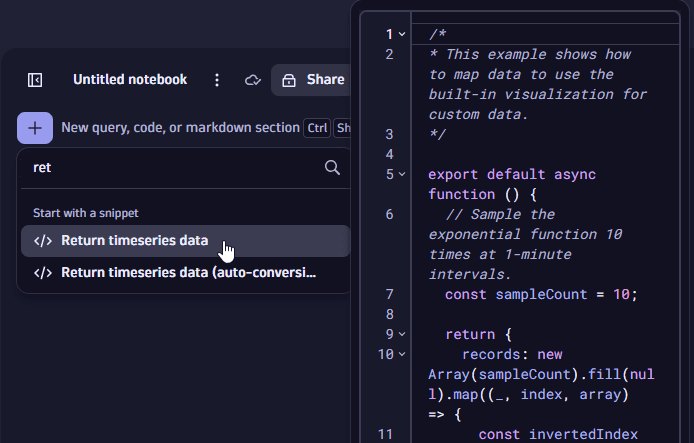
Scroll down to the Library section and choose a predefined section. For example, select Recent logs, which is displayed in a preview panel.
SearchUse the search box at the top of the menu to search for a section by name.
-
When you select a predefined section, it is added to your notebook.
-
Edit the query or code (depending on the section you selected) and the visualization settings as needed.
-
Select Run to see results.
Keyboard shortcut: Ctrl/Cmd+Enter
The list of available predefined sections is long and growing. Create a new notebook and try them out.
When you find something interesting:
- Inspect it to see how it works
- See if you can tweak and adapt it to your own purposes
Edit a section
Undo and redo
You can quickly undo or redo a notebook edit.
-
The (Undo) and (Redo) controls are displayed in the upper-left of your notebook after you make a change.
-
If you prefer, you can use keyboard shortcuts.
Undo Redo Windows Ctrl+Z Ctrl+Shift+Z Mac Cmd+Z Cmd+Shift+Z
The number of undos could be limited depending on your notebook's size.
Section edit controls
To see the edit commands for a section, select the section. If you have edit permission, the edit commands are displayed.
- is where you click to drag the selected section to a different position.
- Run starts your query. Keyboard shortcut: Ctrl/Cmd+Enter
- sets the segment.
- displays timeframe options.
- and decrement and increment the timeframe.
- and hide and show the input.
- opens the options panel, where you can select and adjust the visualization.
- opens a menu of further options:
- Copy section copies the selected section to the clipboard.
- Duplicate section creates a copy of the selected section.
- Create DQL section creates a DQL section from the selected Explore section.
- Move section up and Move section down move the section up or down one row.
Alternative: use to drag the section into a new position. - Clear result clears the result. Select Run (or Ctrl+Enter) again to get new results.
- Delete section removes the section from the notebook.
- Explain query displays an AI-generated summary of the query.
- Dynatrace Query Language opens DQL documentation.
- Copy query link copies a link to the clipboard. If you open the link in a browser, the query will be opened in a new or existing notebook.
- Download result downloads (exports) the result of the current notebook section.
 Add to dashboard opens the selected section in a dashboard.
- Open with opens the section in another document. For details, see Drilldowns and navigation.
You can select multiple sections and then apply the same command to all of them at once. For details, see Manage multiple sections.
Section edit panels
The available edit options will vary depending on the type of section you're editing.
-
Prompt section: type a plain-text prompt in the edit box and select Run (or Ctrl+Enter) to get an answer.
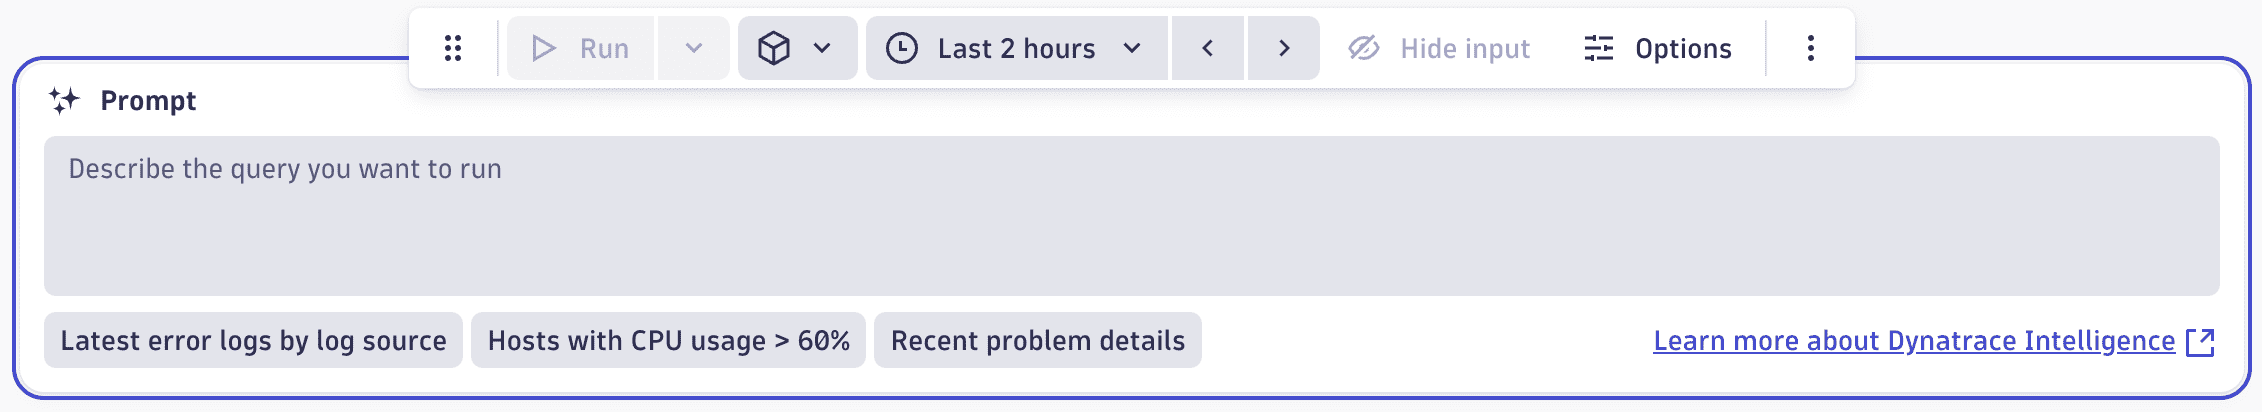 Editing the generative AI prompt section in the Notebooks app.
 -
Explore data section: These sections are a great shortcut to results. To learn more about Explore sections, see Explore data.
-
DQL section
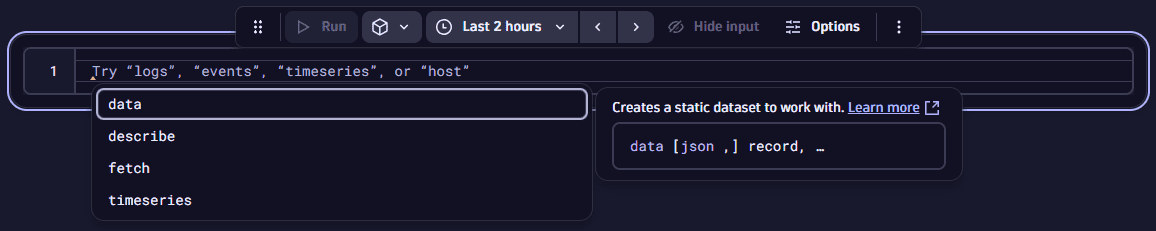 Example: Notebooks: edit DQL section
 -
Code section
 Example: Notebooks: edit Code section
 -
Markdown section
Example: Notebooks: edit Markdown section
Select section segments
To filter data for a section, you can specify segments for a section.
-
In the action bar for that section, select and, in Filter by segments, select a segment.
-
If the segment requires an additional value selection, select it now.
-
To add another segment, select Segment. Repeat this step for each segment you want to add for the selected notebook section.
-
Select Apply to apply the selection.
- The segment selector for that section now displays the name of the selected segment or, if you select more than one segment, the number of selected segments.
- To change your segment selection, select again, make your changes, and select Apply.
- To manage segments in general (list, create, view, edit, delete), select and then select the Manage segments link.
Set section options
To open the Options panel (where you can select and customize a visualization for your section)
- Select the section.
- Select Options.
Manage sections
Browse and manage sections
To navigate and reorganize notebooks—especially large notebooks—use the Sections panel.
-
Select (Settings) in the upper-right corner of the notebook to display the notebook's Settings panel.
-
Select Sections to display the notebook's Sections panel, which lists all sections in the current notebook.
Alternatively, you can open the [section count] sections menu in the upper-right corner of the notebook and select Manage sections.
From the Sections panel:
- To go to a section, select the section name in the Sections panel.
- To move a section, drag it into a new position in the Sections panel.
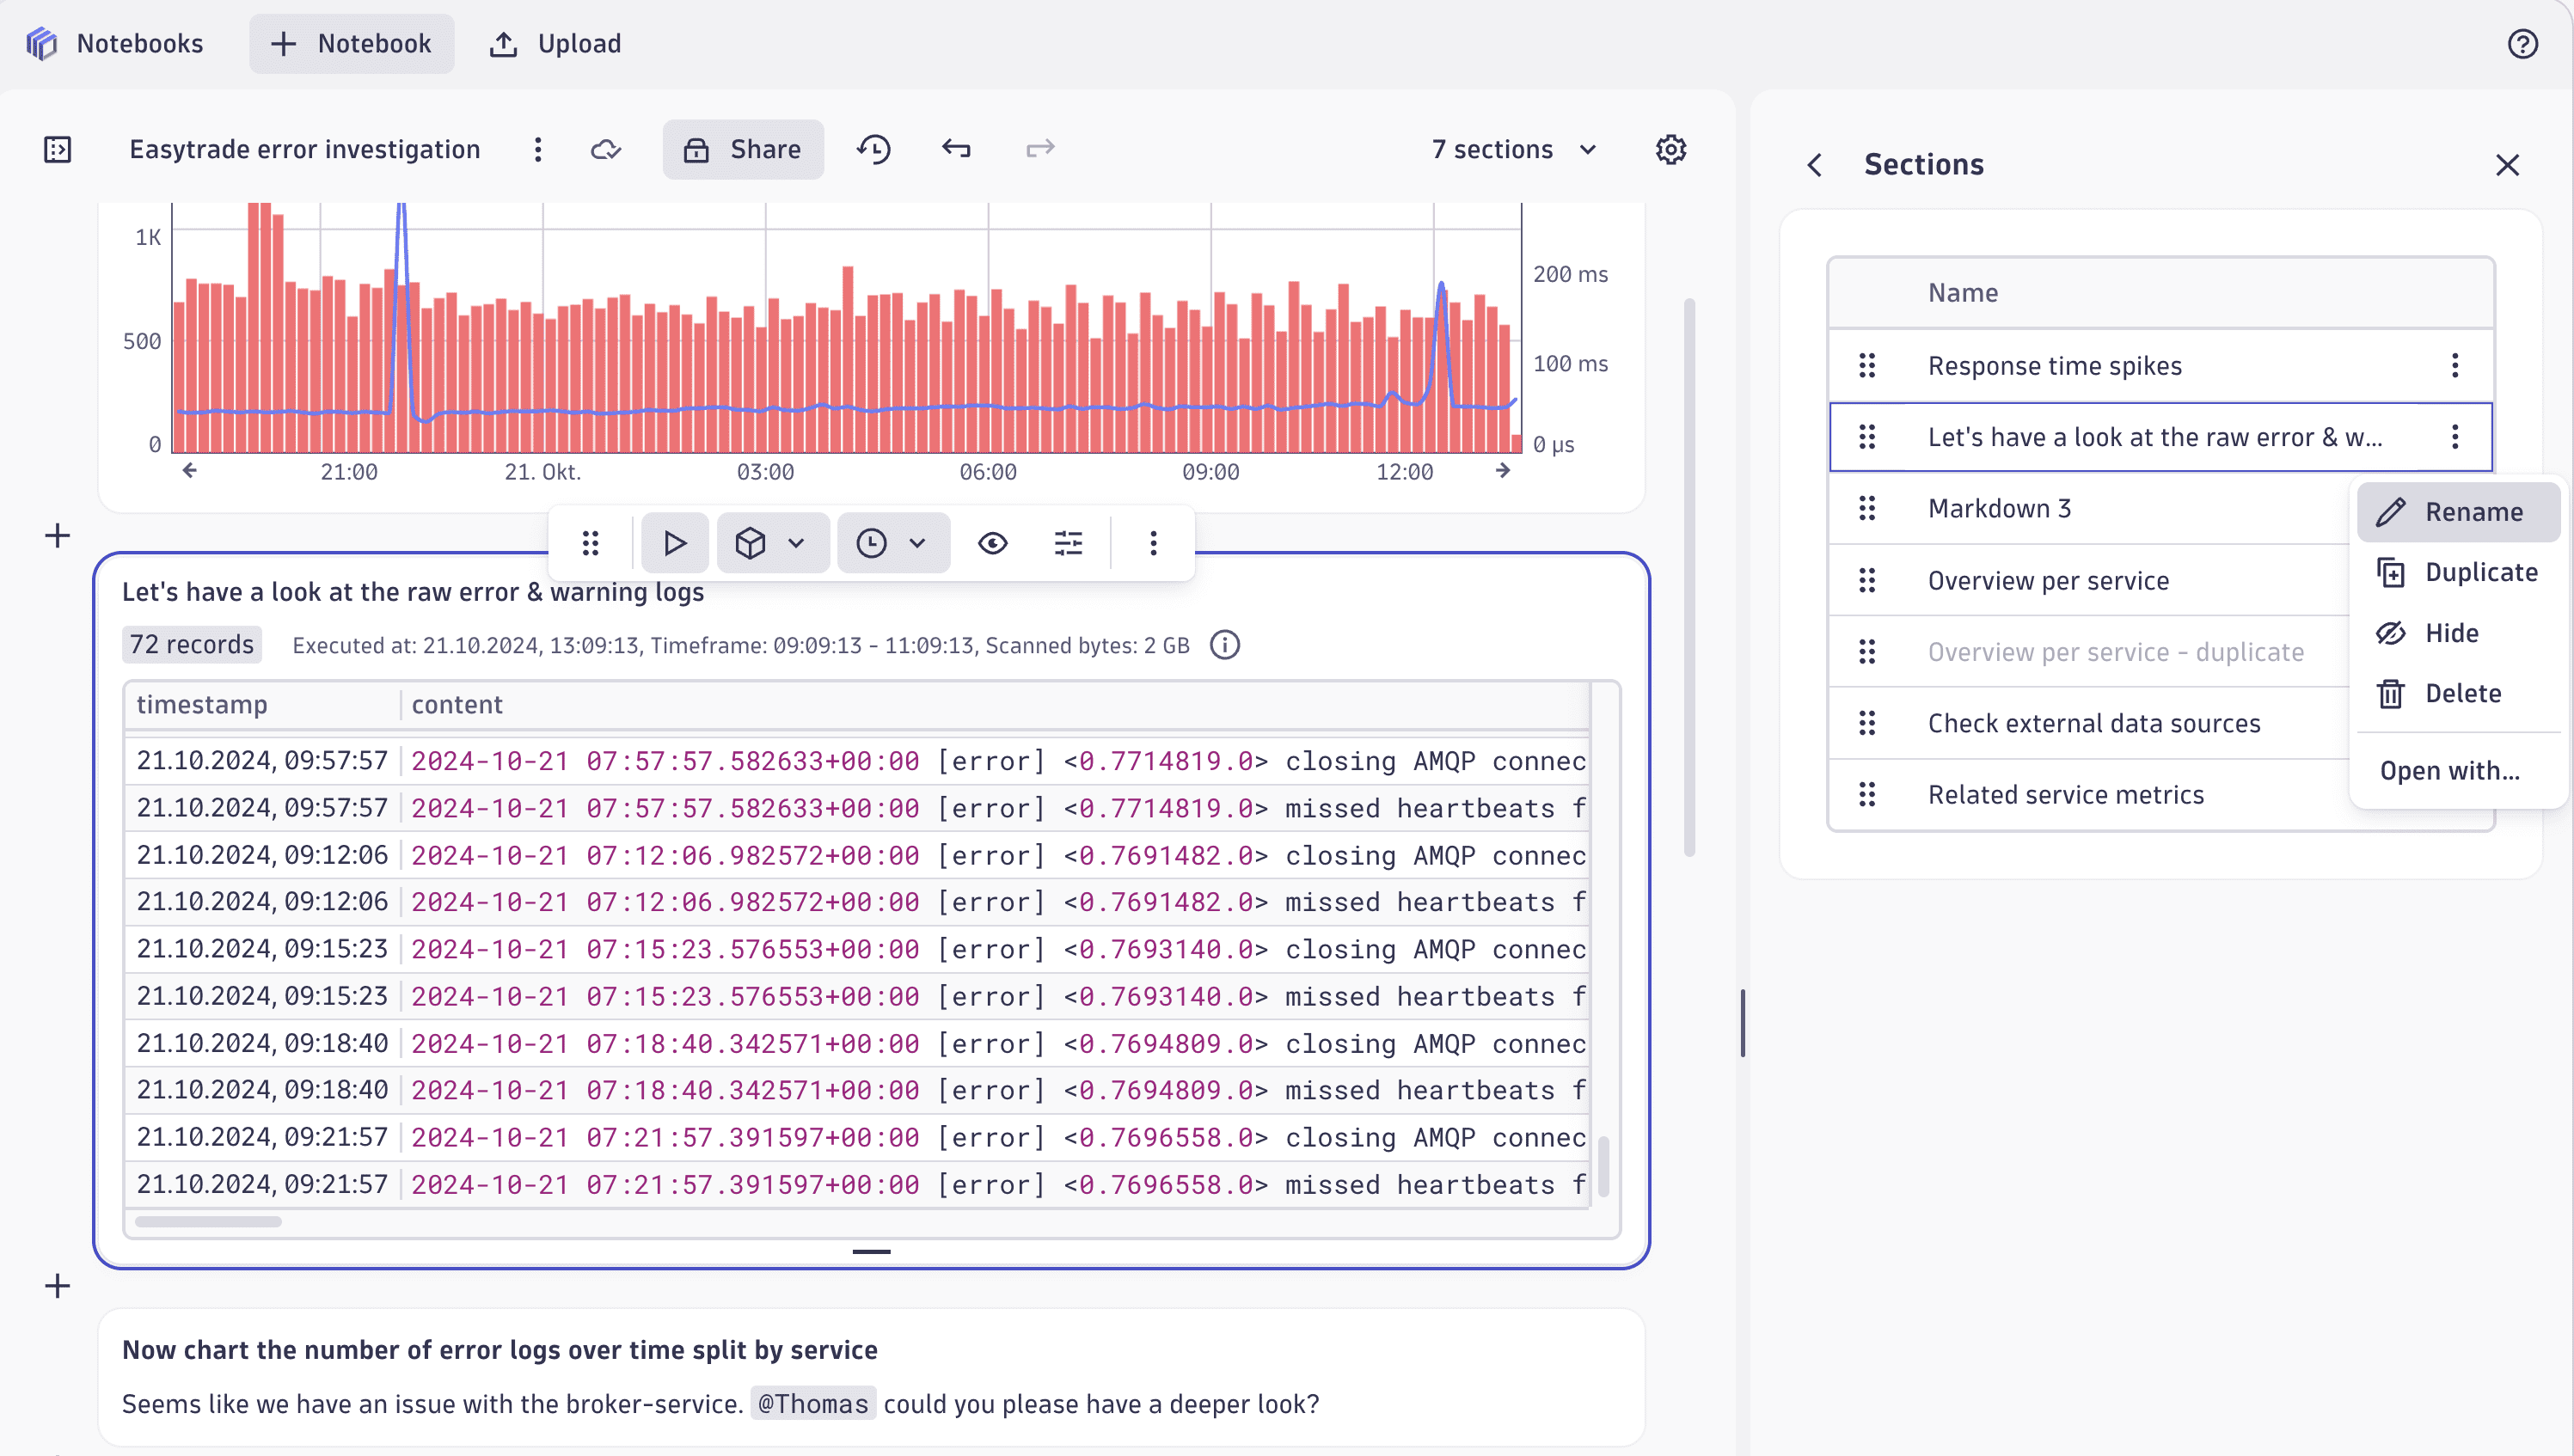
- Open the menu for quick access to other section commands:
-
Rename makes the selected section's name editable.
Alternatively, you can double-click the section name in the Sections panel to make it editable.
-
Duplicate makes a copy of the selected section and inserts it under the selected section.
-
Hide hides the selected section and grays out the section name in the Sections panel. This is useful for temporarily hiding rather than deleting a section.
Show displays the section again.
-
Delete removes the selected section from your notebook.
-
Open with opens the selected section in another Dynatrace app (for example,
Dashboards).
-
Undo and redo
You can quickly undo or redo a notebook edit.
-
The (Undo) and (Redo) controls are displayed in the upper-left of your notebook after you make a change.
-
If you prefer, you can use keyboard shortcuts.
Undo Redo Windows Ctrl+Z Ctrl+Shift+Z Mac Cmd+Z Cmd+Shift+Z
The number of undos could be limited depending on your notebook's size.
Move a section
- Display the Sections panel.
- Select and drag the section into a new position in the Sections panel. This automatically moves the corresponding section in the notebook.
Alternate method 1:
- Select the section in your notebook.
- In the section edit bar, select and drag the section to a new location within the notebook.
Alternate method 2:
-
Select the section in your notebook.
-
In the section edit bar, open the menu and select Move section up or Move section down.
Keyboard shortcut: Ctrl/Cmd+Alt+ or Ctrl/Cmd+Alt+
Copy and paste sections
You can copy and paste sections to the same notebook or another notebook.
An easy way to start a new notebook is to copy reusable sections from existing notebooks to a new notebook and then edit the copied sections in the new notebook.
To copy and paste one or more sections
-
Click one section to select it.
-
You can select multiple sections and then copy all of them at once.
- Shift+Click—selects one or more consecutive sections
- Ctrl/Cmd+Click—selects one or more nonconsecutive sections
- Ctrl/Cmd+A—selects all sections
Each selected section is highlighted
-
Press Ctrl/Cmd+C to copy the selected sections to your clipboard.
Menu alternative: on the section command bar, select Copy section.
-
Press Ctrl/Cmd+V to paste the copied sections.
-
Pasting the copied sections to the current notebook is the equivalent of the > Duplicate section menu command.
-
To paste the copied sections to a different notebook, switch to the other notebook (or select Notebook to create an empty notebook), and then paste (Ctrl/Cmd+V) the copied sections there.
-
-
To move the copied sections to new positions, select and drag them as needed.
You can select and drag one or more section at a time.
- Shift+Click—selects one or more consecutive sections
- Ctrl/Cmd+Click—selects one or more nonconsecutive sections
- The control is displayed on the section you selected last
Delete a section
To remove a section from your notebook
- Display the Sections panel.
- Open the menu and select Delete.
Alternate method:
-
Select the section.
-
In the section edit bar, open the menu and select Delete section.
Keyboard shortcut: Del
Copy a link to a section
To copy a link to a section
- Select the section.
- Select > Copy [section type] link.
Download results of a section
To download (export) the result of the current dashboard tile or notebook section to a local file
-
Select the tile or section.
-
On the command bar, open the menu and select Download result > [format].
The format options available depend on the visualization.
- CSV: The result is downloaded to a local comma-separated values (*.csv) file. This option includes table formatting such as visible columns and unit formatting.
- CSV (raw): The result is downloaded to a local comma-separated values (*.csv) file. This option includes the complete unformatted data.
- JSON: The result is downloaded to a local JSON (*.json) file.
Some visualizations offer no option to download the result.
Possible issue with importing CSV into Excel
When you export results to a CSV file—whether CSV or CSV (raw)—with line breaks in any result column/field, and then open the file with Microsoft Excel or try to convert the file into a table using Excel option Data > Text to Columns, you may encounter an issue in which the line breaks are incorrectly rendered in Excel. This is caused by an Excel limitation.
To avoid this issue, use Excel option Data > From Text/CSV.
Edit read-only notebook
When you open a document (dashboard or notebook) for which you don't have write permission, you can still edit the document during your session. After you're finished, you have two options:
- Save your changes to a new document
- Discard your changes
Example:
-
Go to
Notebooks, list the ready-made notebooks, and select the Getting started notebook.It says Ready-made in the upper-left corner, next to the document name.
-
Select the Line chart section and then select Options.
-
Change the visualization from Line to Area.
Now you are offered two buttons: Save as new and Discard changes.
-
Use the updated notebook as needed. You have full edit access for this session.
-
When you're finished, select what to do with your changes:
- Save as new—saves your changes in a new copy of the edited notebook.
- Discard changes—discards your changes and returns you to the unedited read-only notebook.
Manage multiple sections
You can select multiple sections and then apply the same command to all of them at once.
-
Shift+Click—selects one or more consecutive sections
-
Ctrl/Cmd+Click—selects one or more nonconsecutive sections
-
Ctrl/Cmd+A—selects all sections
The x sections menu in the upper-right corner of the notebook offers commands that apply to all sections:
- Select all selects all sections in the notebook.
- Run all runs all sections in the notebook.
When you select multiple sections, the available commands include:
- is where you click to drag the selected sections to a different position.
- Run x runs all selected sections.
- set segments for all selected sections.
- sets the timeframe for all selected sections.
- and hide and show the input for all selected sections.
- opens a menu of further options:
- Duplicate sections creates a copy of the selected sections.
- Clear results clears the results of the selected sections. Select Run again to get new results.
- Delete sections removes the selected sections from the notebook.
- Add to dashboard opens the selected sections in a dashboard.
- Open with opens the selected sections in another document. For details, see Drilldowns and navigation.
Run a section
Run code
To run a code section
- Select the section.
- Select Run.
After you run a code section, you can clear the code results
- Select the section.
- Select > Clear result.
Show/hide code
To display the code in a code section
-
Select the section.
-
Select Show code.
The code is displayed in a panel above the section.
To hide the code panel again, select Hide code.
Run query
To run a query section
- Select the section.
- Select Run.
After you run a query section, you can clear the query results
- Select the section.
- Select > Clear result.
Show/hide query
To display the query in a query section
-
Select the section.
-
Select Show query.
The query is displayed in a panel above the section.
To hide the query panel again, select Hide query.
Share with others
Share a notebook
If you own a dashboard or notebook, you can share it.
There are three ways to share a document with other Dynatrace users in your company:
- Access for all (view-only): Give view-only access to everyone in your Dynatrace environment.
- Share access: Create and maintain a list of users and user groups with access the document.
- Share links: Create links (URLs) pointing to your document and distribute the links through the channels of your choice (email, for example).
These methods are not mutually exclusive. For example, you can maintain a focused list of users for ongoing access to the document (maybe everyone in a certain group edits the document regularly) and you can create and distribute view-only links for a wider audience as needed.
In any case, you control whether people can edit the document or only view it.
For details on sharing documents, see Share documents.
You can also export a notebook as a JSON file and send the JSON to others, and then they can import the JSON.
Export a notebook
To export a notebook
- At the top of the notebook, open the menu next to the notebook name.
- Select Download from the menu.
Alternatively, you can also trigger the same action in the Last opened by you section of the sidebar. Select > Export as JSON.
Import a notebook
To import a notebook from a JSON file
-
Select All notebooks in the document sidebar.
-
In the upper-left corner of the page, select Upload. A file browser window opens.
-
Find and open the notebook JSON definition file.
The definition is imported as a new notebook and listed on the Notebooks page with Last modified set to the import date and time.
Change notebook owner
When you create a document (dashboard or notebook), you are the owner. To give ownership of the document to another Dynatrace user
-
Open the document menu and select Change owner.
-
Find and select a new owner, and then select Change owner.
When you change the document owner, you immediately lose access to the document.
- Be sure you are ready to transfer ownership before you select this command.
- You can regain access to the document only if the new owner gives you permission.
-
After the transfer is complete, the new owner will receive email about the document ownership transfer.
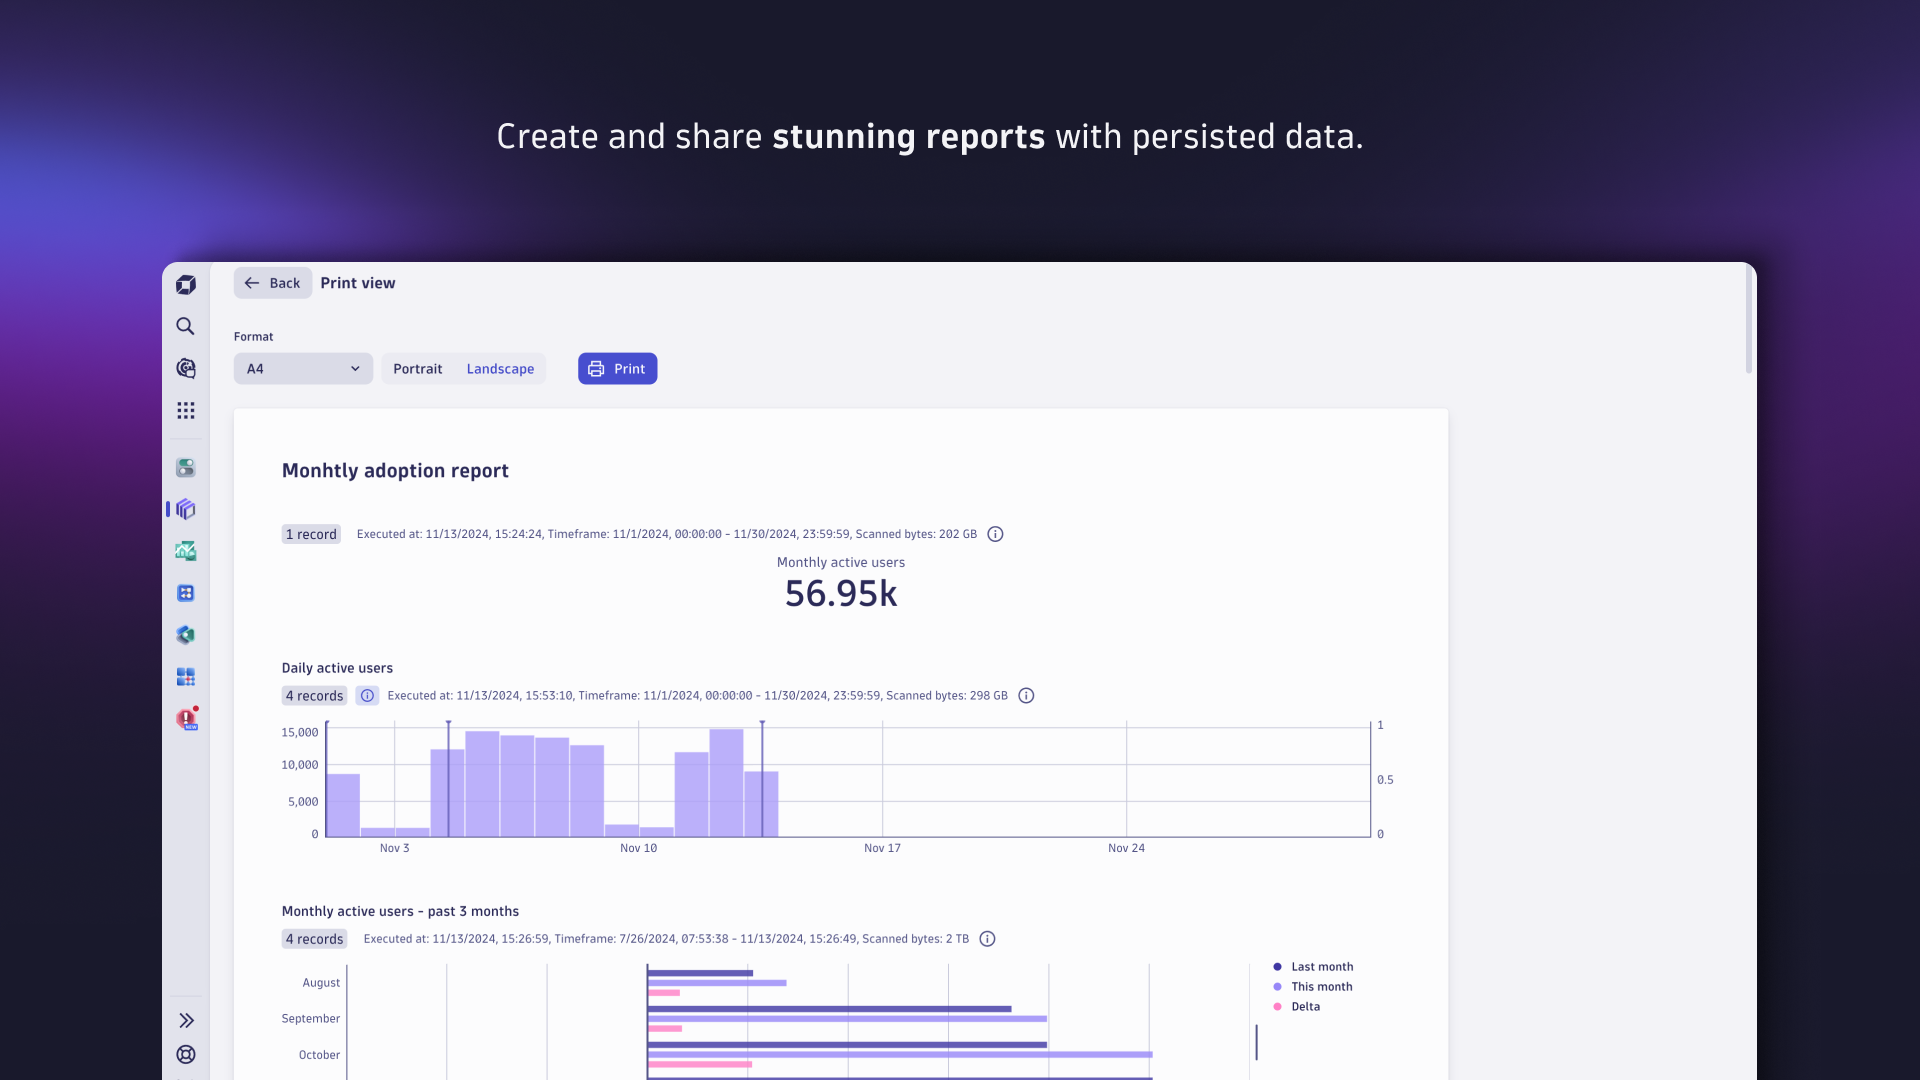
Print or export to PDF
To print a notebook or export it to PDF
-
Open your notebook.
-
Optional Prepare your notebook sections for printing.
For example:
- Select Run to get the latest result before printing
- Select Hide input to hide a section query and display only the result
- Set visualization options, such as hiding sensitive or irrelevant table columns that you don't want to print and distribute
-
From the notebook menu, select Print view.
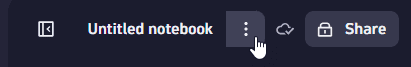 Open notebook menu from current notebook
A printable view of the notebook is displayed on a Print preview page with print settings displayed at the top.
-
Select the page size (
A4orUS Letter) and orientation (PortraitorLandscape), and then select Print.The notebook is displayed in a print options window. Each notebook section prints to a new page.
-
Make additional print settings as needed, and then select Save or Print (depending on the print destination) to finish.
Known print limitations
- When printing in
Landscapemode, a table may overlap the next section. - When Dynatrace is in dark mode, printing a notebook uses dark mode color schemes. To avoid this, you can temporarily switch Dynatrace to light mode: from the Dynatrace user menu (in the lower-left corner of Dynatrace), select Appearance > Light.
Analyze data
Analyze data with AI
To analyze data using Dynatrace Intelligence Data Analyzers
-
Explore a timeseries.
Example
In your document (dashboard or notebook)
-
Select to add a new section or tile, and then select Metrics to explore metrics.
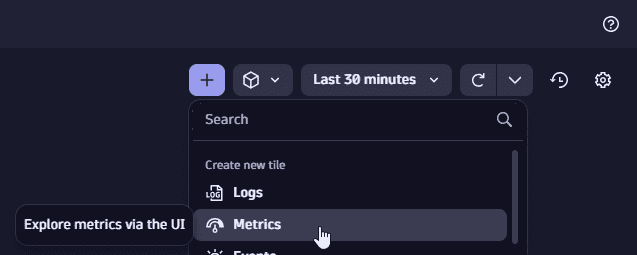 Example: select Add > Metrics
 -
In Select metric, select Infrastructure > CPU > CPU usage %.
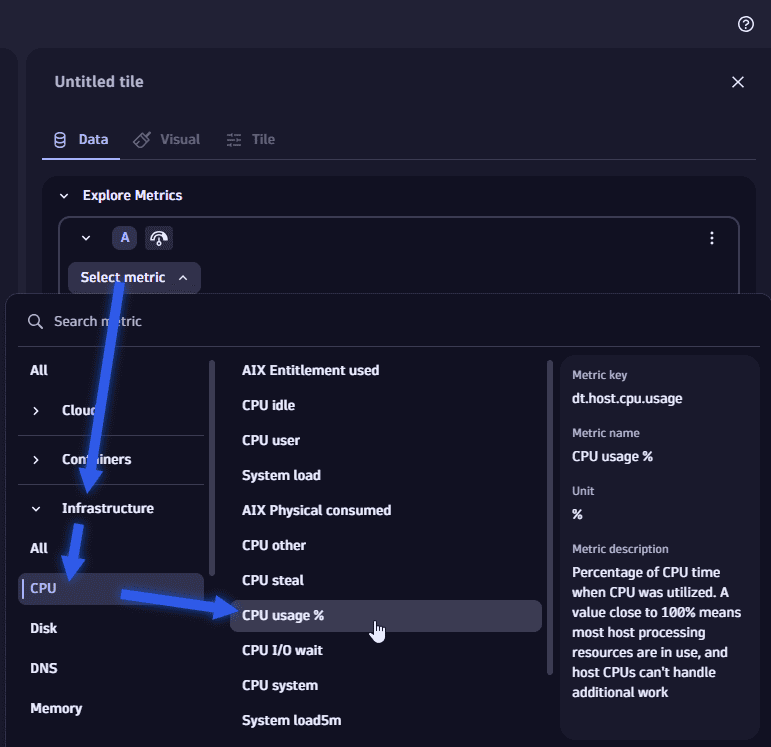 Example: select metric "CPU usage %"
 -
Set Split by to
host.name.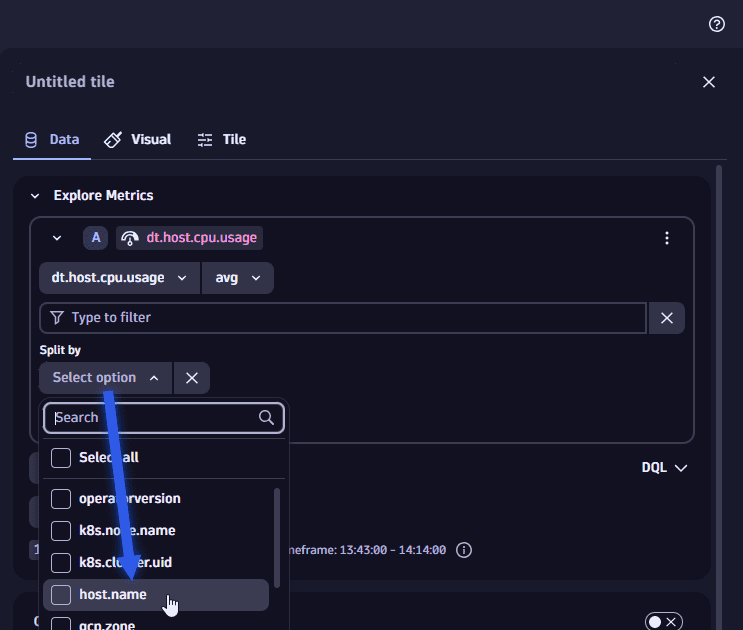 Example: set "Split by" to host.name
 -
Set Limit to the maximum number of series to analyze. Dynatrace Intelligence Data Analyzer currently supports analysis up to 1000 series.
You should get something like this:
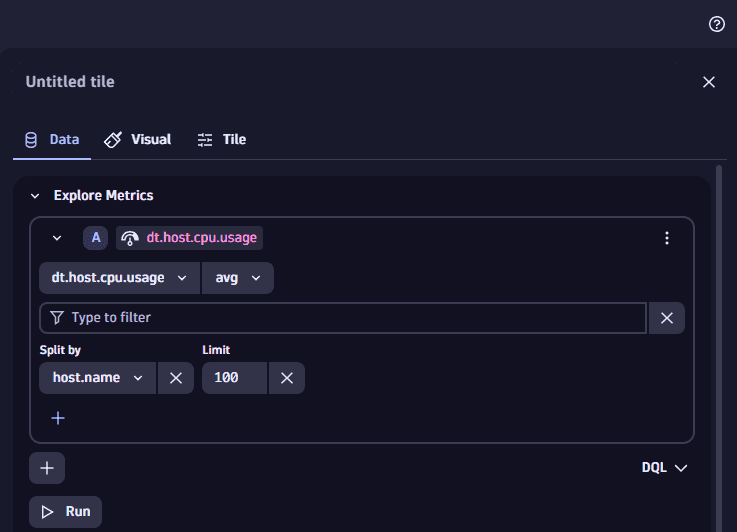 Example: complete query
 -
-
Run the query.
-
In the options panel on the right, scroll down and expand Davis AI.
Show me
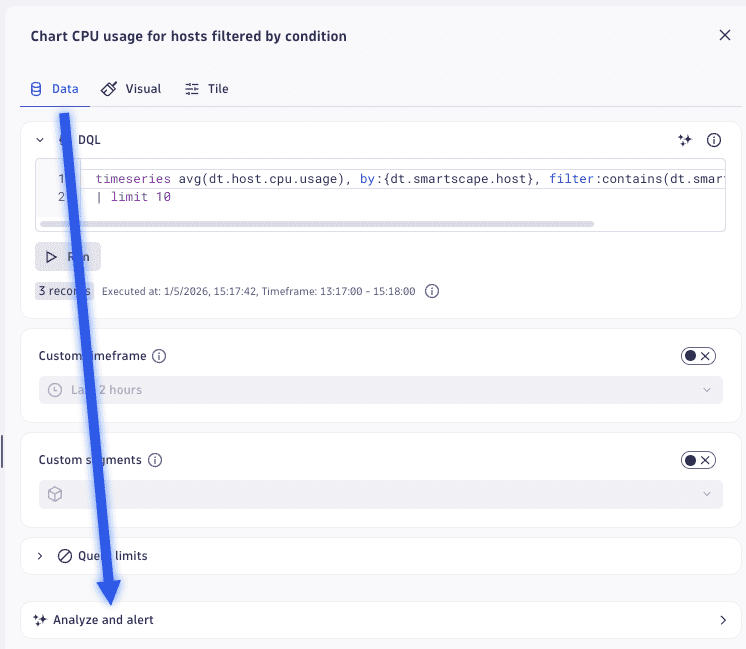 An example of selecting the Analyze and alert settings in the Dashboards app.
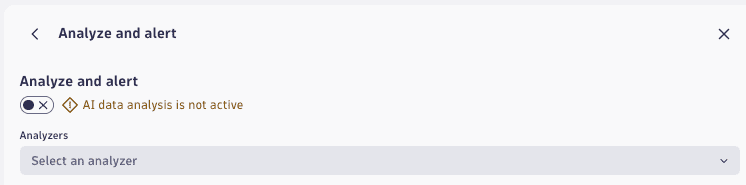 The initial panel for the Analyze and alert settings in the Dashboards app.
 -
On the Davis AI panel, set Analyzers to the analyzer you want to use, and then configure the analyzer.
- For an overview of anomaly detection, see Anomaly detection
- For details on anomaly detection settings, see Anomaly detection configuration
- For details on forecast analyzer settings, Dynatrace Intelligence predictive AI analysis
Anomaly Detection: Auto adaptive threshold anomaly detection
- Number of signal fluctuations—how many times the signal fluctuation is added to the baseline to produce the actual threshold for alerting.
- Alert condition—your selection depends on whether you want to know when the metric is above, below, or outside (above or below) the normal range.
For details, see Anomaly detection configuration.
Anomaly Detection: Seasonal baseline anomaly detection
- Tolerance—the higher the tolerance, the broader the confidence band, leading to fewer triggered events.
- Alert condition—your selection depends on whether you want to know when the metric is above, below, or outside (above or below) the normal range.
For details, see Anomaly detection configuration.
Anomaly Detection: Static threshold anomaly detection
- Threshold—a hard limit that a metric should not violate.
- Unit—the unit of the value.
- Alert condition—your selection depends on whether you want to know when the metric is above or below the threshold value.
- Suggest threshold—Davis AI can help you to find the right threshold based on historical data.
For details, see Anomaly detection configuration.
Prediction: Forecast
- Data points to predict—the total steps the time series is forecasted. More steps generally results in less reliable forecasts and longer analyzer runtimes.
- Forecast offset—an offset for the start of the forecast. For example, if the offset is set to
2, the last two data points are ignored and a forecast for these points is returned as well.
For details, see Dynatrace Intelligence predictive AI analysis.
Advanced settings (for anomaly detection)
You can use the default values or turn on Show advanced properties to fine-tune these settings.
- Alert on missing data—alert if no data is detected within the sliding window.
- Violating samples—number of samples in the sliding window that must violate to trigger an event.
- Sliding window—number of samples that form the sliding window.
- Dealerting samples—number of samples in the sliding window that must go back to normal to close the event.
-
By default, the analyzer is not enabled. To enable it, turn on the switch at the top of the edit panel (switch from AI data analysis is not active to AI data analysis is active).
-
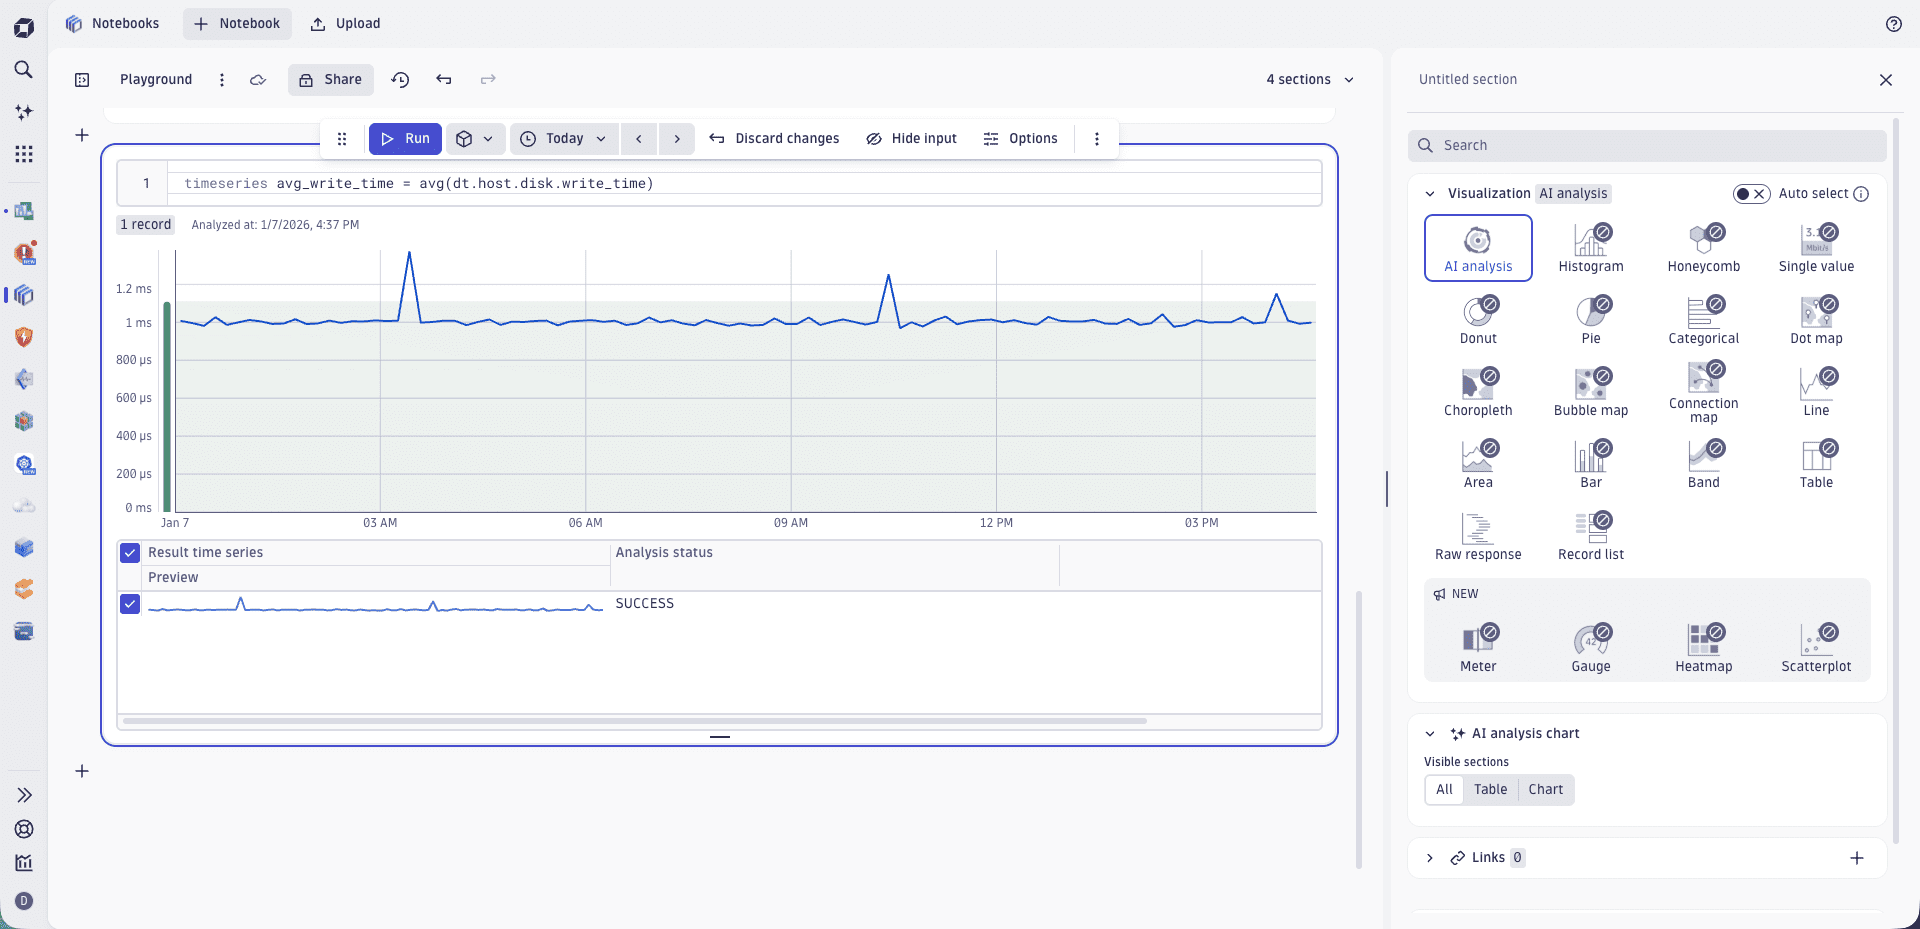
To view the results, select the Davis AI analysis visualization and expand the Davis AI analysis chart section to review or change the visualization-specific settings:
Show me
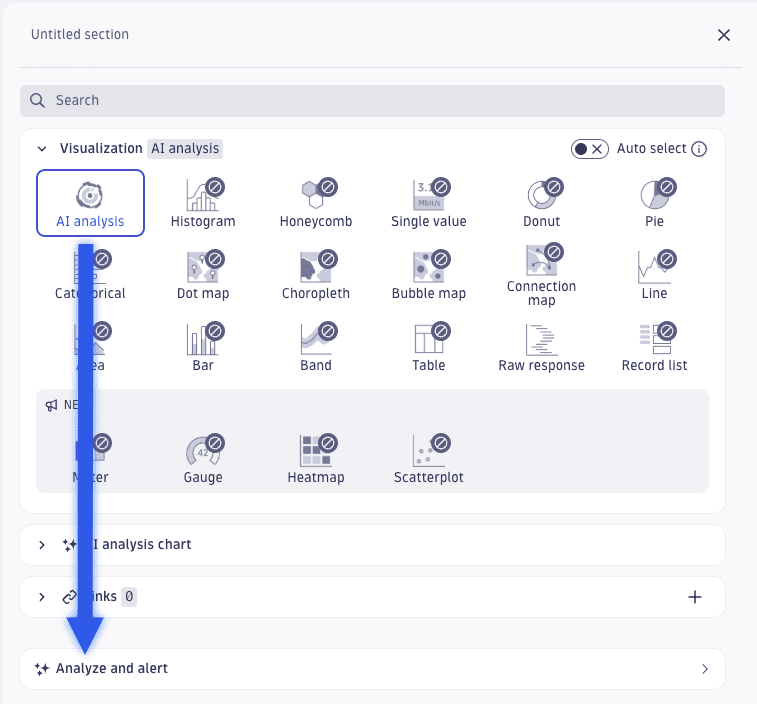 Example of selecting "AI analysis" visualization and displaying visualization-specific settings in the Notebooks app.
The Davis AI analysis visualization has two sections: chart and visualization. You can use the Visible sections setting to display either or both of them.
- All—show a chart and a table. The chart reflects your table selections.
- Table—show only a table. You can sort columns that display a sort icon in the header. Select the column header to toggle the sort order up or down .
- Chart—show only a chart. Use the table to select entries you want to show on the chart.
Example: anomalous CPU usage percent
To detect when CPU usage percent exceeds 70 percent, in your document (dashboard or notebook)
-
Select to add a new section or tile, and then select Metrics to explore metrics.
Show me
Example: select Add > Metrics -
In Select metric, select Infrastructure > CPU > CPU usage %.
Show me
Example: select metric "CPU usage %" -
Set Split by to
host.name.Show me
Example: set "Split by" to host.name -
Set Limit to the maximum number of series to analyze. Davis analyzer currently supports analysis up to 1000 series.
Show me
Example: complete query -
Select Run.
-
In the edit panel, expand Davis AI.
Show me
An example of selecting the Analyze and alert settings in the Dashboards app.The initial panel for the Analyze and alert settings in the Dashboards app. -
In the Analyzers list, select Static threshold anomaly detection.
Show me
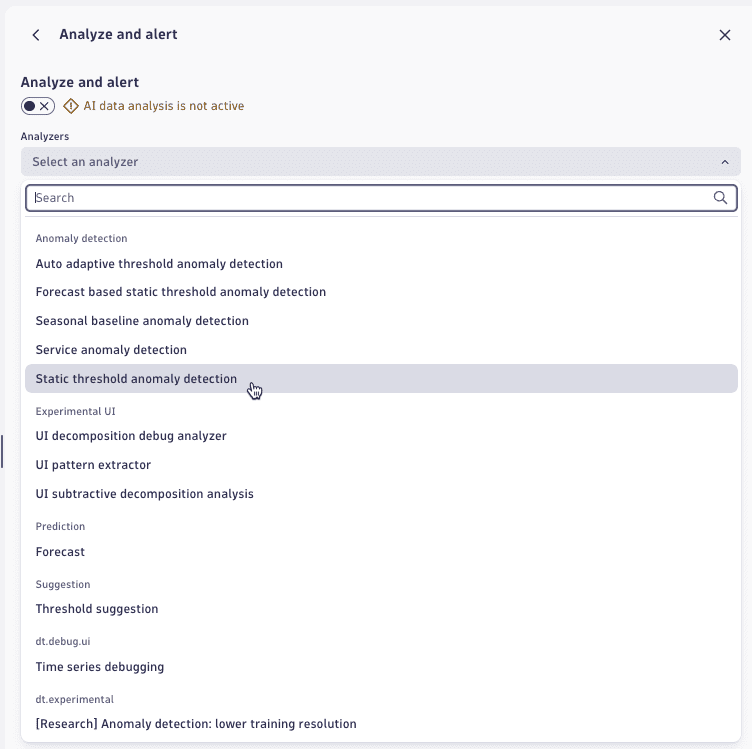 Selecting the "Static threshold anomaly detection" analyzer in the Analyze and alert settings of the Dashboards app.
 -
Set Threshold to
70(enter a value) and Alert condition to Alert if metric is above (default).Show me
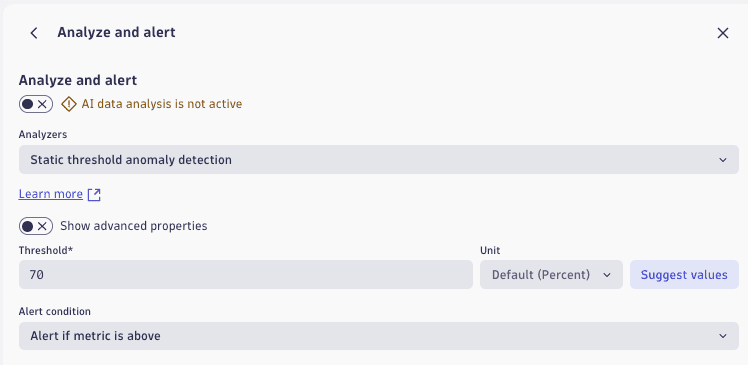 Configuring settings for the "Static threshold anomaly detection" analyzer in the Dashboards app.
 -
Activate the analyzer: at the top of the edit panel, switch from AI data analysis is not active to AI data analysis is active.
-
To view the results, select the Davis AI analysis visualization. Expand the Davis AI analysis chart section to see visualization-specifc settings.
Show me
Example of selecting "AI analysis" visualization and displaying visualization-specific settings in the Notebooks app. -
In the Davis AI analysis chart section, set Visible sections to All.
-
Review the results.
In this example, we selected the hosts that exceeded the threshold.
- The chart shows a line for the selected metric (
CPU usage %) for each selected host. - A red bar across the top of the visualization indicates where the threshold for that metric was exceeded.
- The table under the chart has those hosts selected.
 Example analyzer results with "AI analysis" visualization in the Notebooks app.
 - The chart shows a line for the selected metric (
Start forecast analysis
From your notebook, you can trigger a series forecast analysis powered by Dynatrace Intelligence.
In this example, we issue the following query:
timeseries avg(dt.host.cpu.usage), by:{ dt.entity.host }
and then run a forecast for a time series selected in the results.
-
In a notebook, select > DQL.
-
Enter a query such as
timeseries avg(dt.host.cpu.usage), by:{ dt.entity.host }to chart time series. -
Select Run query.
-
Hover over the required time series in the sidebar and select > Filter and forecast.
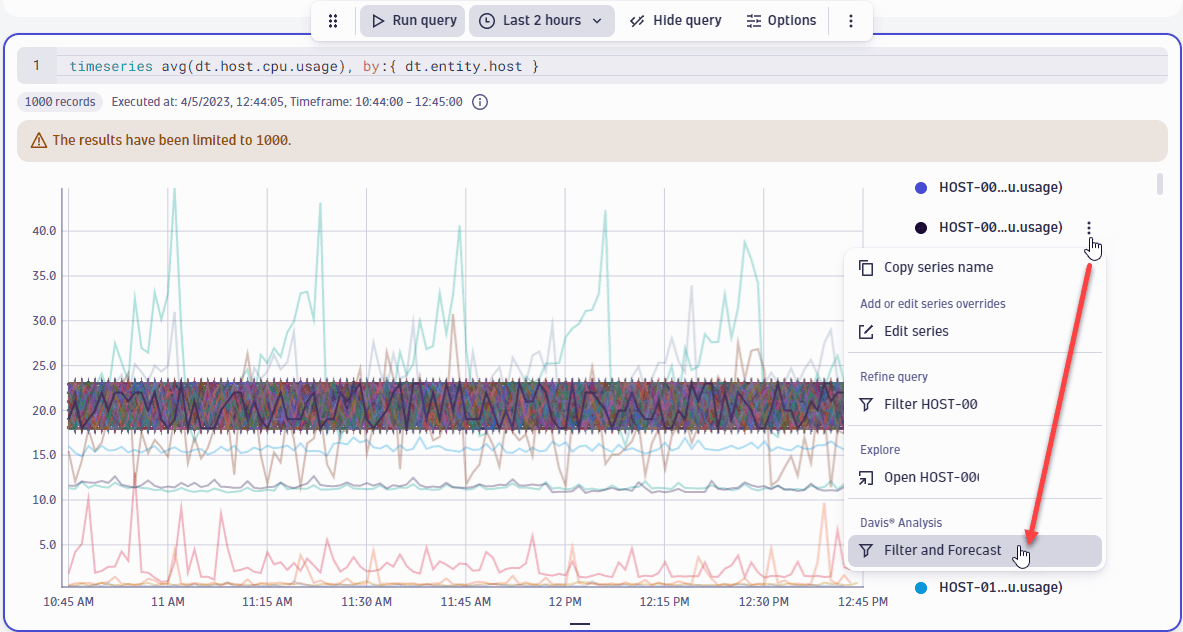 Filter and forecast: select
 -
The query is automatically updated to filter by the selected time series and the chart is extended to show the projection for the selected series.
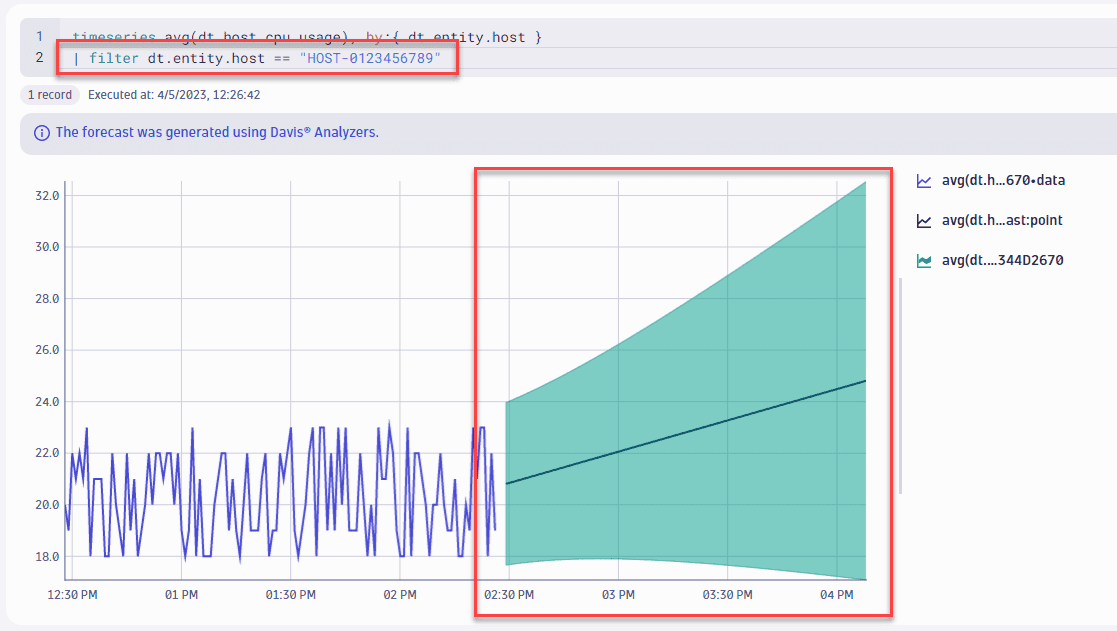 Filter and forecast: results
For details, see Dynatrace Intelligence predictive AI analysis.
 Notebooks