Explore data distribution
- Latest Dynatrace
- Tutorial
- 1-min read
- Published Dec 05, 2023
In this example, we explore the data distribution via cardinality of values of CPU saturation. We're going to visualize it in Notebooks.
1. Investigate cardinality for specific data records
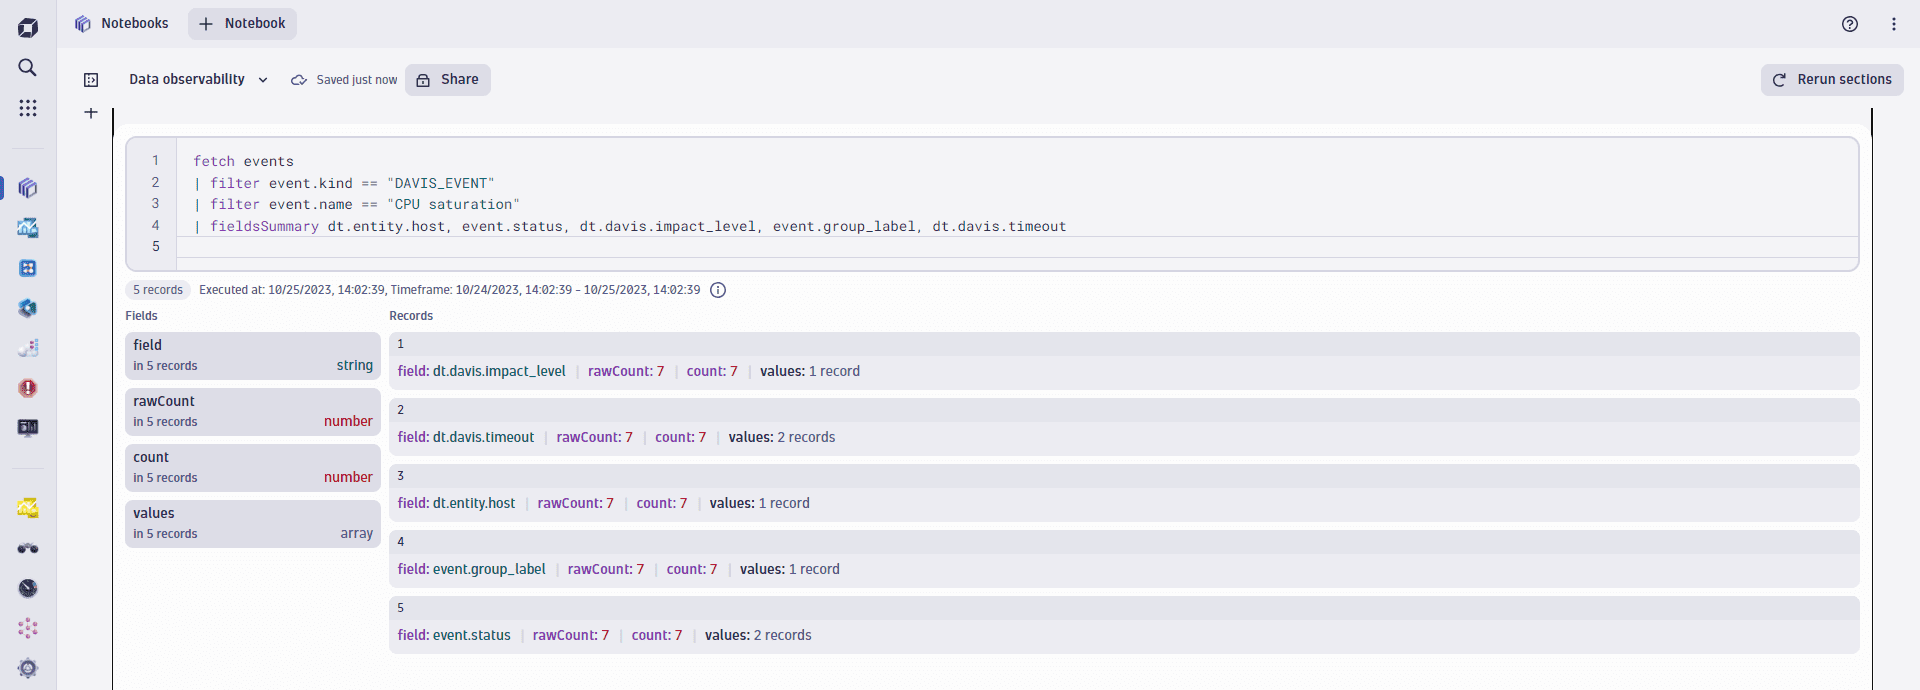
The following DQL query returns a summary statistic about the distribution of the CPU saturation fields.
fetch events| filter event.kind == "DAVIS_EVENT"| filter event.name == "CPU saturation"| fieldsSummary dt.entity.host, event.status, dt.davis.impact_level, event.group_label, dt.davis.timeout
The image below shows that within the query timeframe (seven days), there is just one value in the dt.davis.impact_level, while there are three distinct values for the dt.entity.host field.

2. Derive percentage distribution
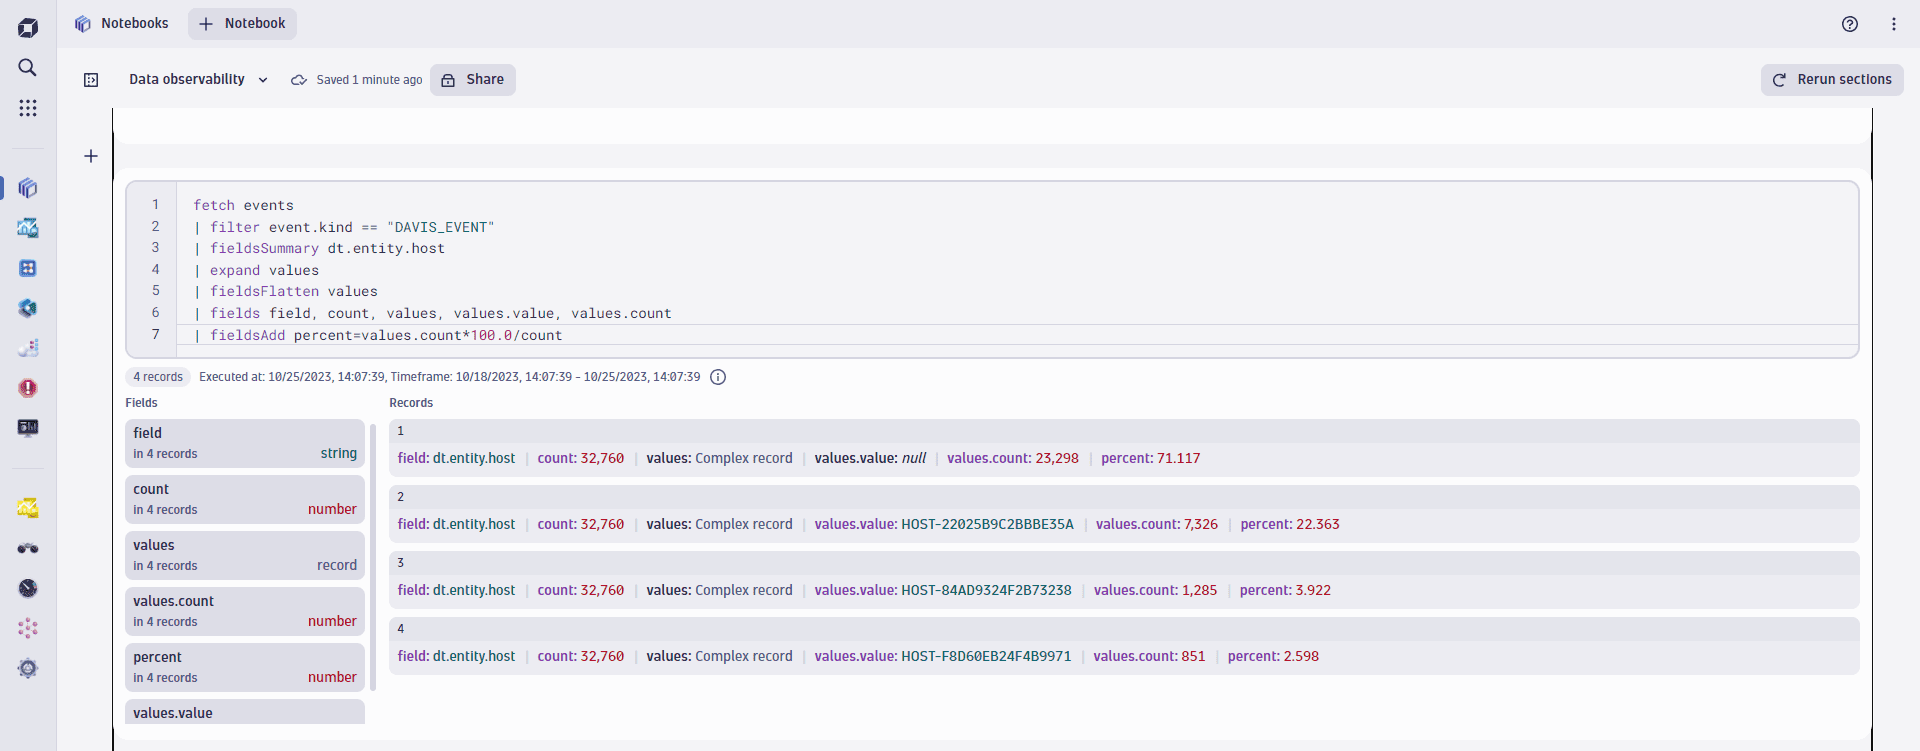
Now that we know the number of distinct values per data record field, we want Grail to deliver a percentage distribution of all the field values for the dt.entity.host. To achieve that, run the following query:
fetch events| filter event.kind == "DAVIS_EVENT"| fieldsSummary dt.entity.host| expand values| fieldsFlatten values| fields field, count, values, values.value, values.count| fieldsAdd percent=values.count*100.0/count
This DQL query then results in the following percentage distribution statistic, showing that 75% of all CPU saturation event records were coming from a single host:
