Alert on unexpected schema changes
- Latest Dynatrace
- Tutorial
- 3-min read
A stable data schema is essential for the stable work of the downstream components relying on it. Unexpected schema changes can cause false alert or outages. One of the ways to detect schema changes is to continuously observe the total number of distinct field keys within a set of data records and use this count within a workflow to actively alert on unexpected schema changes.
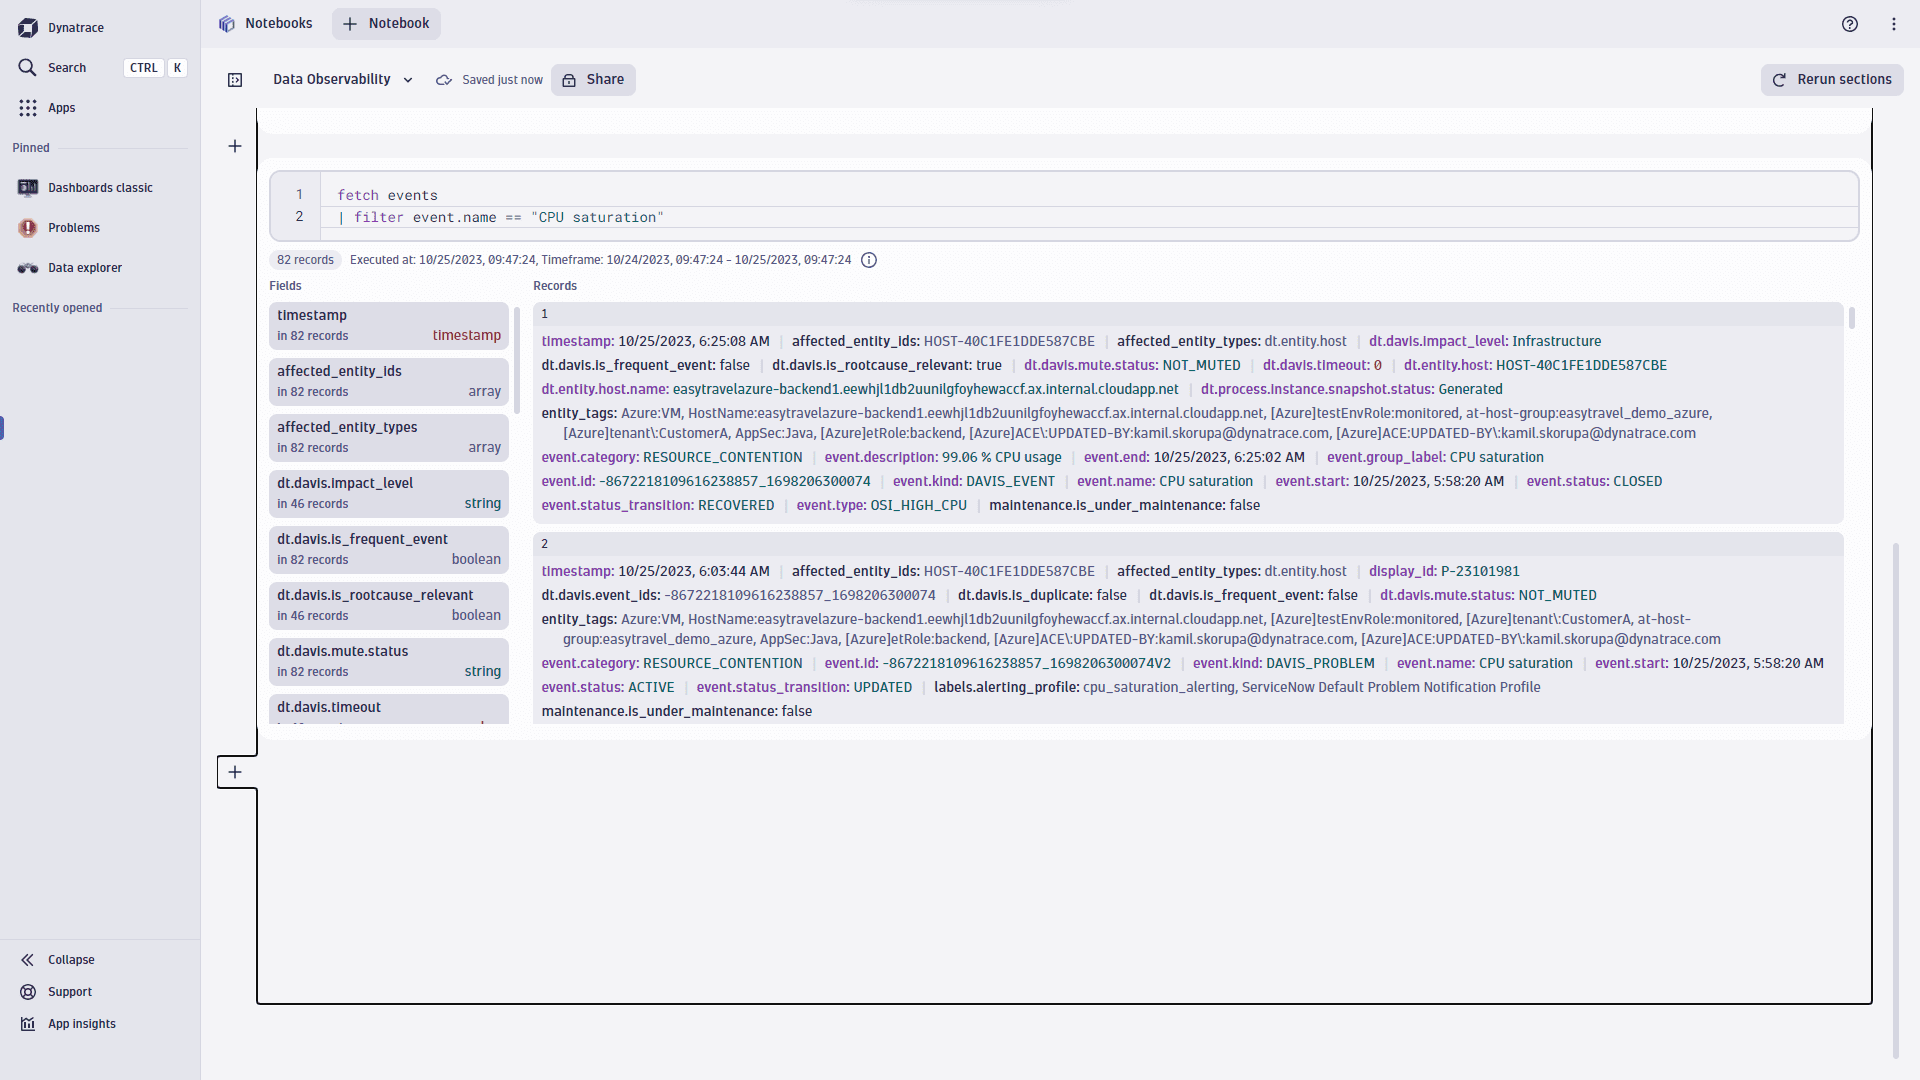
In this example, we focus on a classic Dynatrace event that alerts on CPU saturation.

1. Create a workflow
To observe the schema, we use a workflow that counts distinct field keys in each incoming event.
- Go to Workflows
 and select
 to create a new workflow.
- Select the Cron schedule trigger.
- Use the following Cron expression to run the workflow every hour:
0 * * * *
2. Query the data
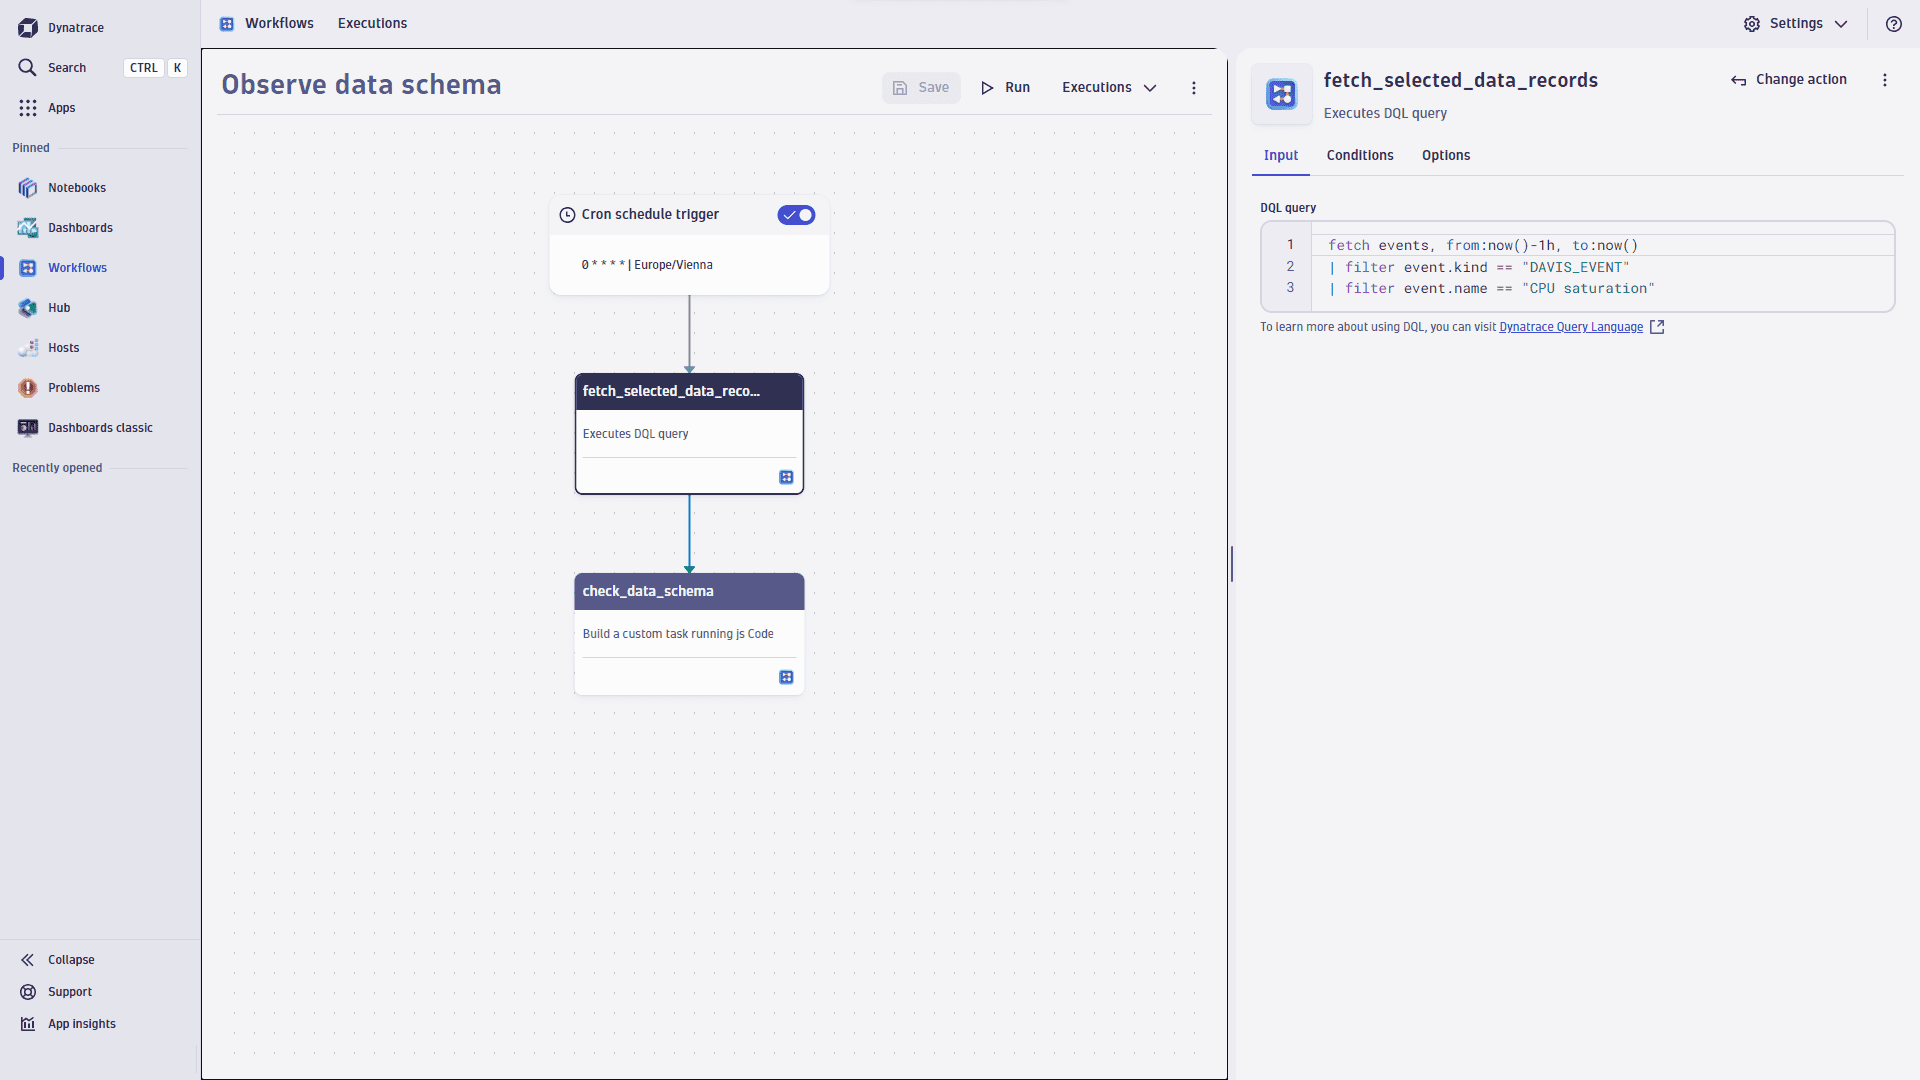
We use the DQL query to extract CPU saturation events from the events feed. We'll later use these events to count the data fields in each event. The expected value is either 21 or 22 data fields (the close event has an additional event.end field).
fetch events| filter event.kind == "DAVIS_EVENT"| filter event.name == "CPU saturation"
Now, we need to add this query to the workflow:
- On the trigger node, select
to browse available actions.
- In the side panel, search the actions for DQL and select Execute DQL Query.
- Paste the above query into the input field.

3. Write the metric
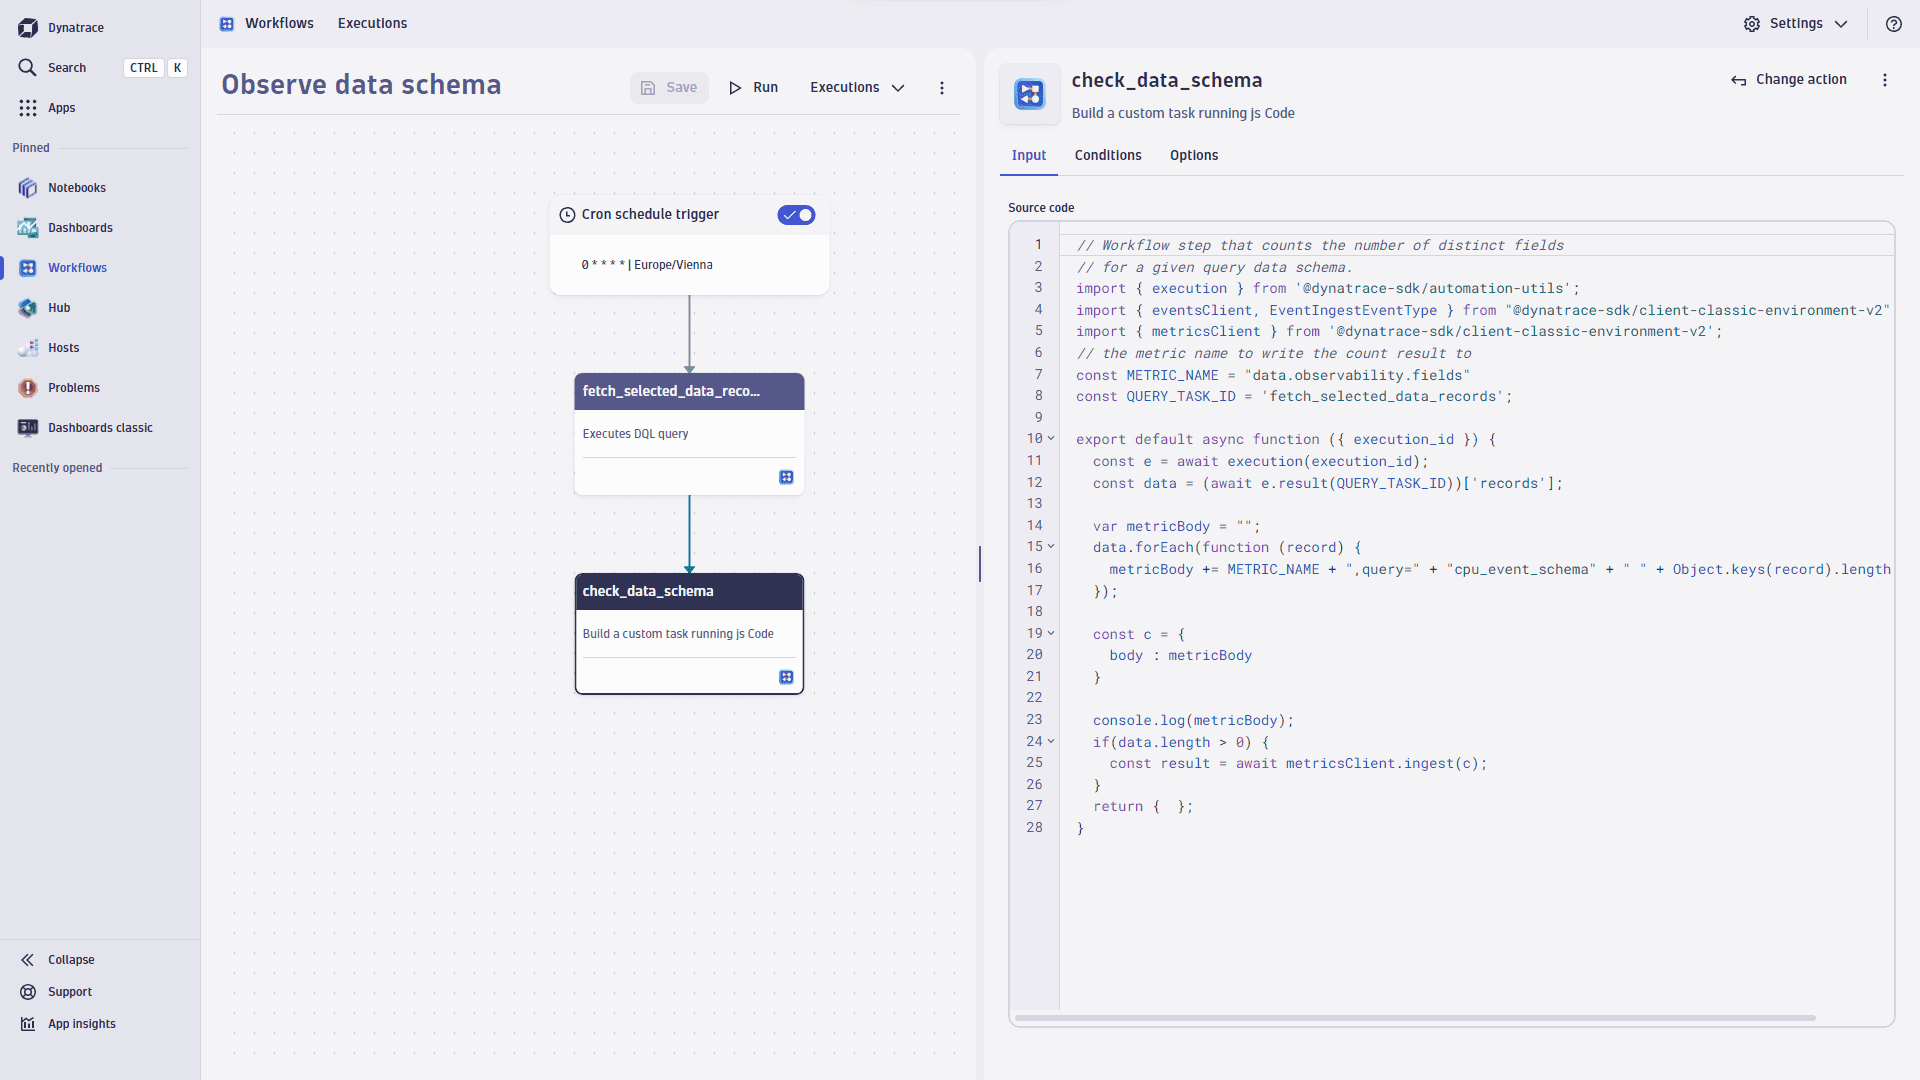
Now, let's count the fields in the extracted events and write them into a custom metric. To achieve that, we use a custom script that creates a metric that counts the number of distinct record fields for each of your fetched Grail records. The name of the metric is data.observability.fields.
- On the DQL node, select
to browse available actions.
- In the side panel, search the actions for javascript and select Run JavaScript.
- Paste the following code into the input field.
Show TypeScript code
import { execution } from '@dynatrace-sdk/automation-utils';import { eventsClient, EventIngestEventType } from "@dynatrace-sdk/client-classic-environment-v2";import { metricsClient } from '@dynatrace-sdk/client-classic-environment-v2';// the metric name to write the count result toconst METRIC_NAME = "data.observability.fields"const QUERY_TASK_ID = 'fetch_selected_data_records';export default async function ({ executionId }) {const e = await execution(executionId);const data = (await e.result(QUERY_TASK_ID))['records'];var metricBody = "";data.forEach(function (record) {metricBody += METRIC_NAME + ",query=" + "cpu_event_schema" + " " + Object.keys(record).length + "\n";});const c = {body : metricBody}console.log(metricBody);if(data.length > 0) {const result = await metricsClient.ingest(c);}return { };}

4. Use the metric
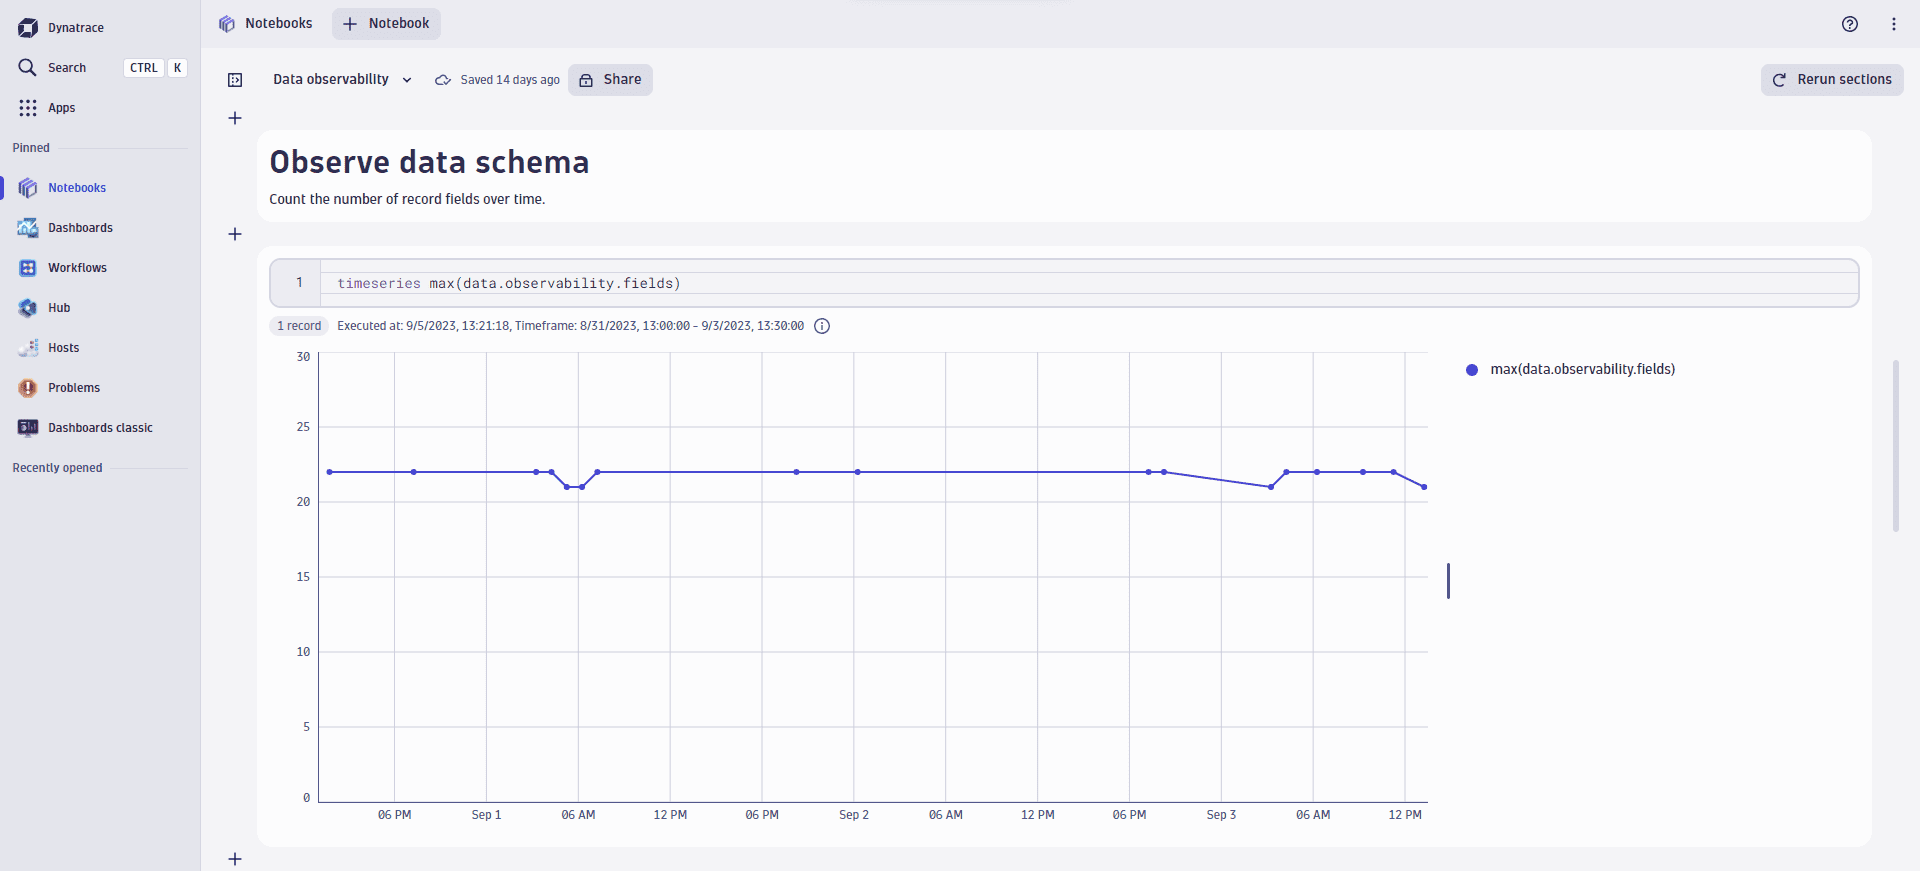
Once the new metric collects some data, you can start using it just like any other metric in Dynatrace. For example, you can create a metric event or visualize it in Notebooks.
