Detect data volume drops
- Latest Dynatrace
- Tutorial
- 5-min read
A drop in data volume might mean you don't receive all the necessary information about your system, compromising the quality of the decisions made on this data. Observing the stable data volume helps you ensure you have the best data set. Detection of volume drops varies depending on the frequency of the incoming data.
High ingestion frequencies
For real-time streamed data records, the Dynatrace out-of-the-box anomaly detection automatically learns a baseline for the ingested data counts and alerts proactively in case of baseline violations or missing data.
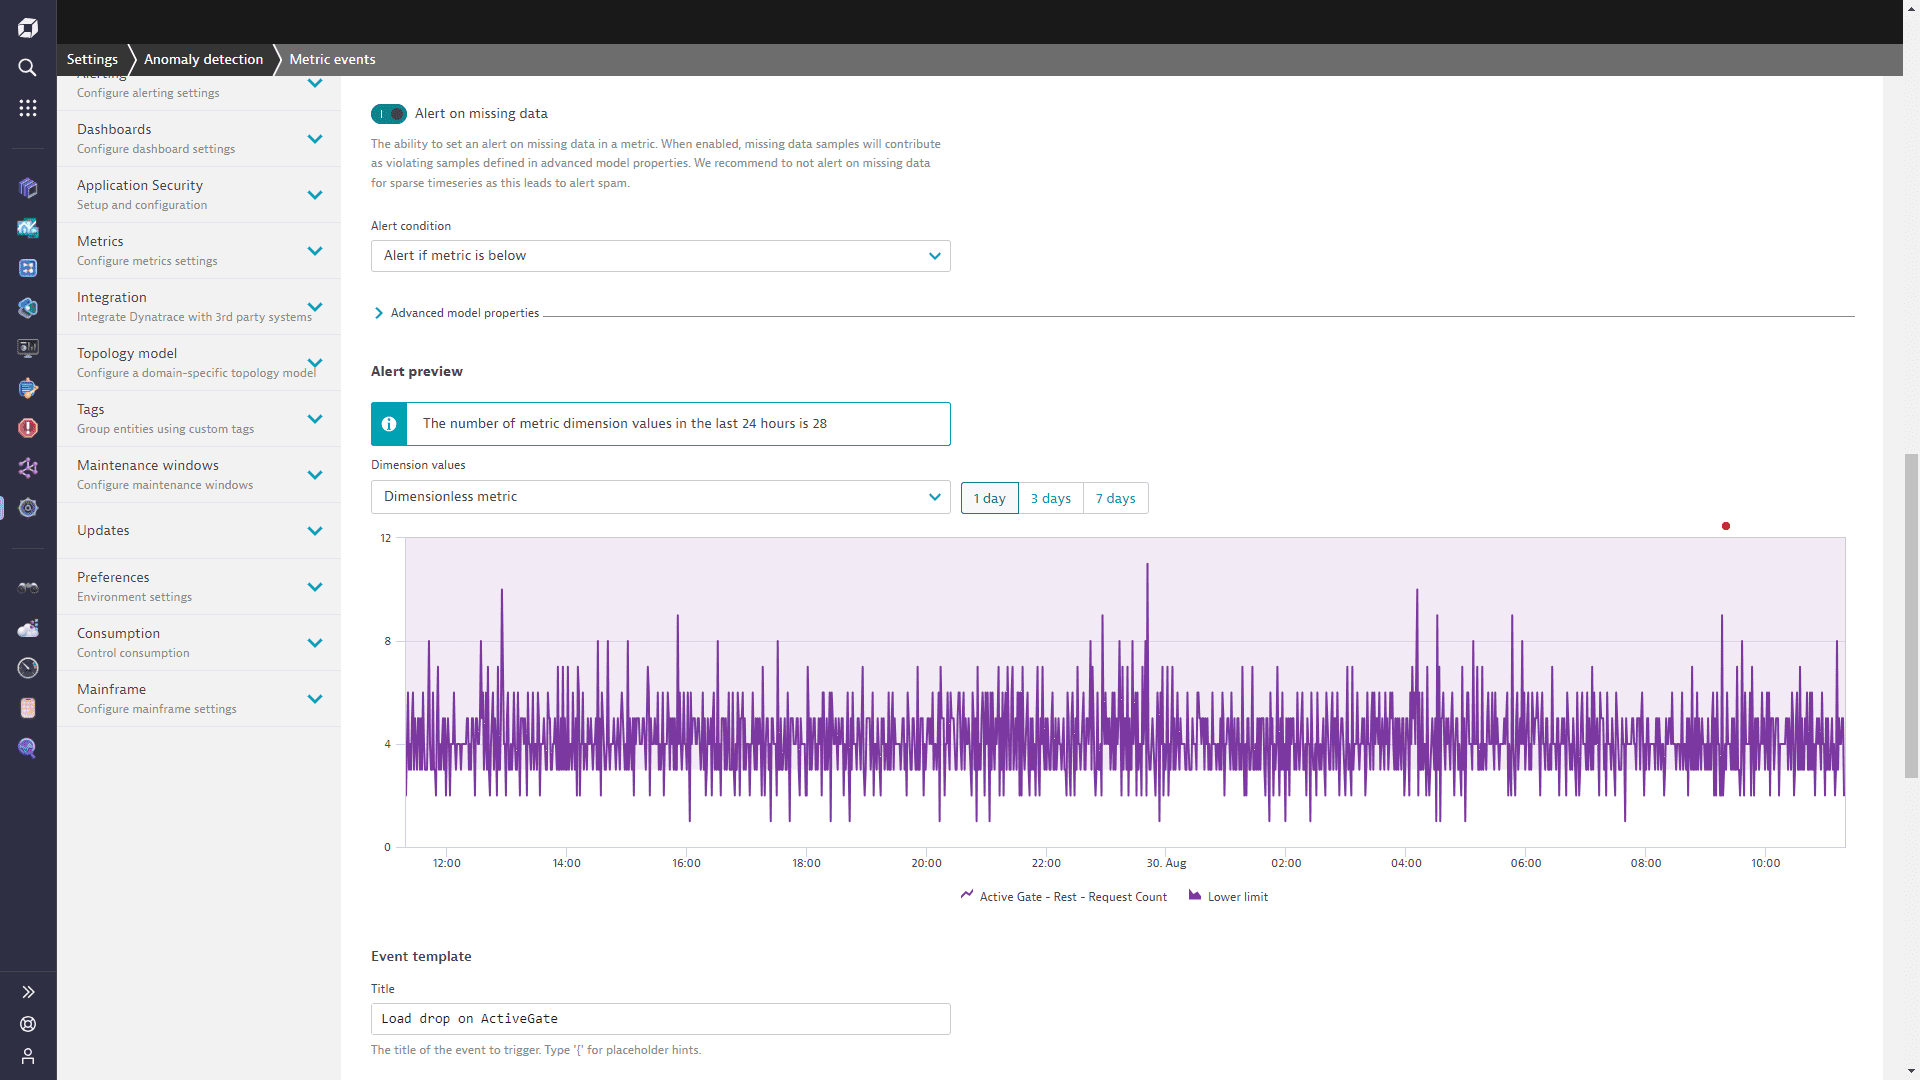
The image below shows a typical custom alert configuration that uses a baseline to alert when the volume of ingested data on ActiveGates drops.
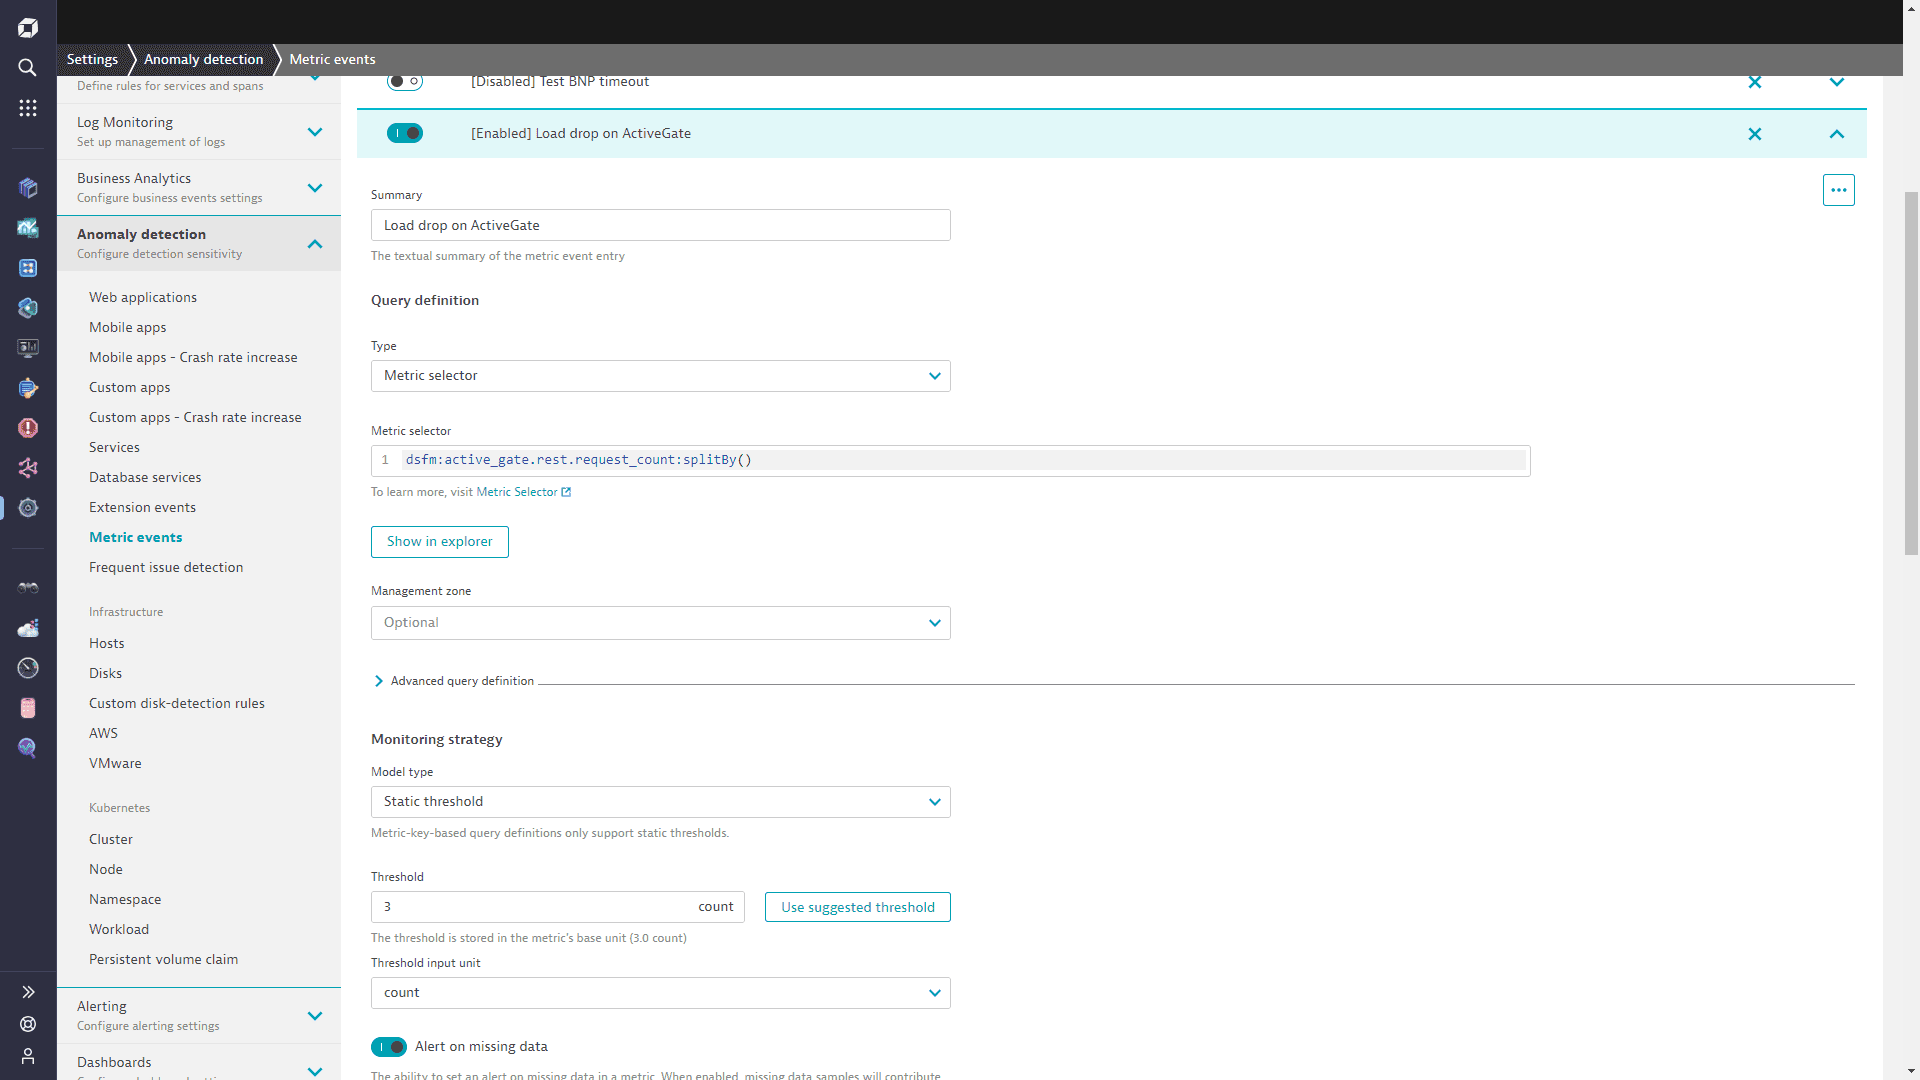
Every anomaly detection configuration includes an alerting preview, enabling you to adapt the configuration sensitivity to avoid over-alerting.
Low ingestion frequencies
Many data pipelines aggregate data records into batches, sending them in scheduled intervals. Depending on the data source, these intervals could range from hourly to daily transmissions. This varying submission frequency requires a workflow to monitor and alert on abnormal data drops. Coupled with the Davis forecast, the workflow is capable of proactive alerting on a noticeable decline or surge in the ingested data records.
Let's consider an example of a data pipeline that regularly receives data records in hourly batches. In such a scenario, generating forecasts for hourly totals to predict the expected number of records in the next hour becomes essential.
1. Set up a workflow
To observe the incoming data and create a forecast, we use a workflow
- Go to Workflows
 and select
 to create a new workflow.
- Select the Cron schedule trigger.
- Use the following Cron expression to run the workflow every hour:
0 * * * *
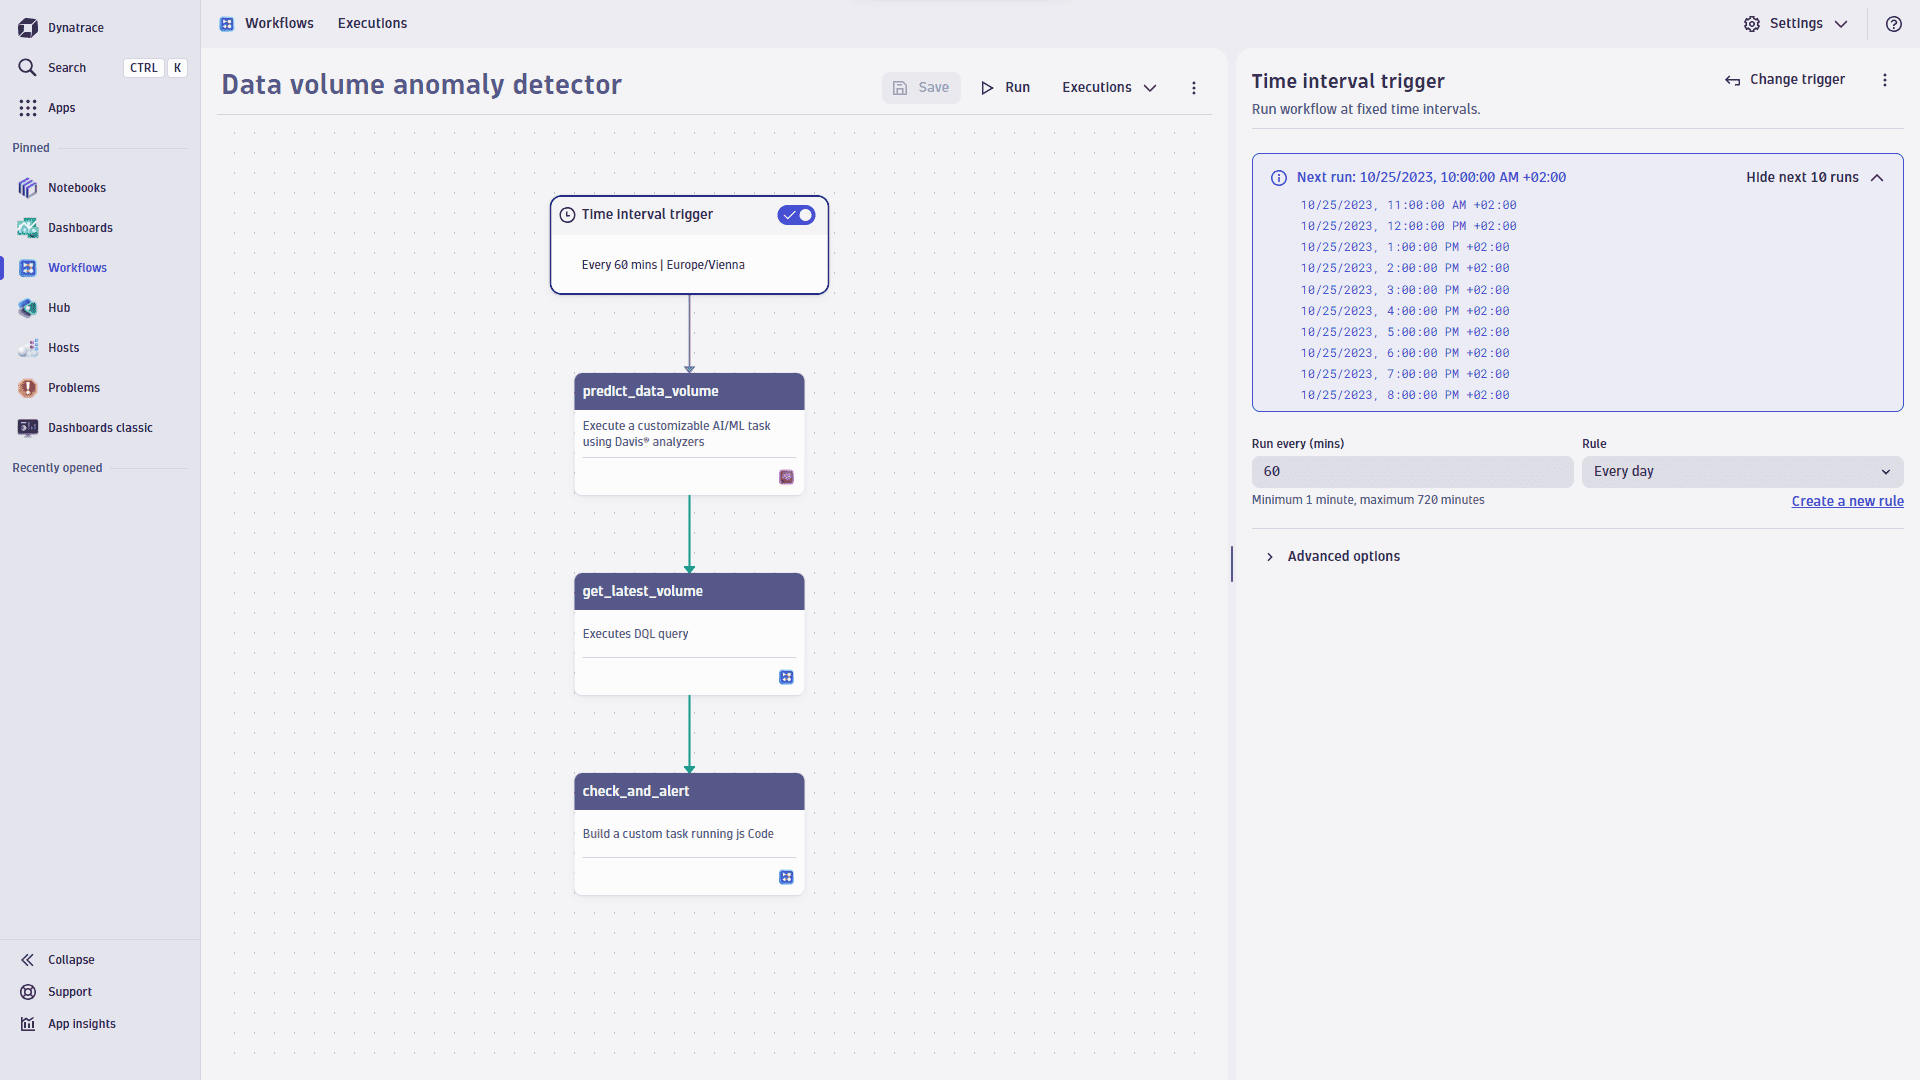
2. Analyze with Davis
In this step, we extract the count of data records via a DQL query and use a forecast to predict the expected data volume for the next hour.
fetch events| filter event.name == "YOUR EVENTS"| makeTimeseries count(), interval:1m| fieldsRename value = `count()`
- On the trigger node, select
to browse available actions.
- In the side panel, search the actions for Davis and select Analyze with Davis.
- From the Analyzers list, select Genering Forecast Analysis.
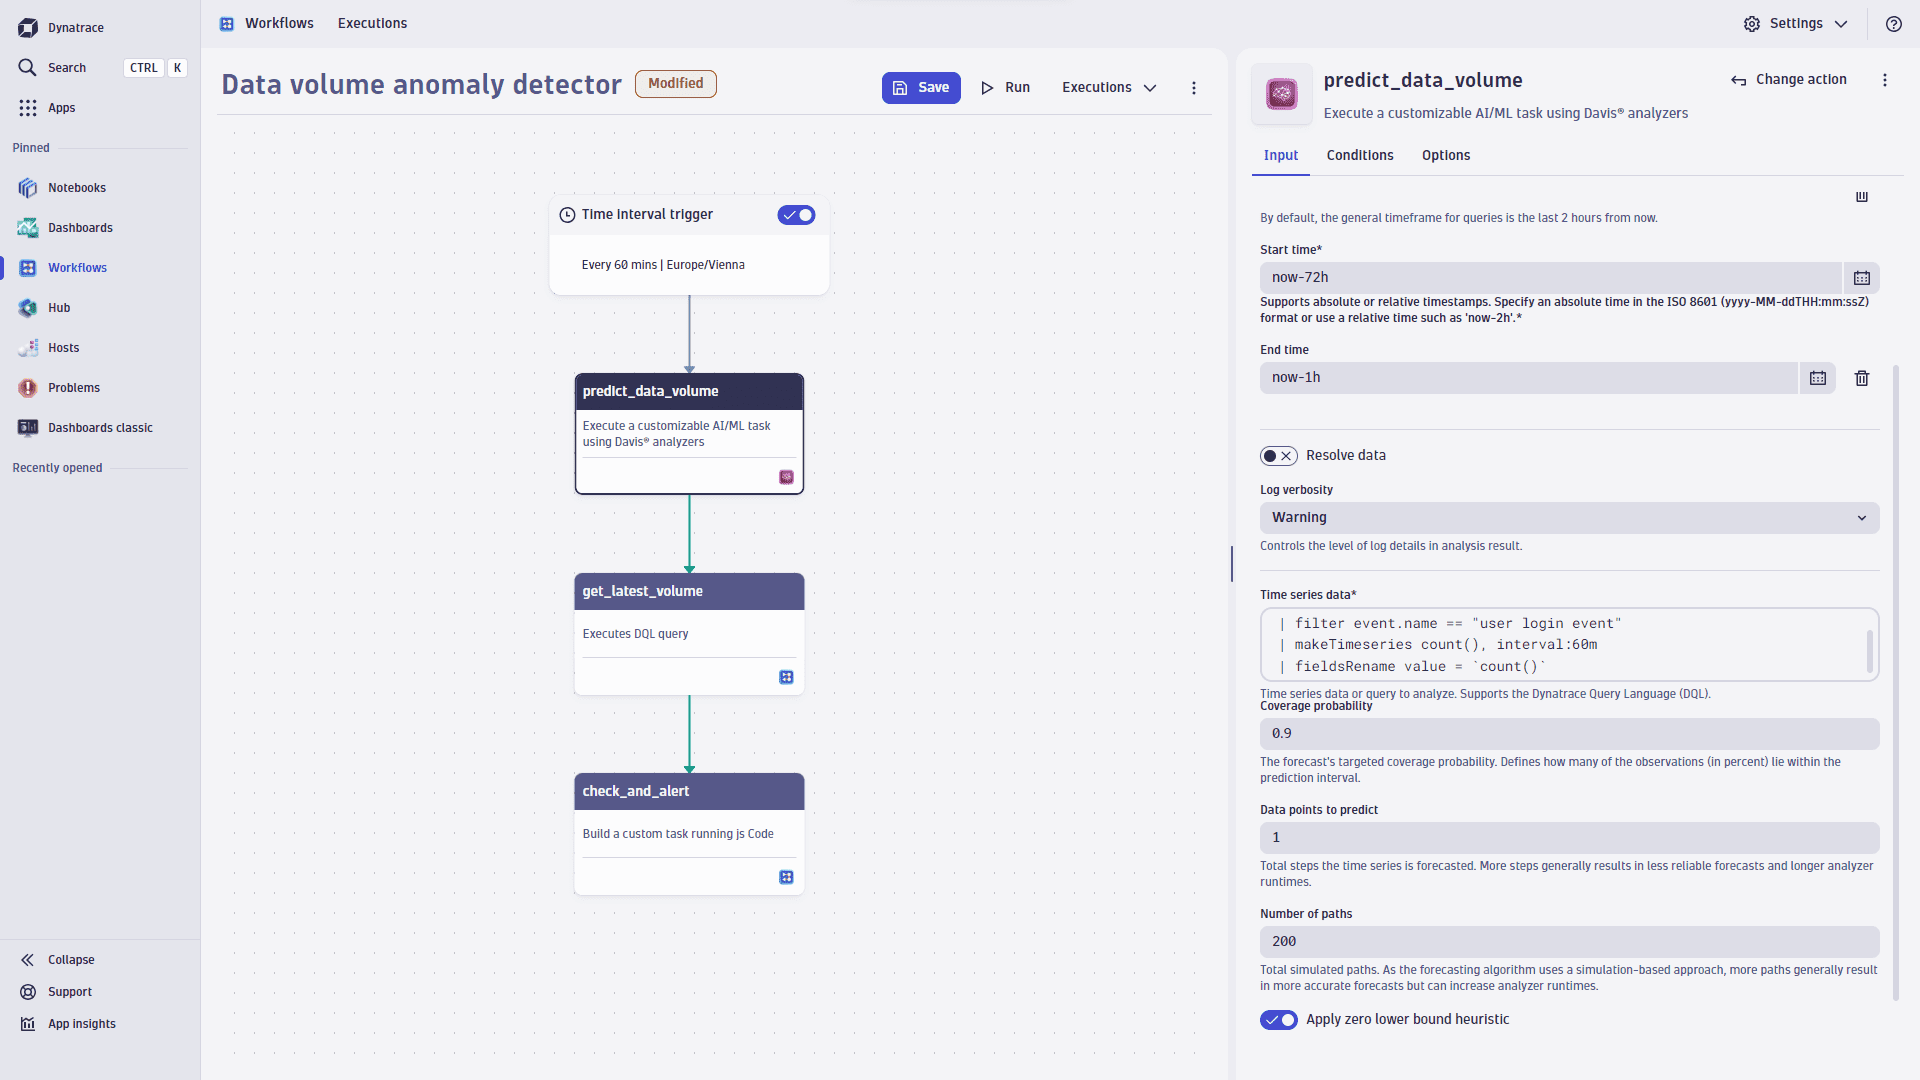
- Set the learning period of 72 hours to train the forecast. This timeframe is generally suitable for regular, non-seasonal data ingestion, providing 72 training samples. However, if your data has seasonal trends (daily, weekly, etc), you need to adjust the learning period to at least two weeks.
- Set the Start time as
now-72h. - Set the End time as
now-1h. - Paste the above query into the Time series data field. Be sure to adjust the event name so it matches real events in your system.
- Keep the Coverage probability at
0.9. This value controls narrow is the probability band of the forecast. The value of0.9ensures 90% of the future points lying within the prediction interval. - Set Data points to predict as
1. This approach is called one-step-forward prediction—we request the forecast of one data point and then validate the actual incoming value against it.
3. Retrieve current data records
Now, we need to count data records in the most recent batch. We can do it via the DQL query:
fetch events, from:now()-60min| filter event.name == "YOUR INTERESTING EVENTS"| summarize count = count()
- On the Davis node, select
to browse available actions.
- In the side panel, search the actions for DQL and select Execute DQL Query.
- Paste the above query into the input field. Be sure to adjust the event name so it matches real events in your system.
4. Compare predicted data volume to current volume and alert
The final step of the workflow is to compare the predicted data volume with the actual value and raise an event in case the actual value is outside of the forecast boundaries.
- On the DQL node, select
to browse available actions.
- In the side panel, search the actions for javascript and select Run JavaScript.
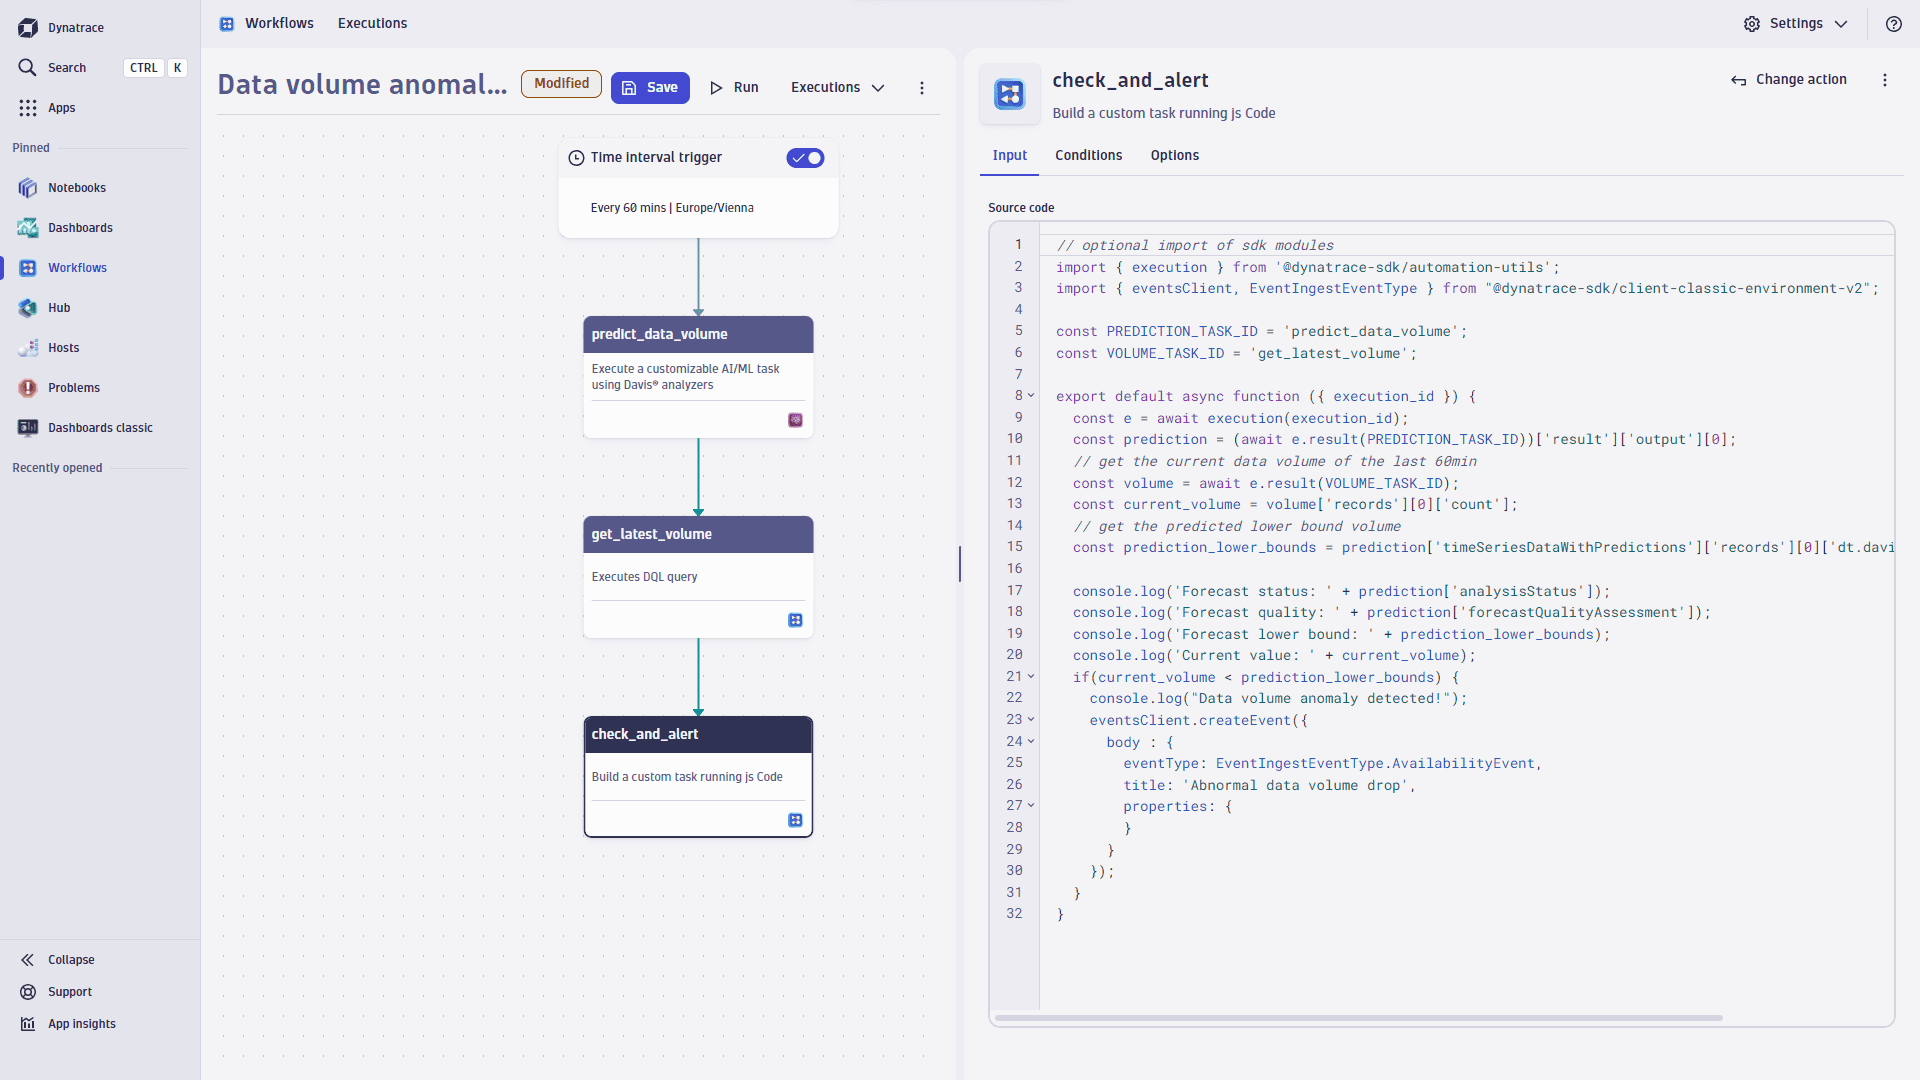
- Paste the following code into the input field.
Show TypeScript code
import { execution } from '@dynatrace-sdk/automation-utils';import { eventsClient, EventIngestEventType } from "@dynatrace-sdk/client-classic-environment-v2";const PREDICTION_TASK_ID = 'predict_data_volume';const VOLUME_TASK_ID = 'get_latest_volume';export default async function ({ executionId }) {const e = await execution(executionId);const prediction = (await e.result(PREDICTION_TASK_ID))['result']['output'][0];// get the current data volume of the last 60minconst volume = await e.result(VOLUME_TASK_ID);const current_volume = volume['records'][0]['count'];// get the predicted lower bound volumeconst prediction_lower_bounds = prediction['timeSeriesDataWithPredictions']['records'][0]['dt.davis.forecast:lower'][0];console.log('Forecast status: ' + prediction['analysisStatus']);console.log('Forecast quality: ' + prediction['forecastQualityAssessment']);console.log('Forecast lower bound: ' + prediction_lower_bounds);console.log('Current value: ' + current_volume);if(current_volume < prediction_lower_bounds) {console.log("Data volume anomaly detected!");eventsClient.createEvent({body : {eventType: EventIngestEventType.AvailabilityEvent,title: 'Abnormal data volume drop',properties: {}}});}}
5. Observe low data volume alerts
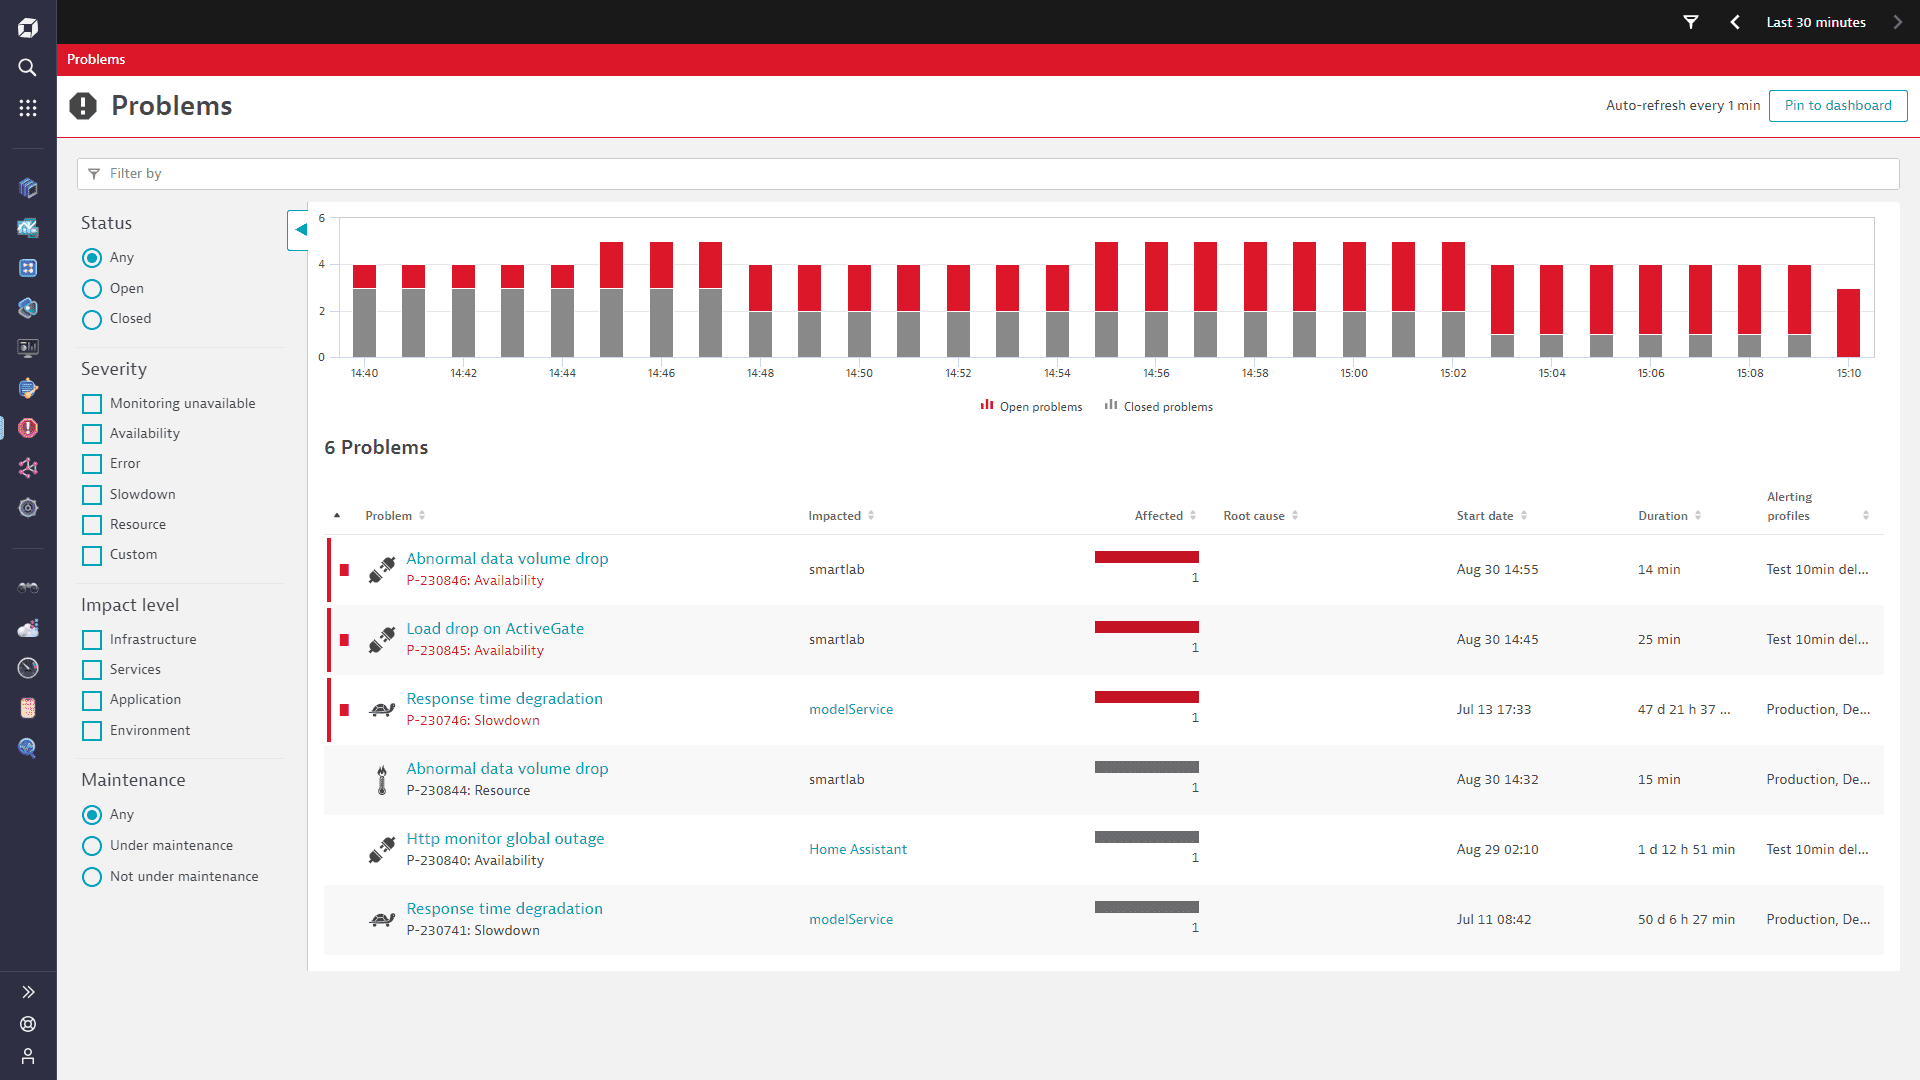
Whenever the observed data volume falls below the lower threshold of the forecast, Dynatrace triggers a Low data volume notification. The image below shows examples of such alerts.
