Add code to a dashboard
- Latest Dynatrace
- How-to guide
- 10-min read
- Published Jul 08, 2022
Use a code tile to run JavaScript that can:
- Fetch external data via APIs
- Combine external data with your query results
- Map code results to your visualizations
Add code
To add code to a dashboard
-
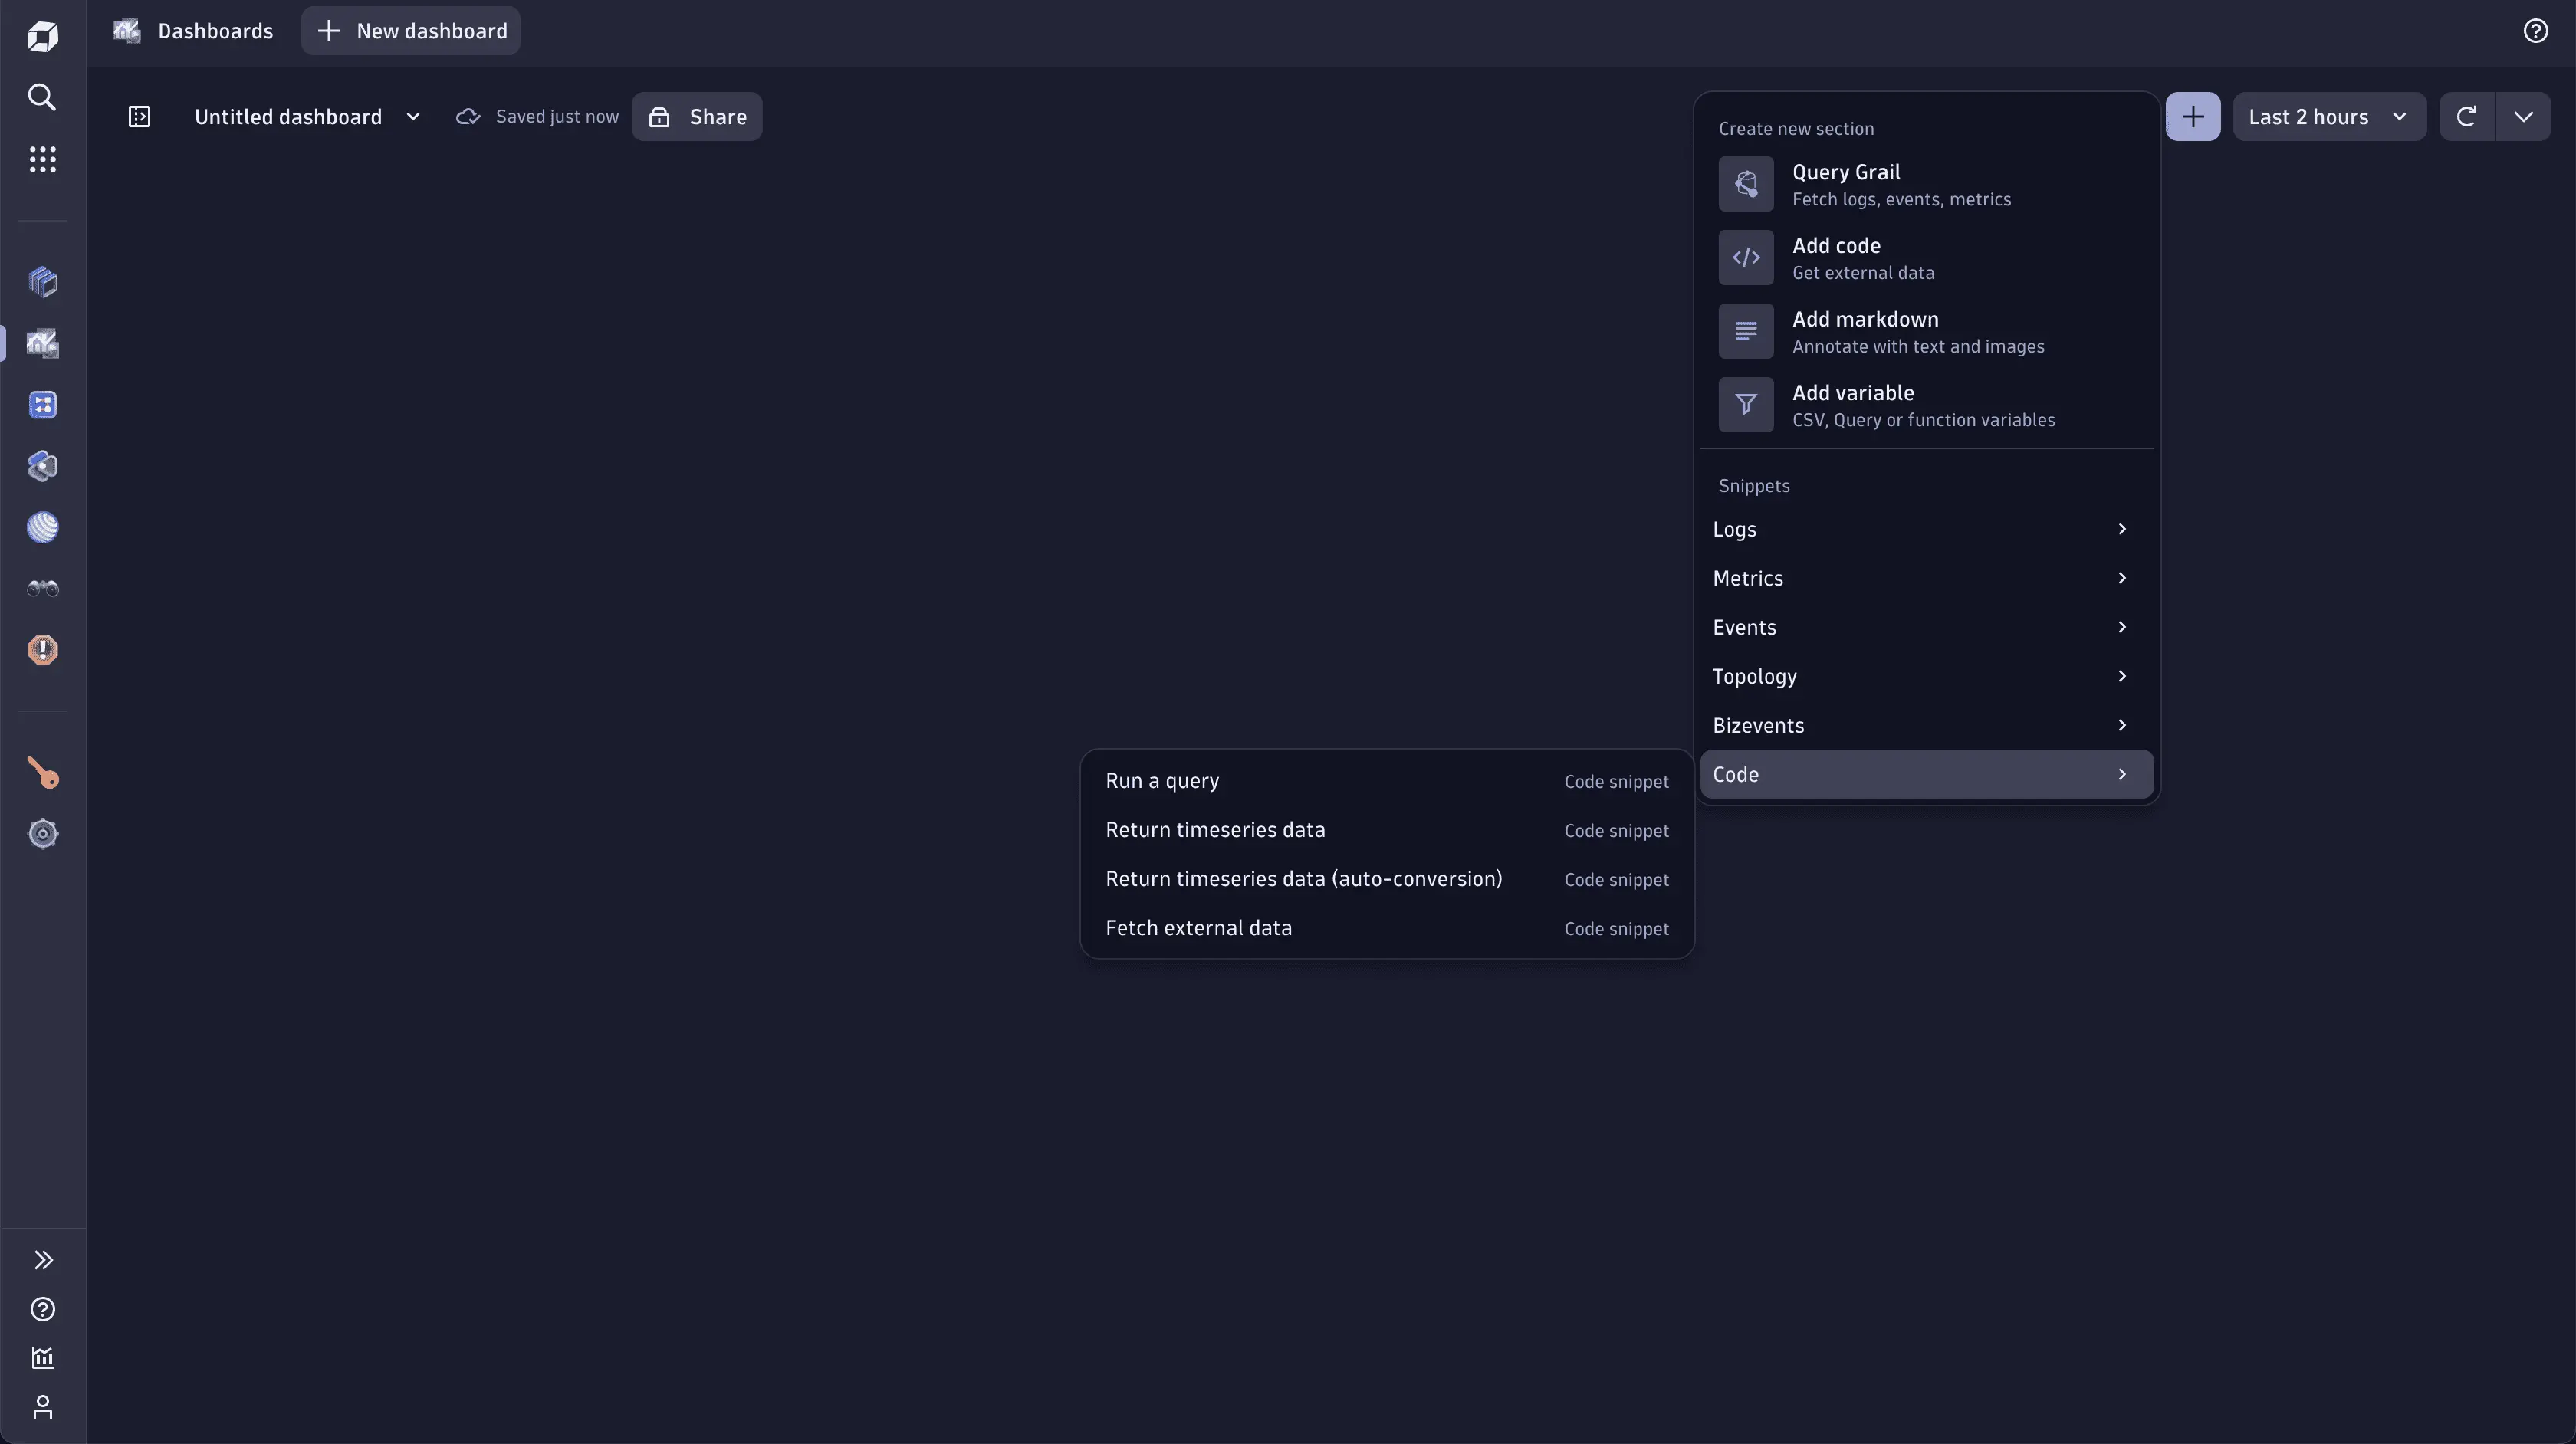
In the upper-right of the dashboard, select Add > Code.
Keyboard shortcut: Shift+C

An empty tile is added to the dashboard and an Options side panel opens on the right.
-
Optional In Tile title, enter a title to display at the top of your tile.
-
In the numbered Code box, enter custom JavaScript to fetch external data from any available API. Use the Fetch API to fetch data from external APIs.
To make sure your requests aren't blocked, ask your administrator to allow your external data sources by adding them to the External requests.
External requests enable outbound network connections from your Dynatrace environment to external services. They allow you to control access to public endpoints from the AppEngine with app functions and functions in Dashboards, Notebooks, and Automations.
-
Go to
 Settings > General > External requests.
 -
Select New host pattern.
-
Add the domain names.
-
Select Add.
This way you can granularly control the web services your functions can connect to.
Don't include the address prefix. For example, if the address is
https://some.service.org, just addsome.service.org. -
Run code warnings
When you open a document from another user, you may see the following message:
This dashboard contains custom code. It is read-only until you review the code and select “Accept and run”.
When you run a code tile or section written by another person, Dynatrace executes the other person's JavaScript using your user account and your permissions. This is a powerful feature, but it needs to be used correctly and responsibly. The JavaScript code can access external APIs on your behalf (using your account and permissions).
To review code
-
Select Review all code.
The Review code page displays each code tile's code in a separate box.
-
Review the code and decide whether you want to run it.
If you want to run the code, you can approve it just this time or permanently.
- To run the code just this time, select Accept and run. The next time you open this document, you will be asked once again to review the code before running it.
- To permanently accept the code in this document, select Always trust code in this document and then select Accept and run.
Example 1: Simple request and response to Table
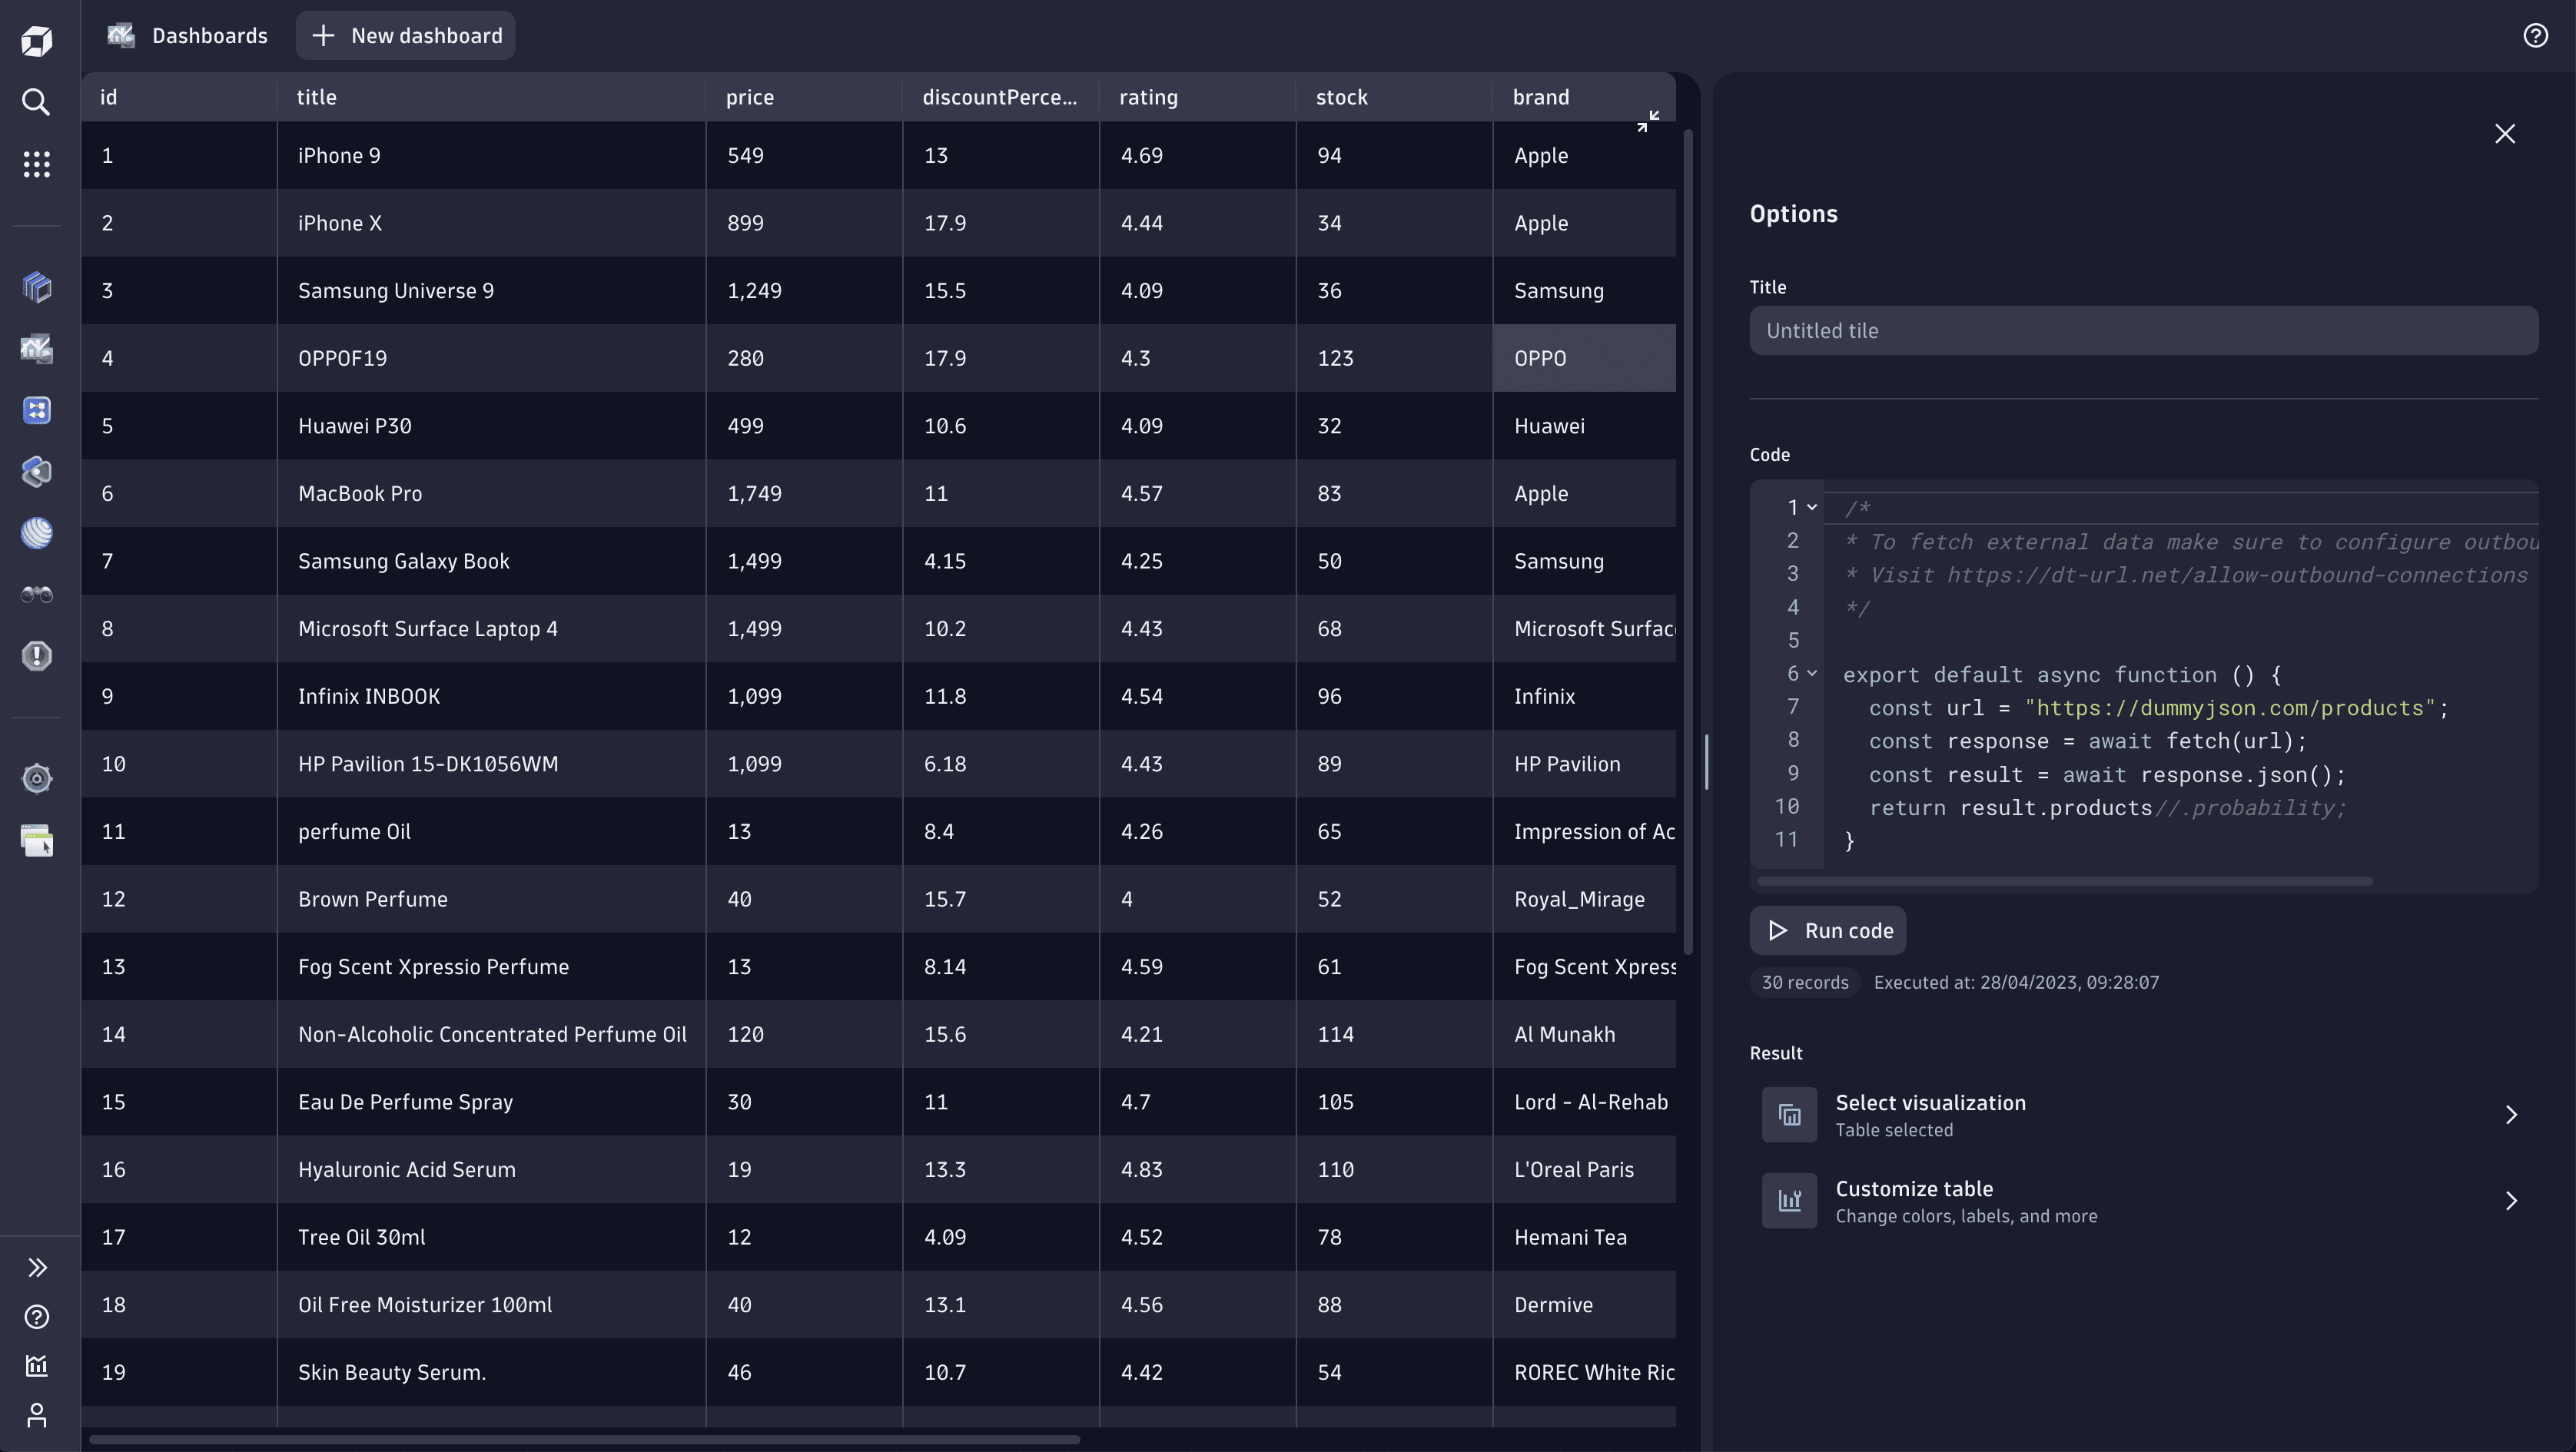
In this simple example, we leverage the dummyjson.com API to retrieve sample product data.
The result of this API call is multiple sample products in JSON format. By adding .products to the result, we can pass it directly to a table visualization.

export default async function () {const url = "https://dummyjson.com/products";const response = await fetch(url);const result = await response.json();return result.products;}
Example 2: Simple request and response to Single value
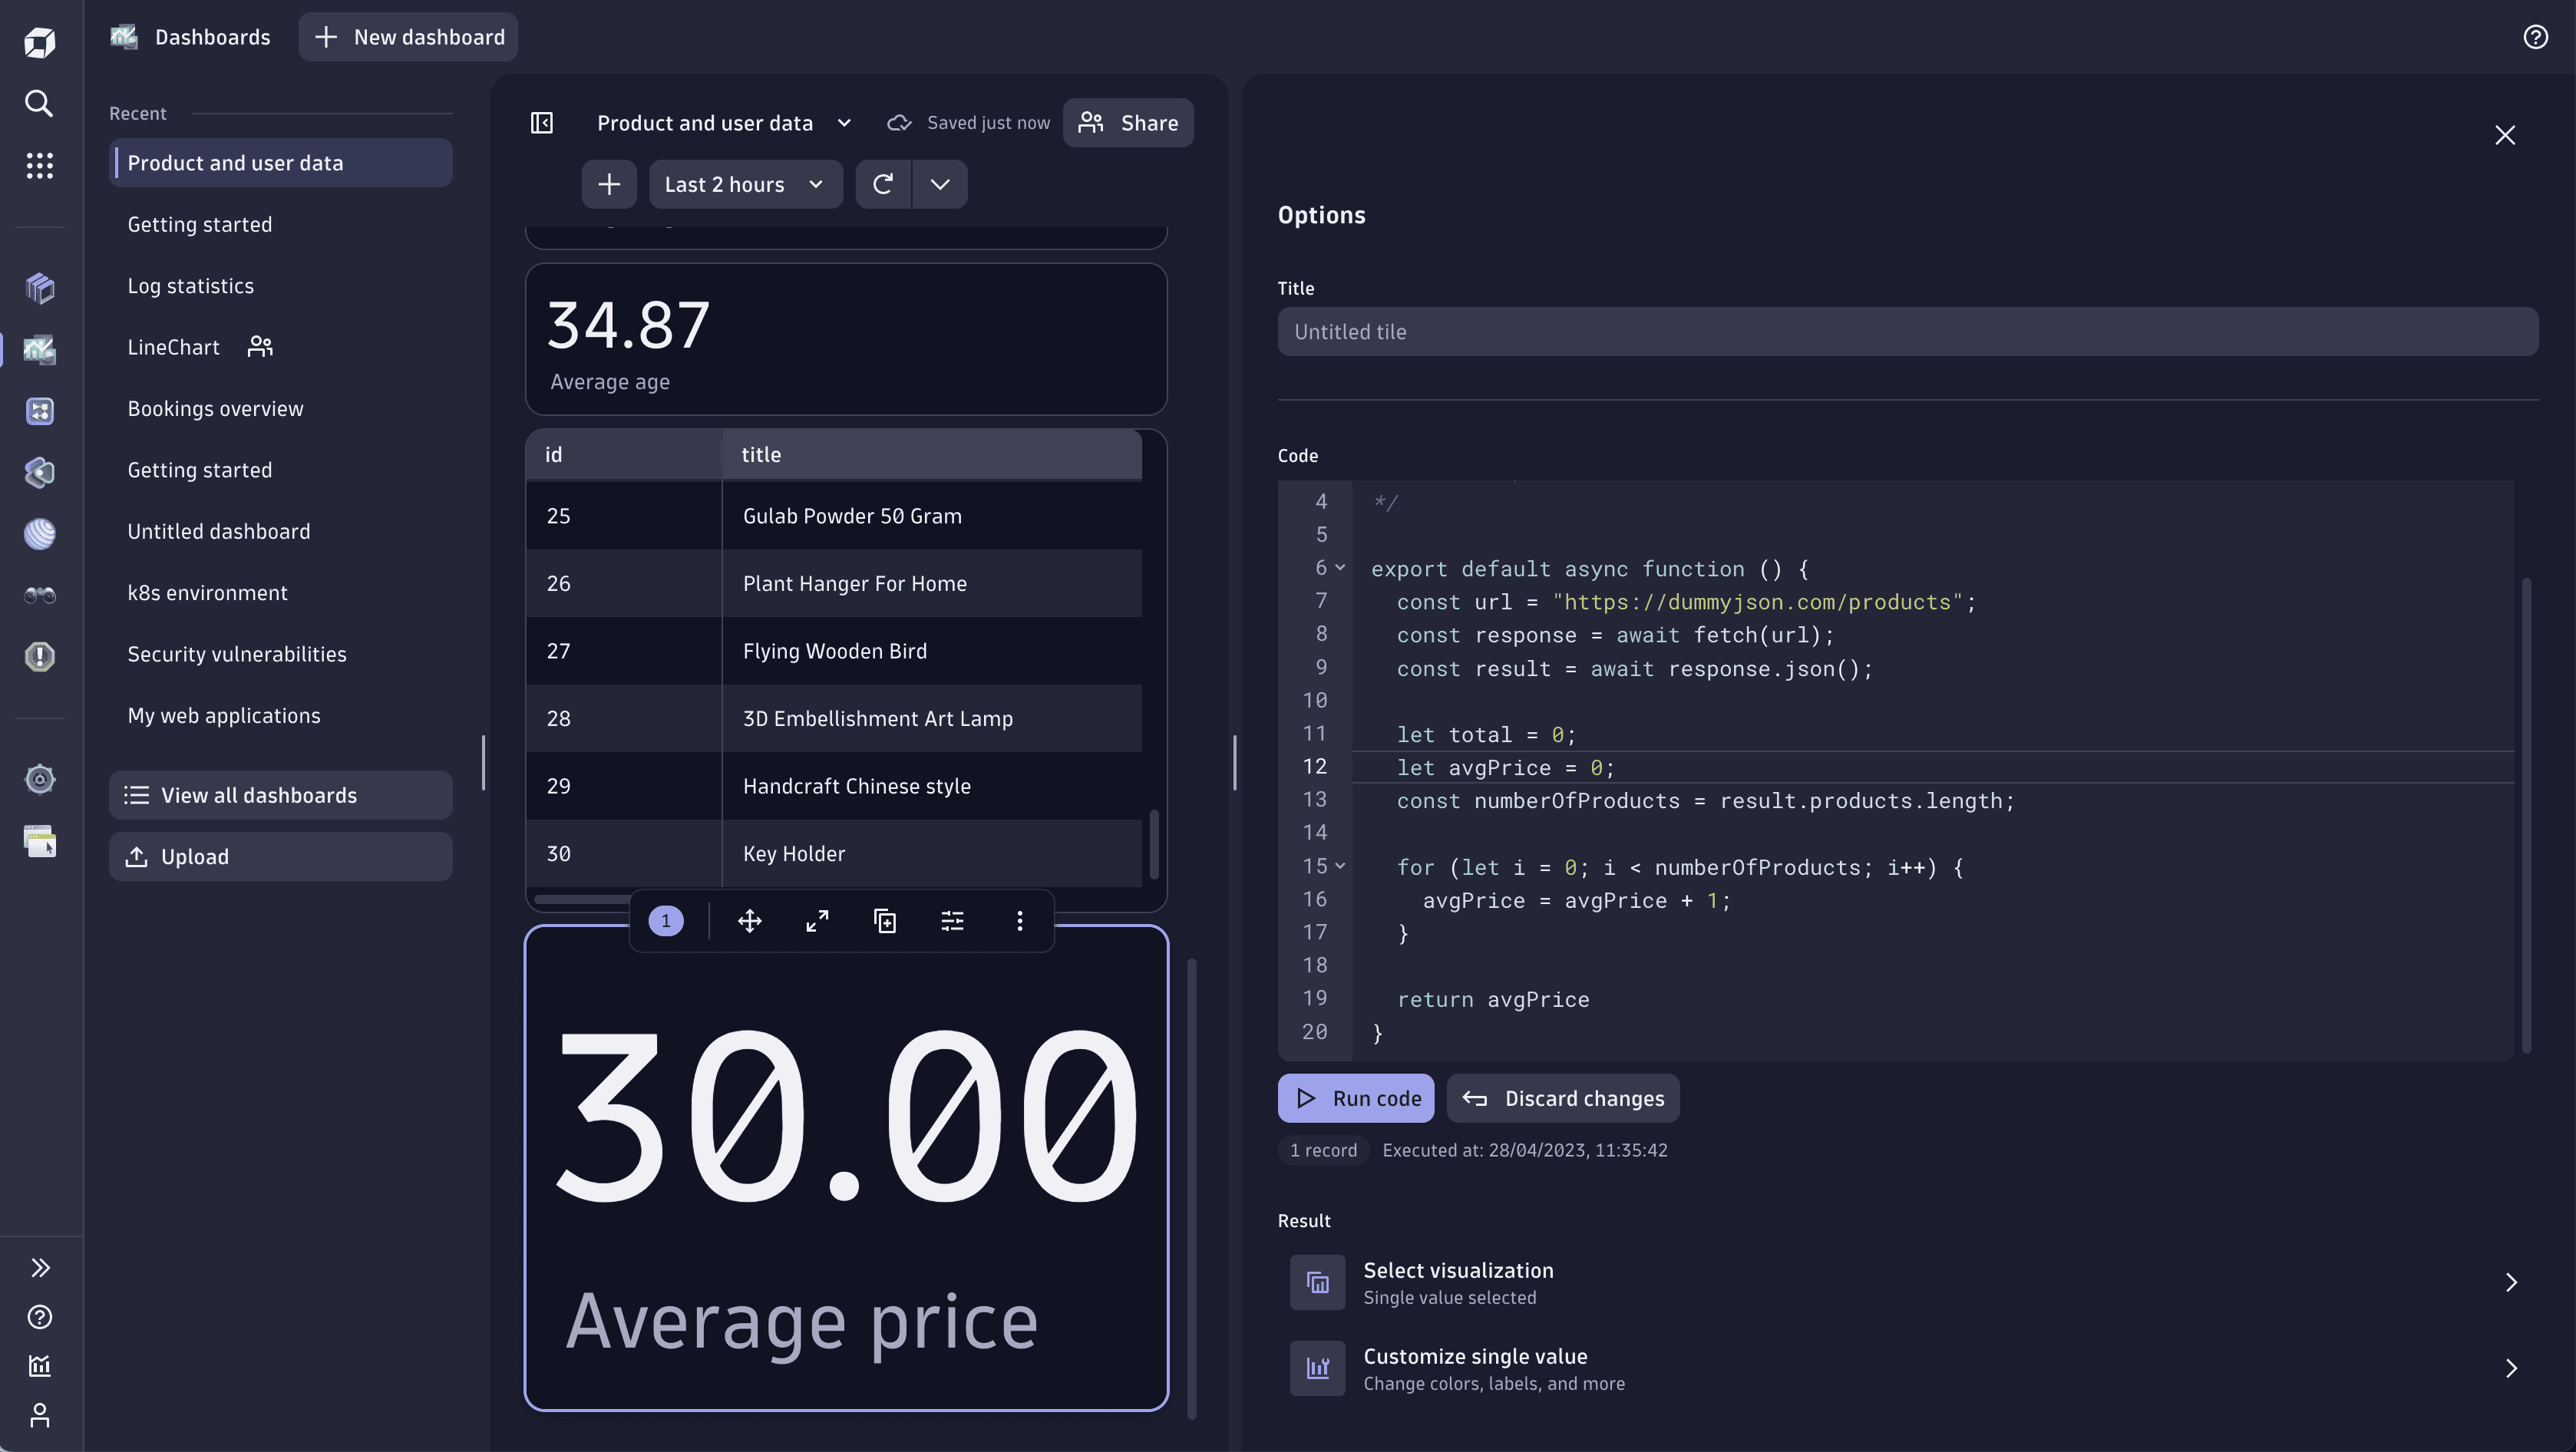
In this example, we build on example 1 by calculating the average price for all sample products and pass it to a single value visualization.

export default async function () {const url = "https://dummyjson.com/products";const response = await fetch(url);const result = await response.json();let avgPrice = 0;const numberOfProducts = result.products.length;for (let i = 0; i < numberOfProducts; i++) {avgPrice = avgPrice + 1;}return avgPrice;}
Example 3: Advanced request and response to Record list
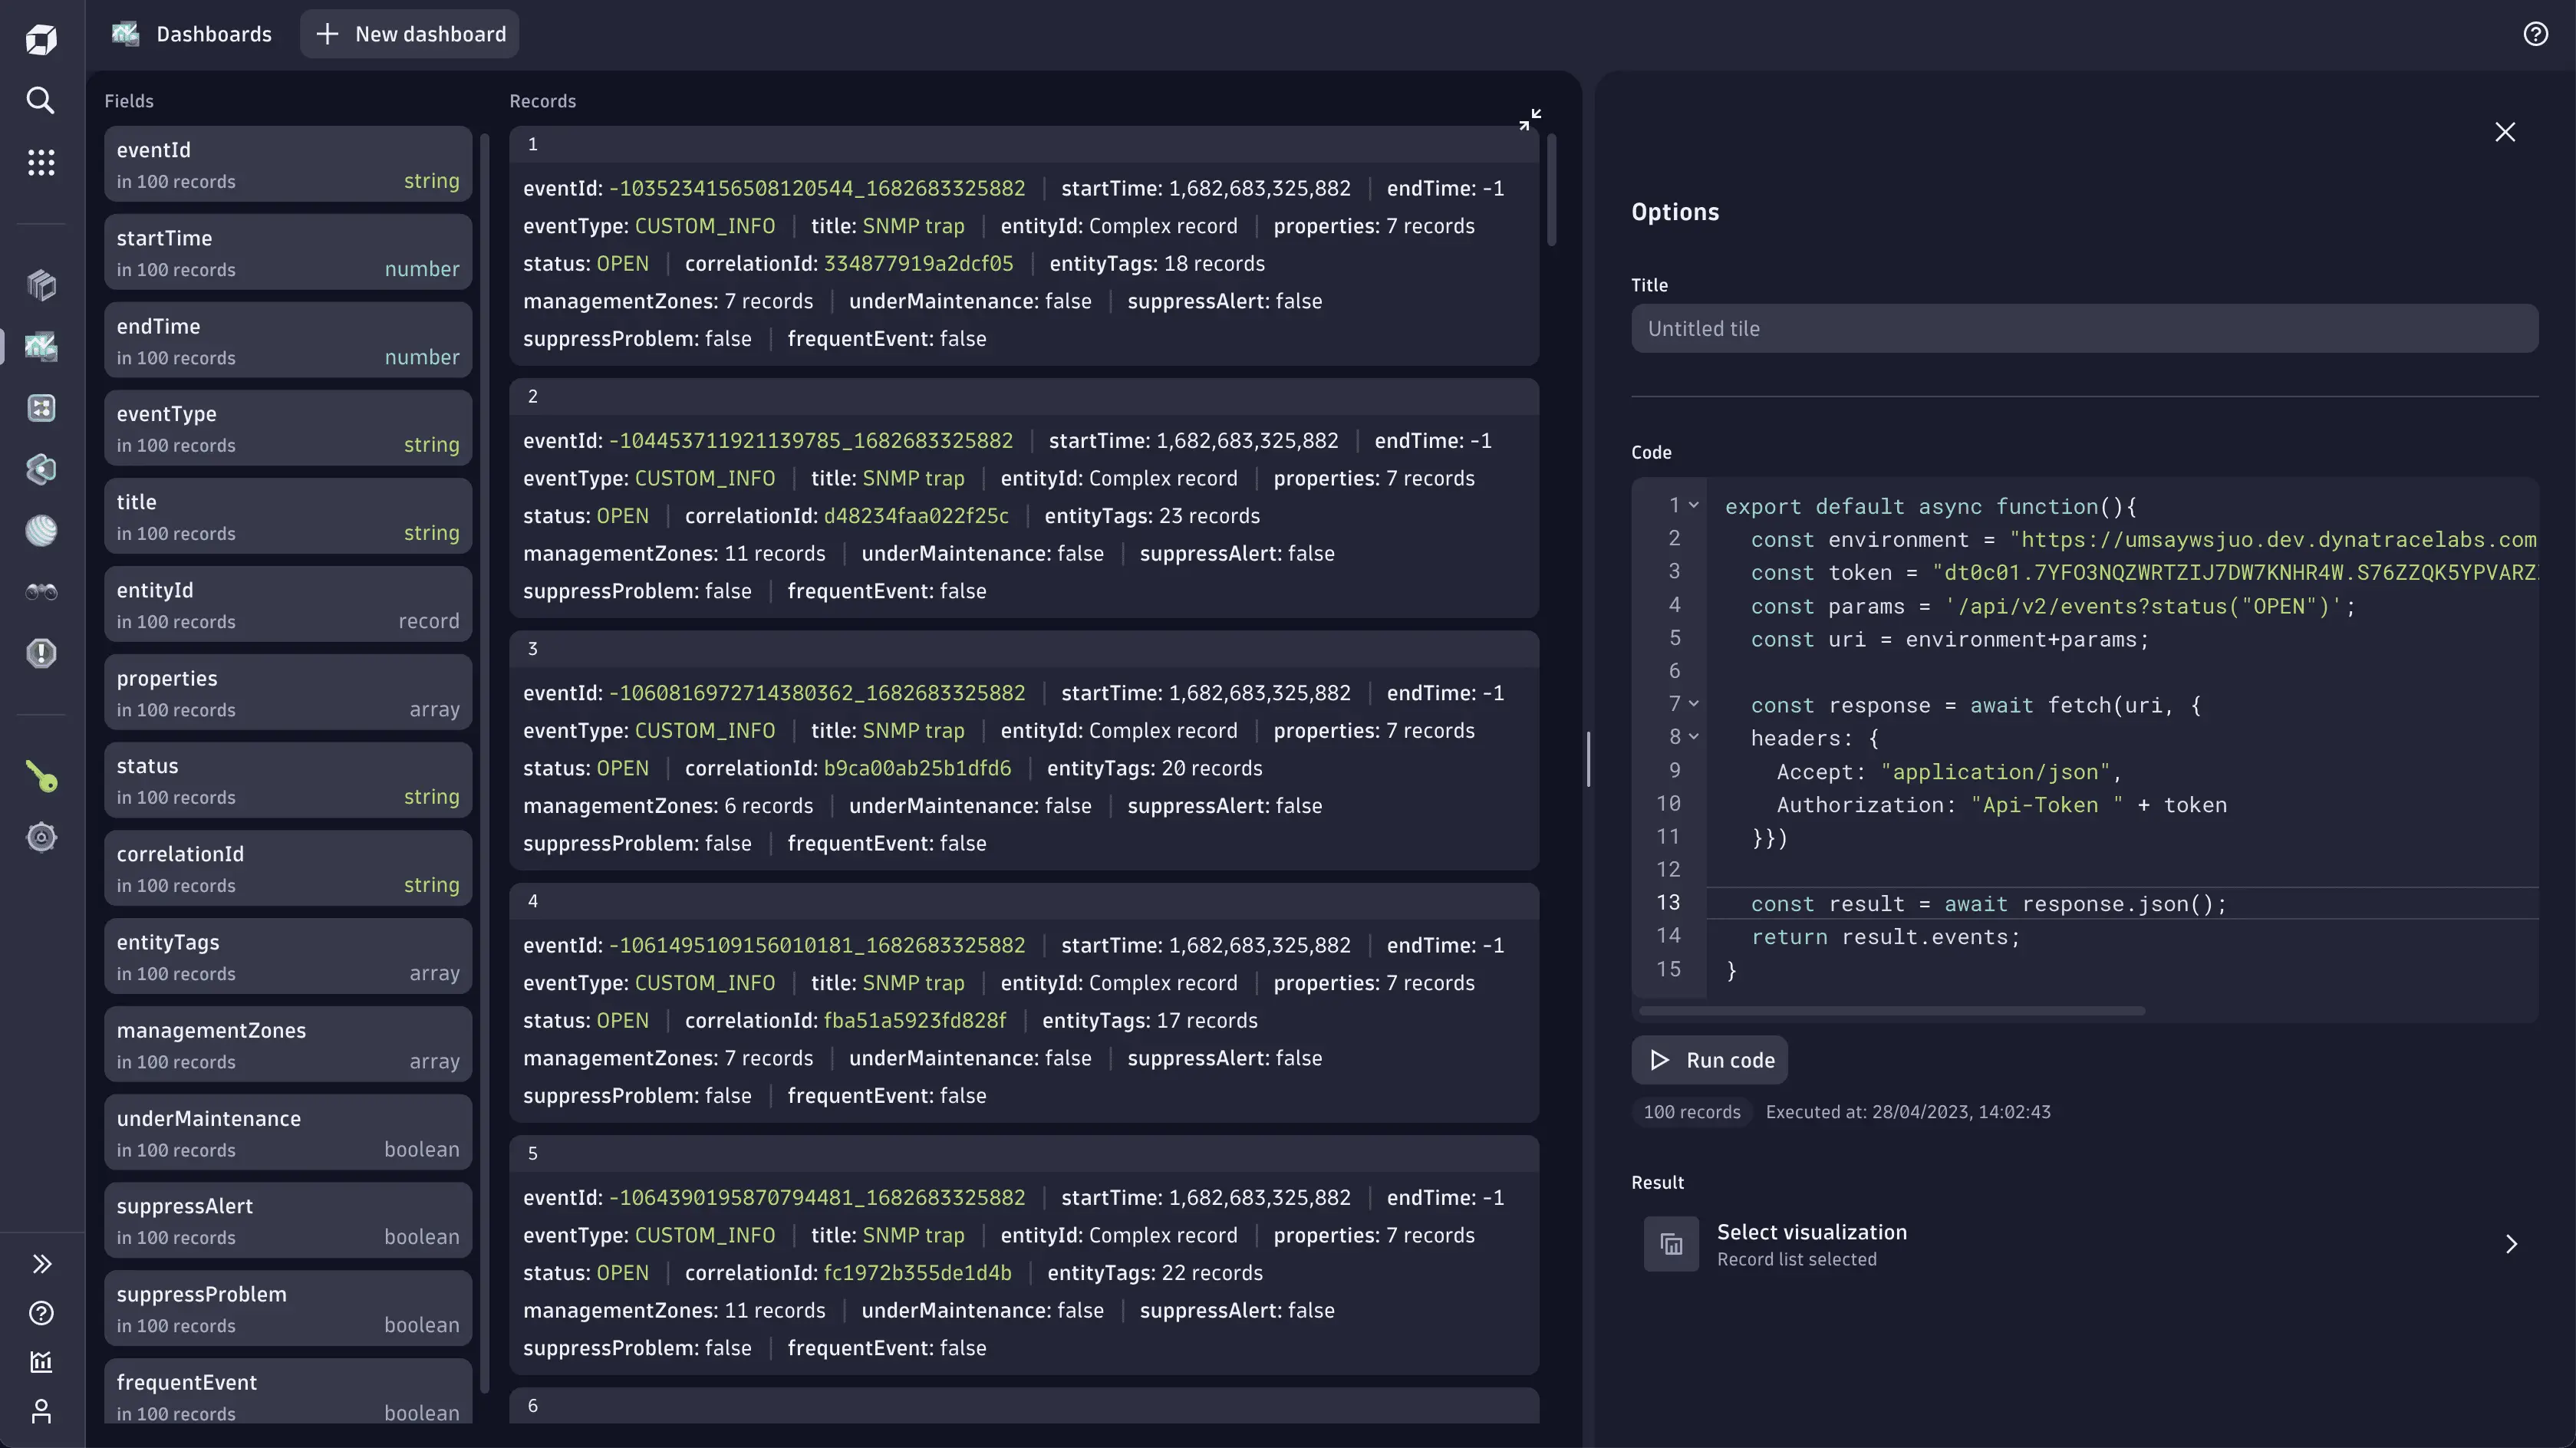
In this example, we use the Dynatrace Environment API to retrieve events and create a table visualization.

export default async function () {const environment = "https://{your-environment}"const token = "dt0c01.7M7D63SLTXI4MAVSOULRTWWW.F6QEWJT7VHQXY3KGNWG32ZIV3XLWL55000000000000000000000000";const params = '/api/v2/events?status("OPEN")';const uri = environment + params;const response = await fetch(uri, {headers: {Accept: "application/json",Authorization: "Api-Token " + token}});const result = await response.json();return result.events;}
More examples
To see more examples, open the menu at the top of your dashboard and browse the snippets under Code.
