What's new in Dynatrace SaaS version 1.306
- Latest Dynatrace
- Release notes
- 11-min read
This page showcases new features, changes, and bug fixes in Dynatrace SaaS version 1.306.
To learn about new Dynatrace Apps and feature updates with this release, select an item from the table below.
| Category | Updates in this release |
|---|---|
| Across platform | 15 ( Breaking changes 2) |
 Dashboards and Dashboards and  Notebooks Notebooks | 1 |
 Distributed Tracing Distributed Tracing | 2 |
 Infrastructure & Operations Infrastructure & Operations | 2 |
 Investigations Investigations | 1 |
 Kubernetes Kubernetes | 1 |
Across platform
Breaking change 
Logs Classic custom attribute keys are now case-sensitive
This release ends the transition period for custom attribute case-sensitivity changes started in Dynatrace version 1.296.
Starting with this release (Dynatrace version 1.306):
- Custom attributes allow uppercase letters.
- Attributes of ingested log events are strictly matched with the attribute definitions (including uppercase or lowercase).
Custom attribute keys have to be case-sensitively unique, which means that custom attributes differing only in letter case are no longer treated as the same attributes. For example, it is now possible to define two different custom attributes named MyAttribute and myattribute.
Searches become case-sensitive (except for filter-only attributes). For example, if you define a custom attribute MyAttribute, then a search for MyAttribute="SEARCH" will return log events having this particular attribute value set to SEARCH but myattribute="SEARCH" will not.
Query values remain case-insensitive. For example, MyAttribute="SEARCH" is equivalent to MyAttribute="search".
Breaking change 
OpenPipeline Configuration API required permission has changed
The required permission for the “preview/processor” endpoint has changed from requiring openpipeline:configurations:write to just requiring openpipeline:configurations:read.
Action plan: Be sure that OpenPipeline Configuration API users have openpipeline:configurations:read permission to access the “preview/processor” endpoint.
Feature update 
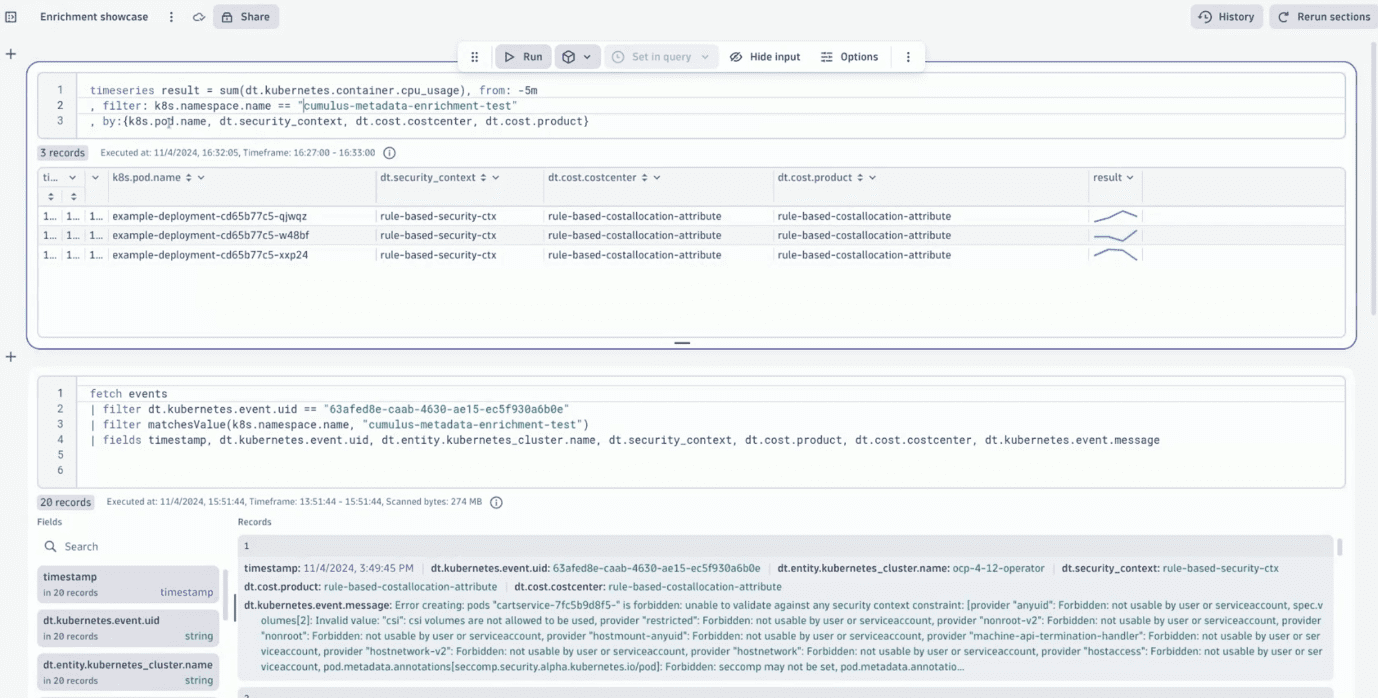
Apply context for charge-back and record-level permissions with Kubernetes telemetry enrichment
Utilize your Kubernetes metadata to allocate costs and define access permission. Set cost allocation attributes for your Kubernetes metrics, events, logs, and spans and define record-level permissions by setting the security context for your Kubernetes metrics, events, logs, spans, and entities.
You can easily define rules, how Dynatrace ActiveGate, Dynatrace OneAgent, FluentBit and the OpenTelemetry Collector will map Kubernetes labels and annotations to cost allocation attributes and the security context on ingested data. Utilize these attributes for record-level permission handling and customer
Feature update 
Minimized Kubernetes monitoring restarts
Kubernetes settings updates that don't include an actual change in content have less impact on Kubernetes monitoring restarts.
Feature update 
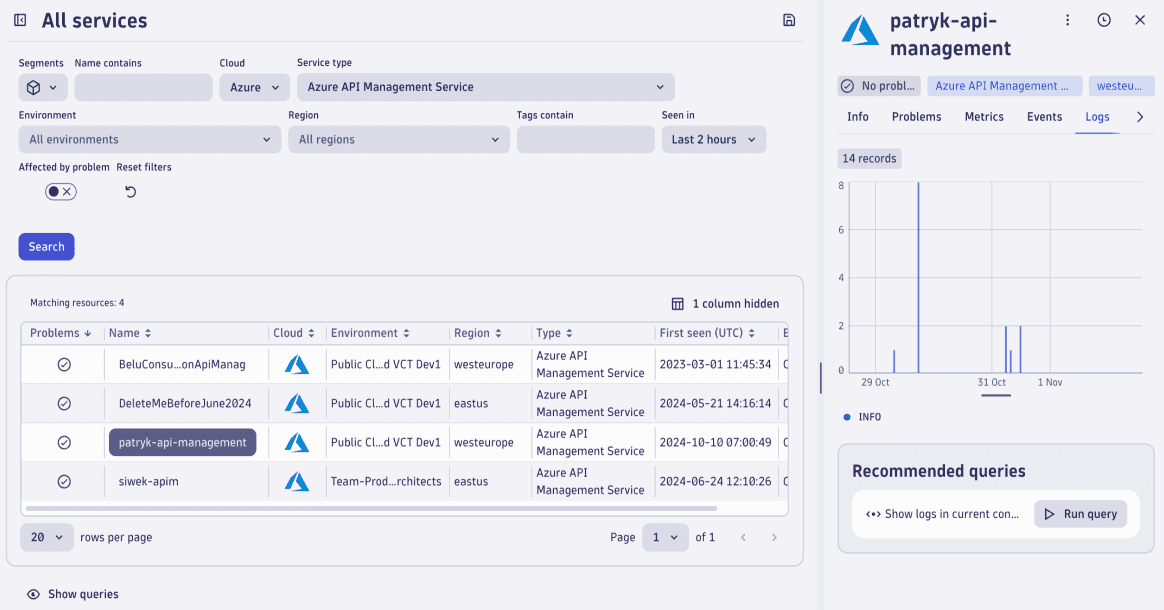
Azure log forwarder: Fix entity linking
Link to both built-in and custom device entities on logs coming from the Azure Log Forwarder, referenced in the property “dt.source_entity”.
Feature update 
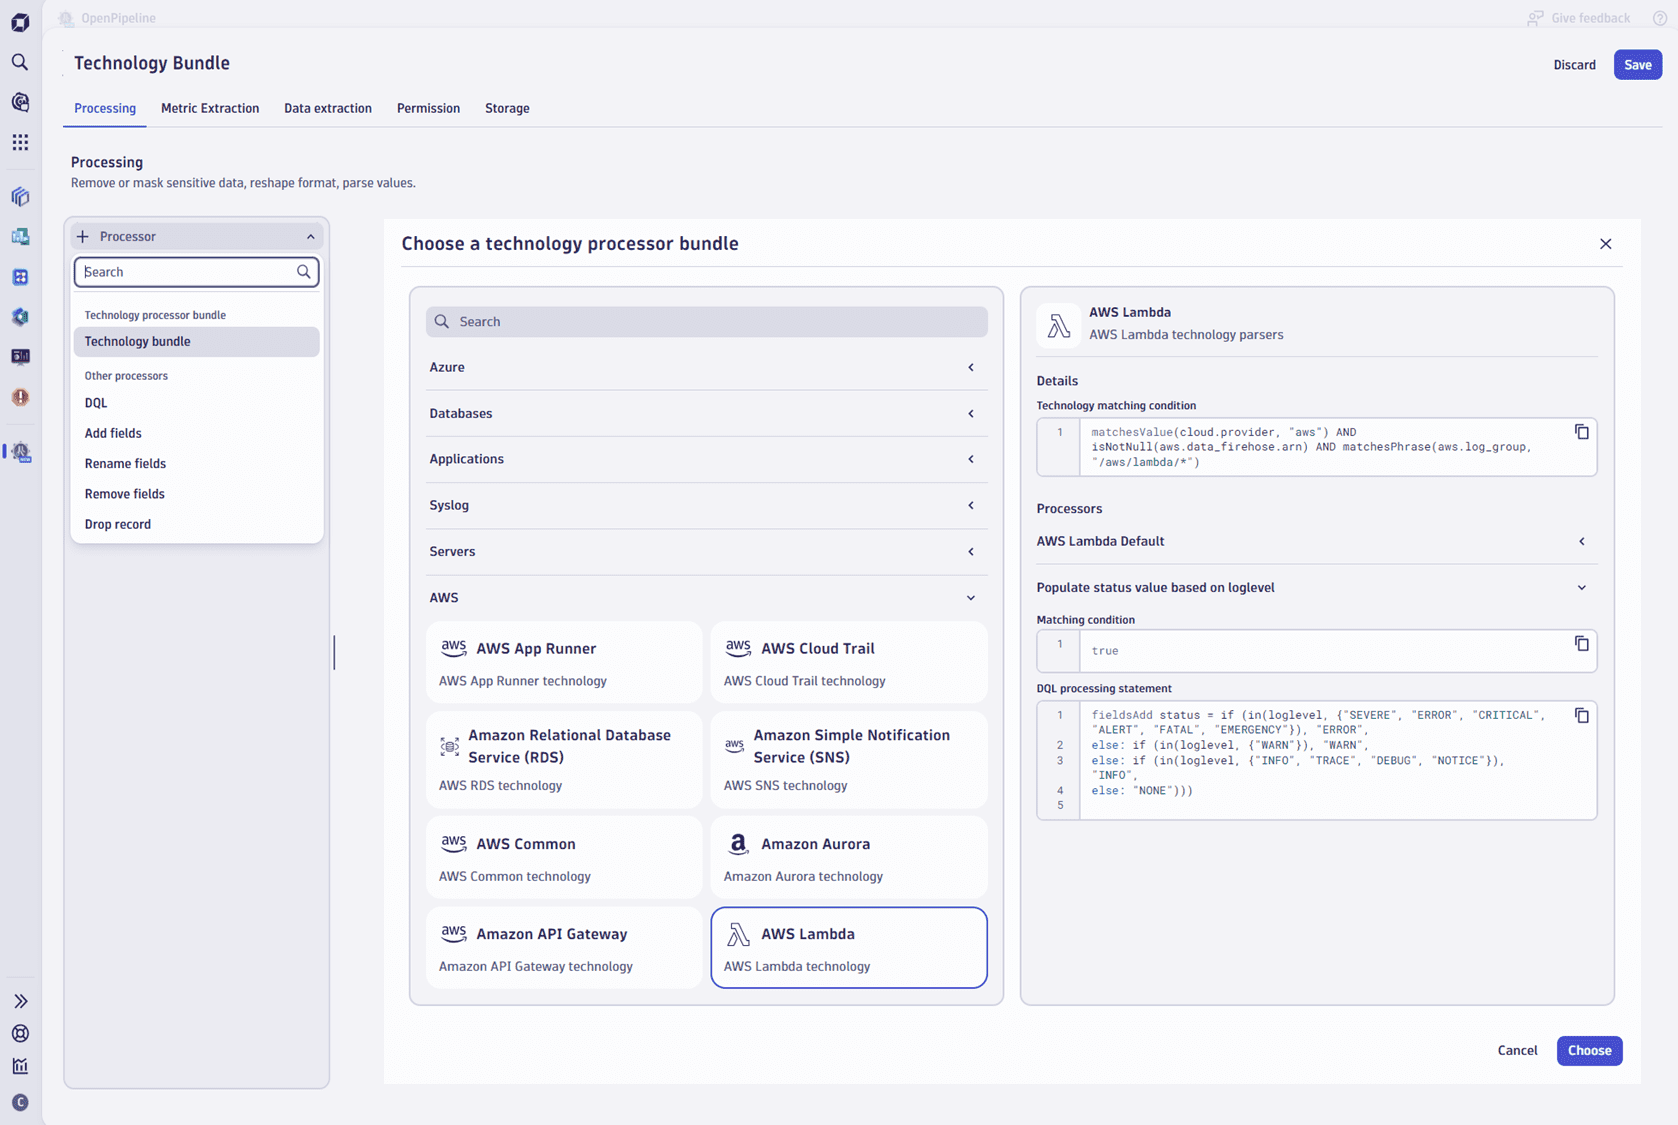
OpenPipeline: Simplified creation of pipelines
With this release we have added a new OpenPipeline processor called “Technology bundles”, which drastically reduces the complexity to process incoming log data.
Choose from a growing library of supported technologies and services and parse well-known data formats with almost no effort. The technology bundles ensure, that log entries are matching the definitions of the Dynatrace Semantic Dictionary and you can easily extract data attributes for further analysis.
Feature update 
Enhance DQL with array math functions: Introducing arrayCumulativeSum()
The arrayCumulativeSum() function adds all values within an array containing long or double values cumulatively.
This is especially useful if you want to see a running total for your array for a specific time period (for example, counting the number of errors occurred on a day).
Parse XML documents with new DPL matcher
The new XML matchers XML, XML_PLAIN, and XML_VERBOSE allow you to parse XML documents.
Feature update 
OpenTelemetry: Default resource attributes allow list extended
The OTLP (OpenTelemetry Protocol) Metrics ingests default allow list for resource and scope attributes to be taken over as metrics dimensions have been extended. Several attributes in the k8s.* and dt.* namespace as well as service.instance.id have been added. If the new attributes are not desired, you can turn the individual toggles off (or remove the entry altogether) under Settings > Metrics > OpenTelemetry metrics > Allow list: resource and scope attributes
Feature update 
Platform search: Including Launchpad as new search category
The Platform search allows you to quickly find and access apps, documents, entities and much more within your Dynatrace environment.
With this release we have added launchpads as a new search category ensuring that you can quickly find their use case related, customizable start pages.

Learn how to configure your search experience and make use of launchpads.
Feature update 
Enriched billing events for function execution
We are introducing two new attributes to the billing events “AppEngine Functions- Small”. With adding caller.service.id (service invoking function call) and dt.app.id (app invoking function call) you can now identify AppEngine calls invoked from workflows and better track usage and analyze DPS consumption.
With this update, we are also deprecating the existing attributes invocation.type for all events with the type “AppEngine Functions-Small” and billing_type for all billing usage events. This change will go live in April 2025.
Feature update 
Unified ingest supports AWS Security Hub vulnerability finding events
You can now seamlessly ingest vulnerability finding events provided by AWS Security Hub and operationalize your data on the Dynatrace platform.
For details and instructions, see Ingest AWS Security Hub security findings.
Feature update 
Remove teaser in database-related services screen
Database-related services screens no longer show the teaser for the new Distributed Tracing experience.
Feature update 
New application parameter for user session anonymization
The Anonymization API - PUT anonymization job supports anonymization of user sessions based on an internal application ID via the parameter requestId (or clusterRequestIds for Premium High-Availability clusters).
Fixes and maintenance
Platform bug fixes, patches, and maintenance
Resolved issues in this release
- The CPU usage metric is now shown for CPU saturation events instead of system load in the platform Problems app. (DI-17654)
- Fixed an issue that caused some service- and application-based events to merge even if the ‘merge with existing’ flag was disabled. (DI-17513)
- Fixed an issue in which, in some cases, the mobile classic crash screen did not show the app version for a given crash. (DEM-2625)
- Fixed a case where the same root cause analysis Davis events could be written more than once to Grail with different
event.idvalues. (DI-17744) - Fixed a rare case where problems could link to each other as duplicates in a cycle, leading to both problems not being shown in the web UI. (DI-17312)
- Fixed a permissions issue with querying logs in the embedded view. (APPOBS-2918)
- Fixed an issue where event properties can be set to those from the event Semantic Dictionary model in the v2 REST API and then lead to temporary unexpected event states in Grail. The Semantic Dictionary fields only function when sent via a platform-reporting mechanism such as Davis anomaly detectors. (DI-17594)
- Changed the structure of the 403 response to POST
settings/objectsrequests: the JSON now represents a single object instead of an array. (PS-28811) - The
now()log processing function now returns the correct value. (PPX-3712) - Frequent issue detection is now disabled by default for events/problems raised on the environment singleton entity. There is an opt-in in the frequent issue detection settings. This does not affect frequent issue detection on applications, transactions, services, and infrastructure. (DI-17508)
- To better align with our REST guidelines, we have changed the format of the response body in case an error is returned from ingest endpoints. The response body in the case of an error will now be in an object that contains the error object inside with code and message properties. For example:
(PPX-3420){"error":{"code": 400,"message": "List of ingest events is required."}}
- Fixed Davis event in Grail writing of some reserved properties if overridden by custom properties. The properties cannot be overridden anymore, as the Davis system controls them. Affected properties are
affected_entity_types,entity_tags,dt.source_entity.type, anddt.entity.<type>.name. (DI-17975)
 Dashboards and
  Notebooks
Feature update
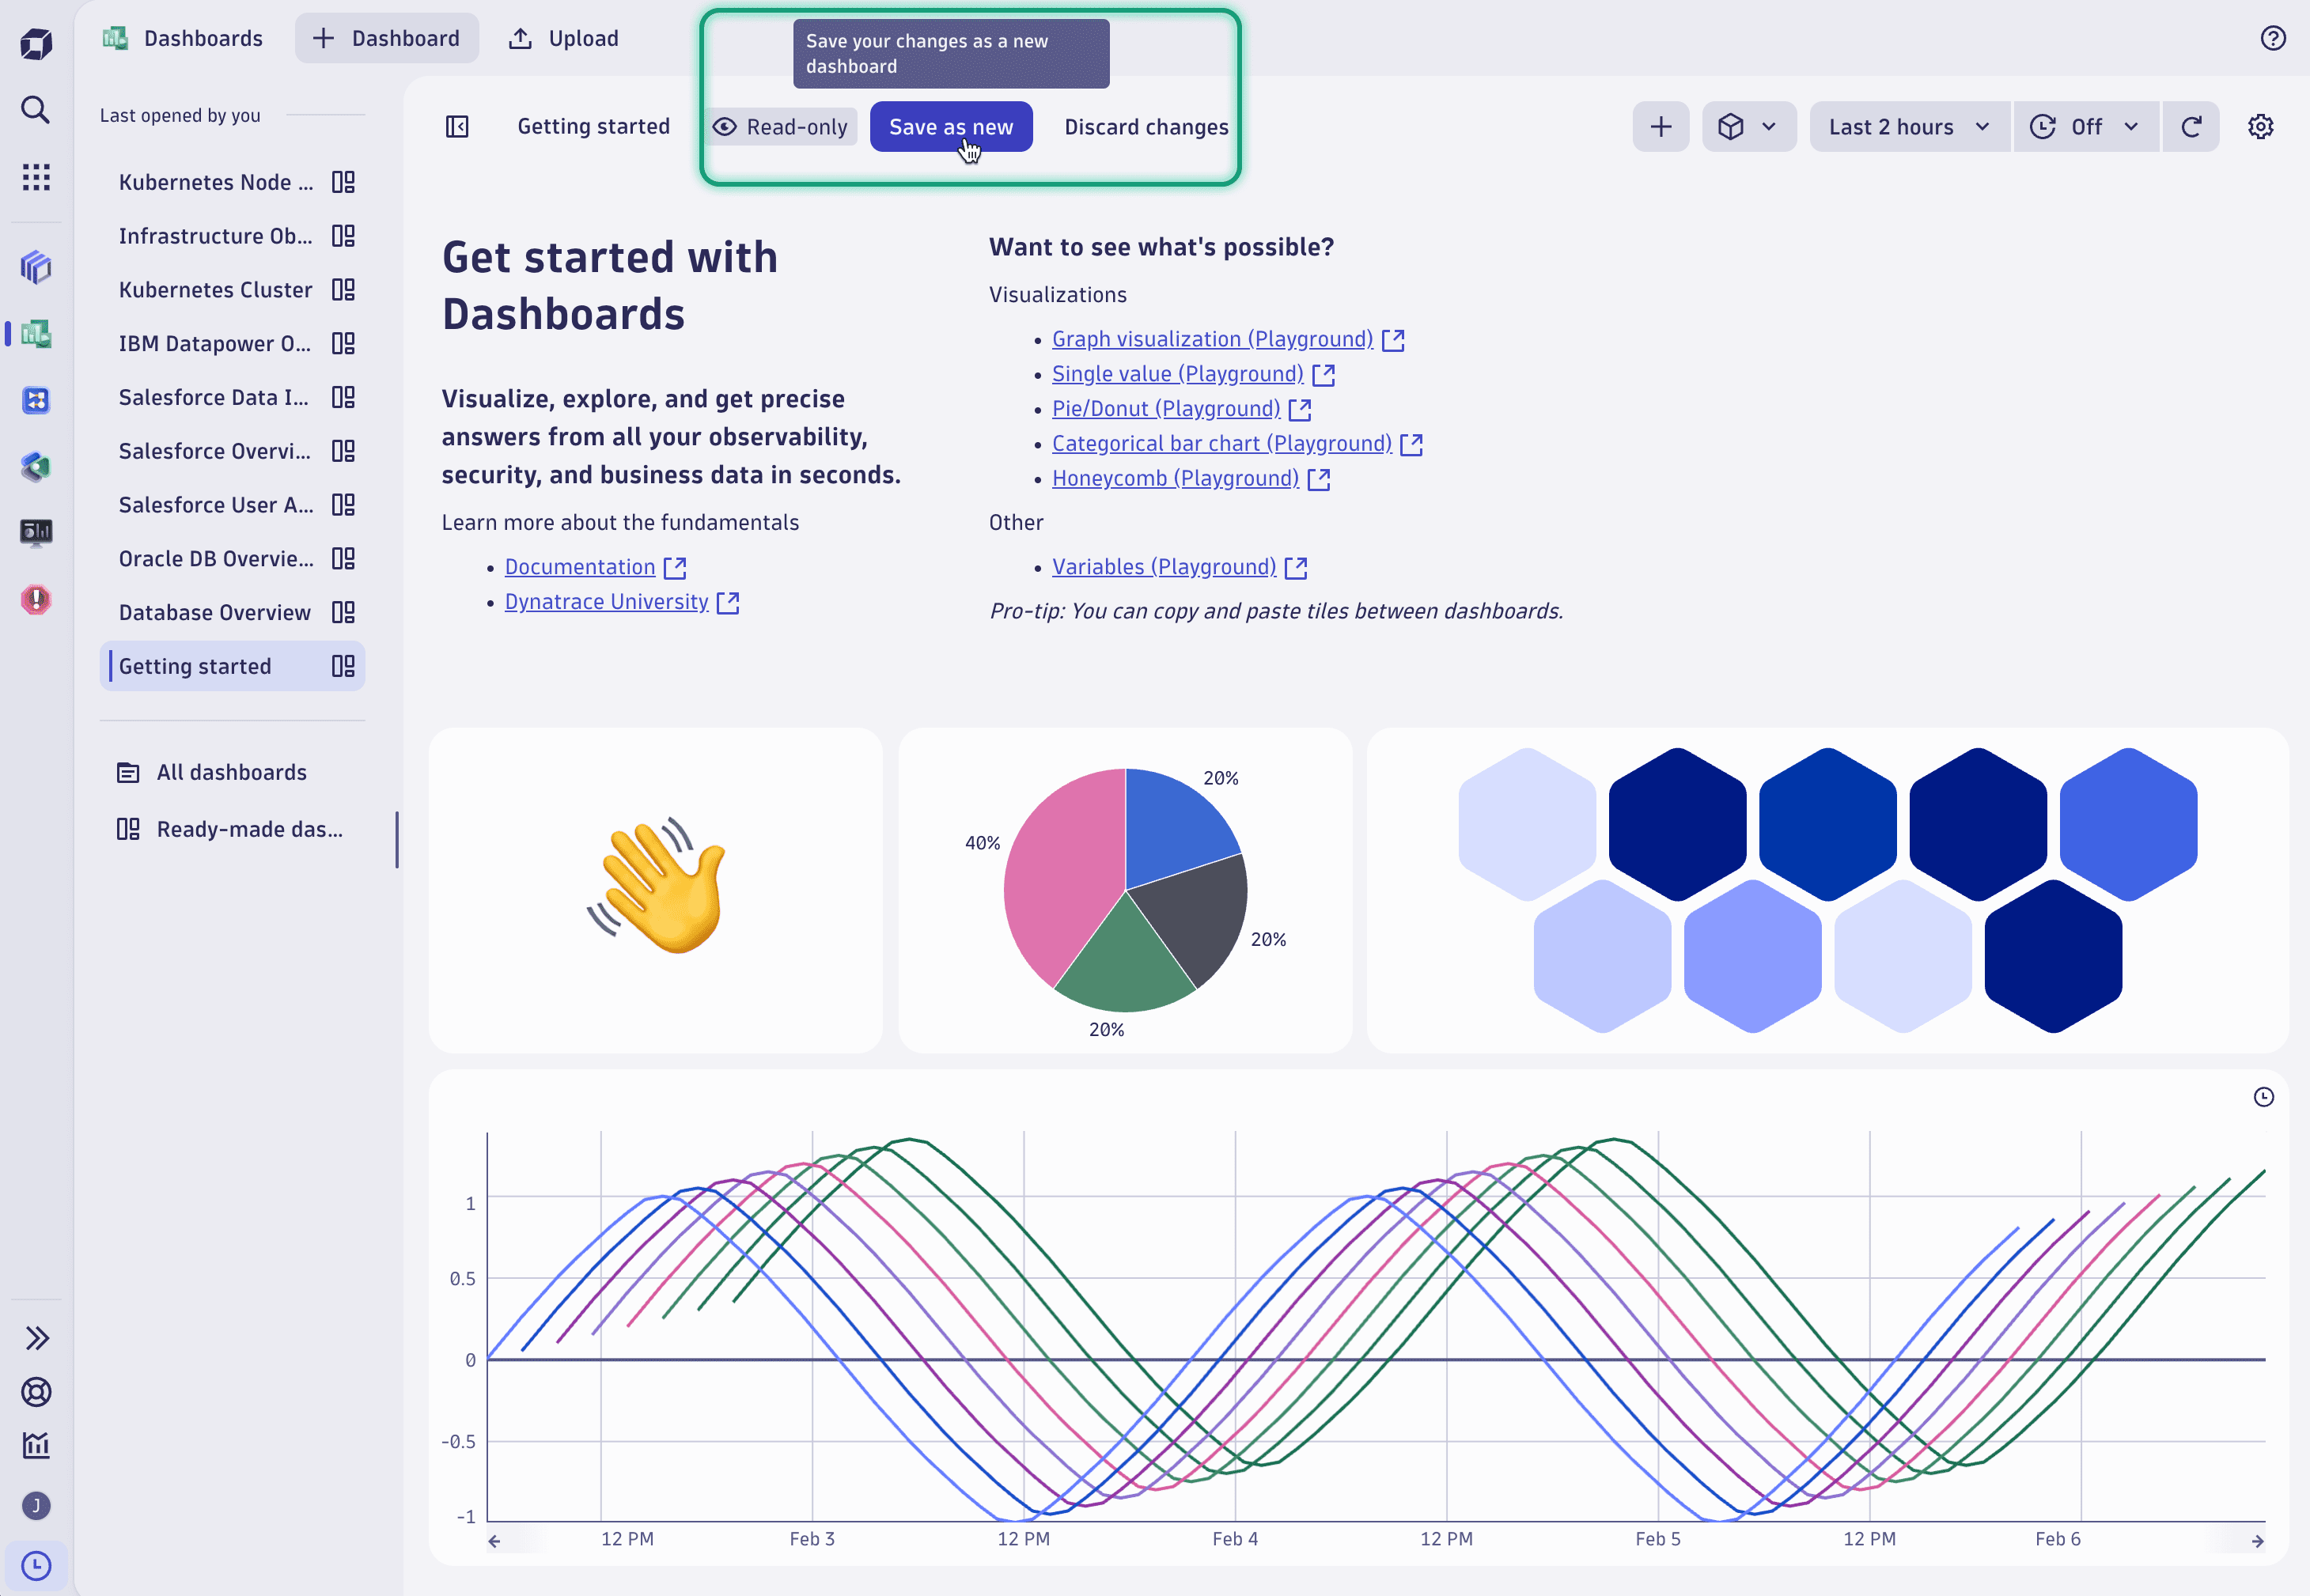
Improved collaboration on shared dashboards and notebooks
The newly introduced read-only mode let you share dashboards and notebooks with colleagues without changing the original document, while still offering them the opportunity to explore the underlying query or code snippets.
You can start with the shared document, update visualization type, query or change settings to fit your needs and store it as a new document.
Added search for visualization settings
The Dashboards Visual tab now has a search field for finding and tailoring your visualization settings.
Improved full-screen dashboard tile view
When you maximize a dashboard tile, you have easy access to important settings without leaving the maximized view:
- Timeframe selector: adjust the timeframe setting.
- Variables: access variables referenced in the selected tile.
- Segments: change the segment settings.
- Sharing: select Share to generate a shareable URL automatically copied to your clipboard. Use it to quickly share your full-screen view of the selected tile with other people in your Dynatrace environment.
- Edit: select Edit to open the edit panel for the selected tile. Use it to edit the tile while you view it.
- Tile state: icons indicate, for example, a warning or a custom timeframe.
For the complete release history, go to the app listing in the Dynatrace Hub: Dashboards, Notebooks.
You can discover the Dashboards and Notebooks apps in Dynatrace Playground.
Share your feedback in Dynatrace Community.
 Distributed Tracing
Feature update
Customize request names with additional attributes
Every attribute listed in the classic trace view (tab “Summary”, section “OneAgent attributes”) can be used in “Request Naming” rules.
Feature update
Span events from additional technologies are persisted in Grail
You can now capture span events on your serverless functions and view them in Grail. This includes, for example, exceptions or custom span events.
For the complete release history, go to the app listing in the Dynatrace Hub.
You can discover the Distributed Tracing app in Dynatrace Playground.
Share your feedback in Dynatrace Community.
 Infrastructure & Operations
Feature update
Streamline monitoring and remediation with the newly introduced Network devices section
The device lists include network devices available in the environment, provided the current version of the extension is installed.
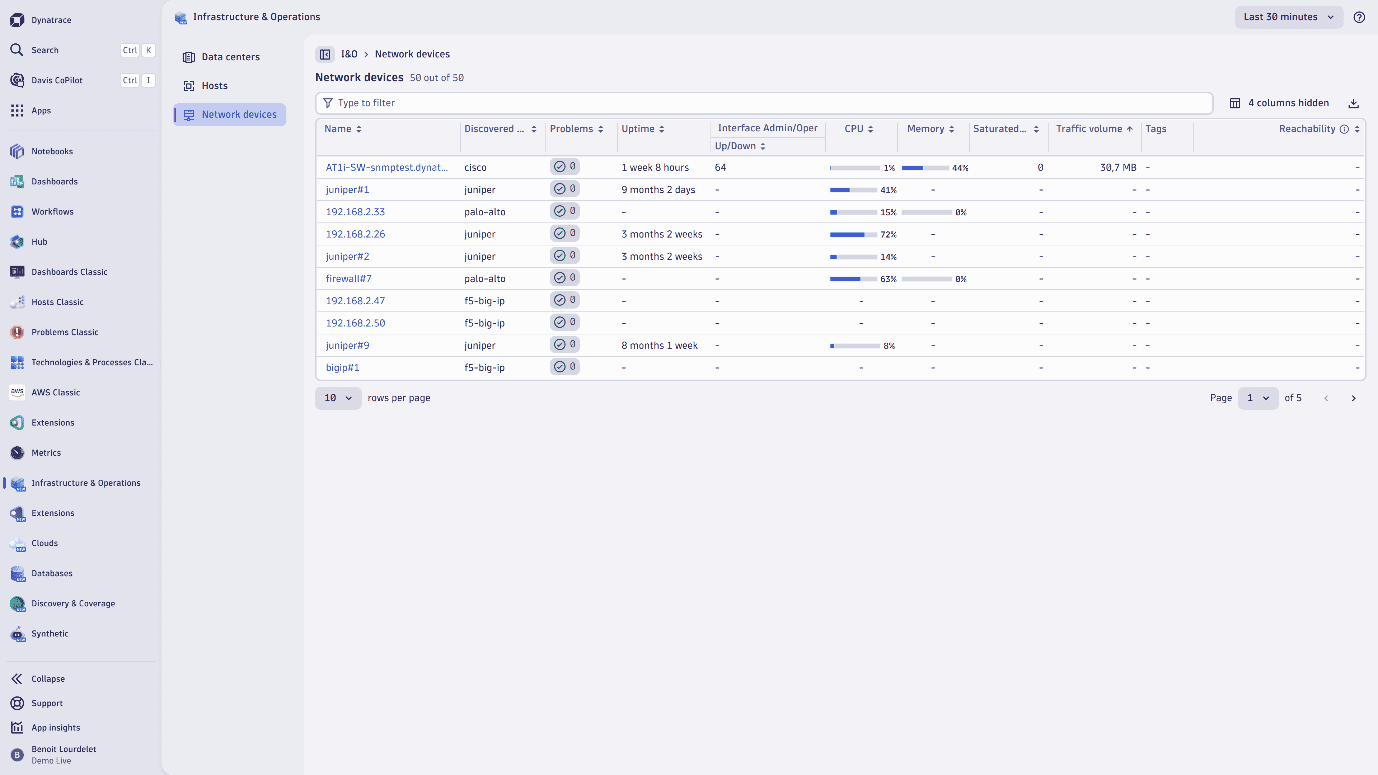
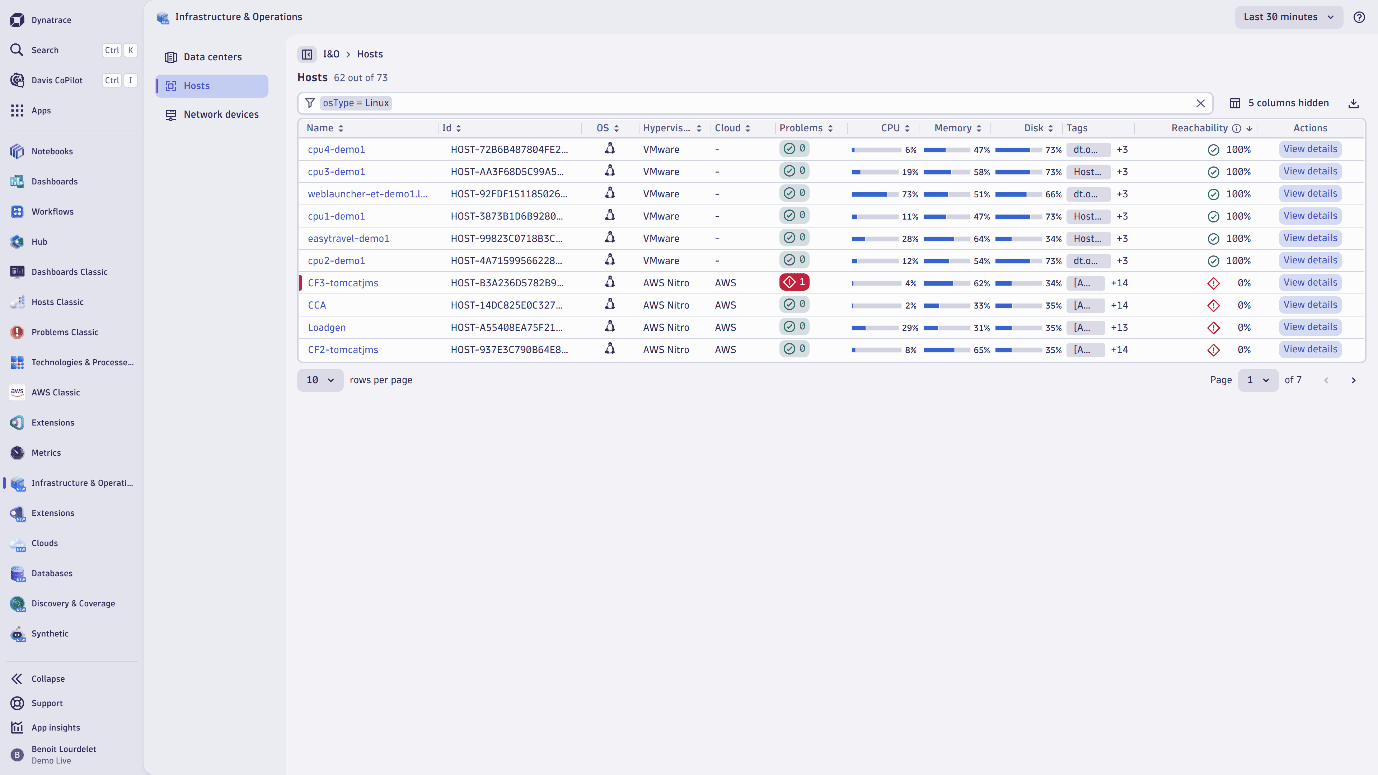
A reachability column is included in Network devices and Hosts view. Relying on Network Availability monitors, this measure provides information on how easily the host or device can be accessed over the network from remote locations.
Feature update
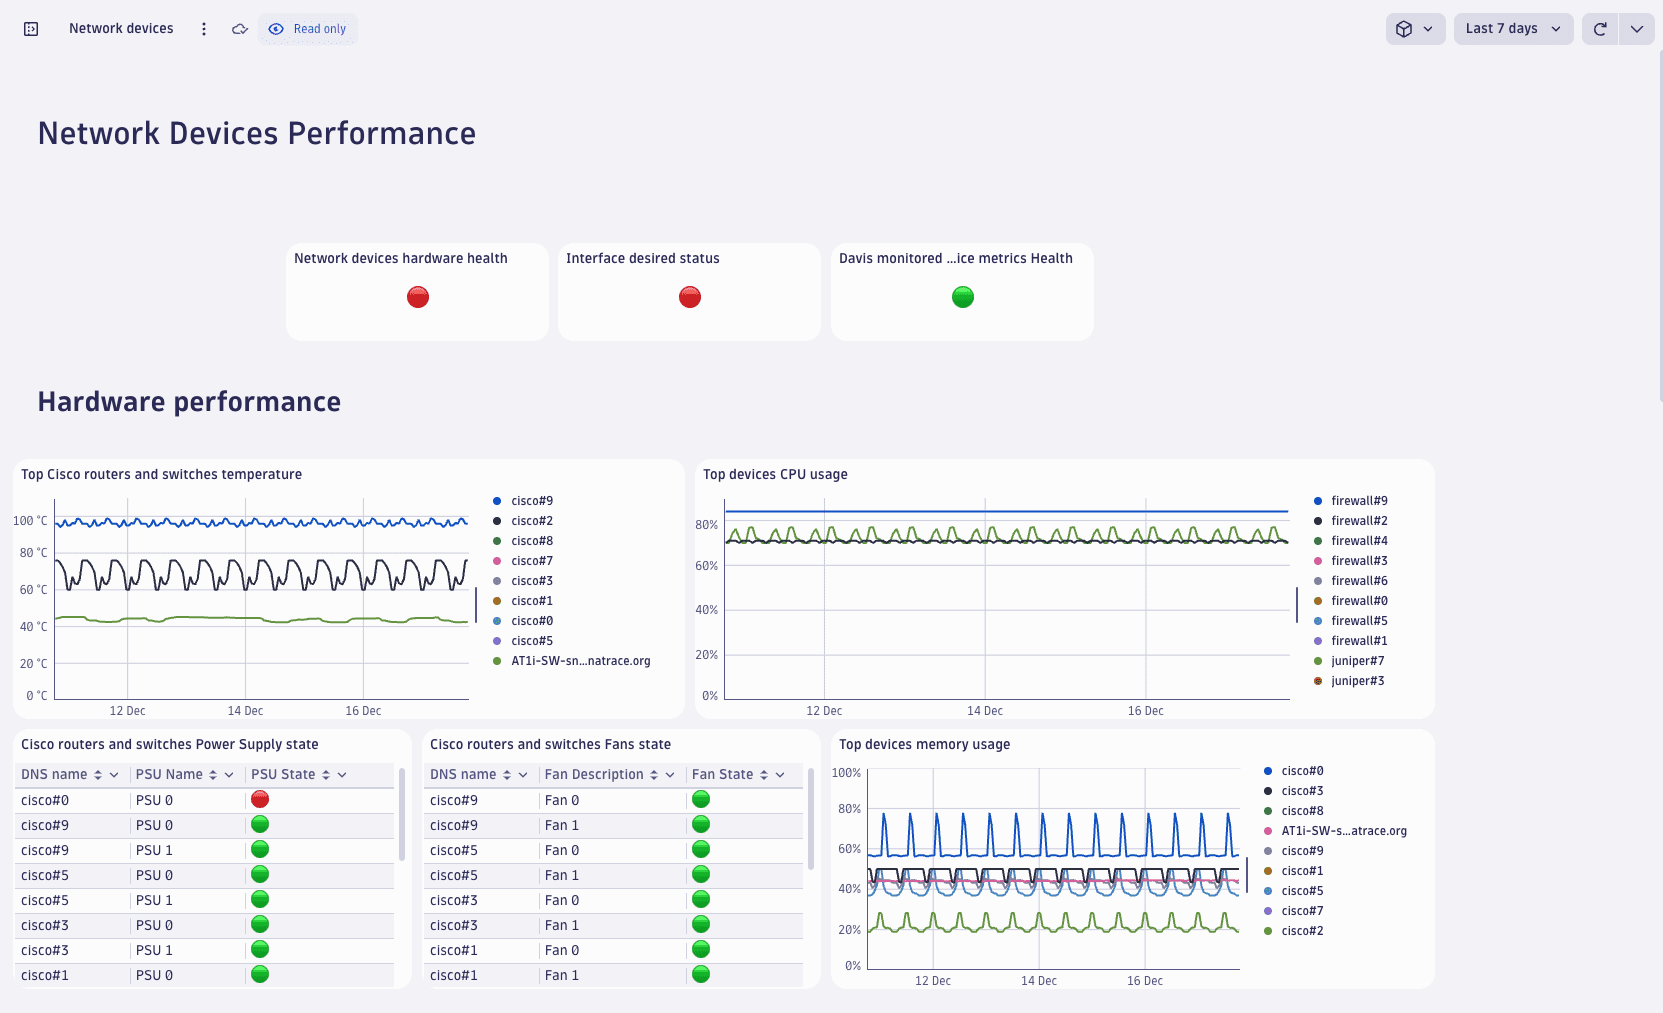
New ready-made dashboards: AWS Network Flows Analytics and Network Devices
To address your Network Operations Center and support team’s needs, two new ready-made-dashboards are rolled out: AWS Network Flows Analytics and Network Devices.
For the complete release history, go to the app listing in the Dynatrace Hub.
You can discover the Infrastructure & Operations app in Dynatrace Playground.
Share your feedback in Dynatrace Community.
 Investigations
Feature update
Enhance productivity with case upload/download and with faster access to your findings
With improved case management features, you can now download and upload the cases to
-
Continue started investigations in another environment
-
Safeguard your cases by backing them up or archiving them to a different system
-
Share interesting cases with others in the Dynatrace community
To streamline investigations, you can work with your findings more efficiently by clicking on evidence to copy it directly from your Evidence list. You can use the copied evidence in DQL queries, or case reports directly and fast.
For the complete release history, go to the app listing in the Dynatrace Hub.
Discover the  Investigations app in Dynatrace Playground.
Share your feedback in Dynatrace Community.
 Kubernetes
Feature update
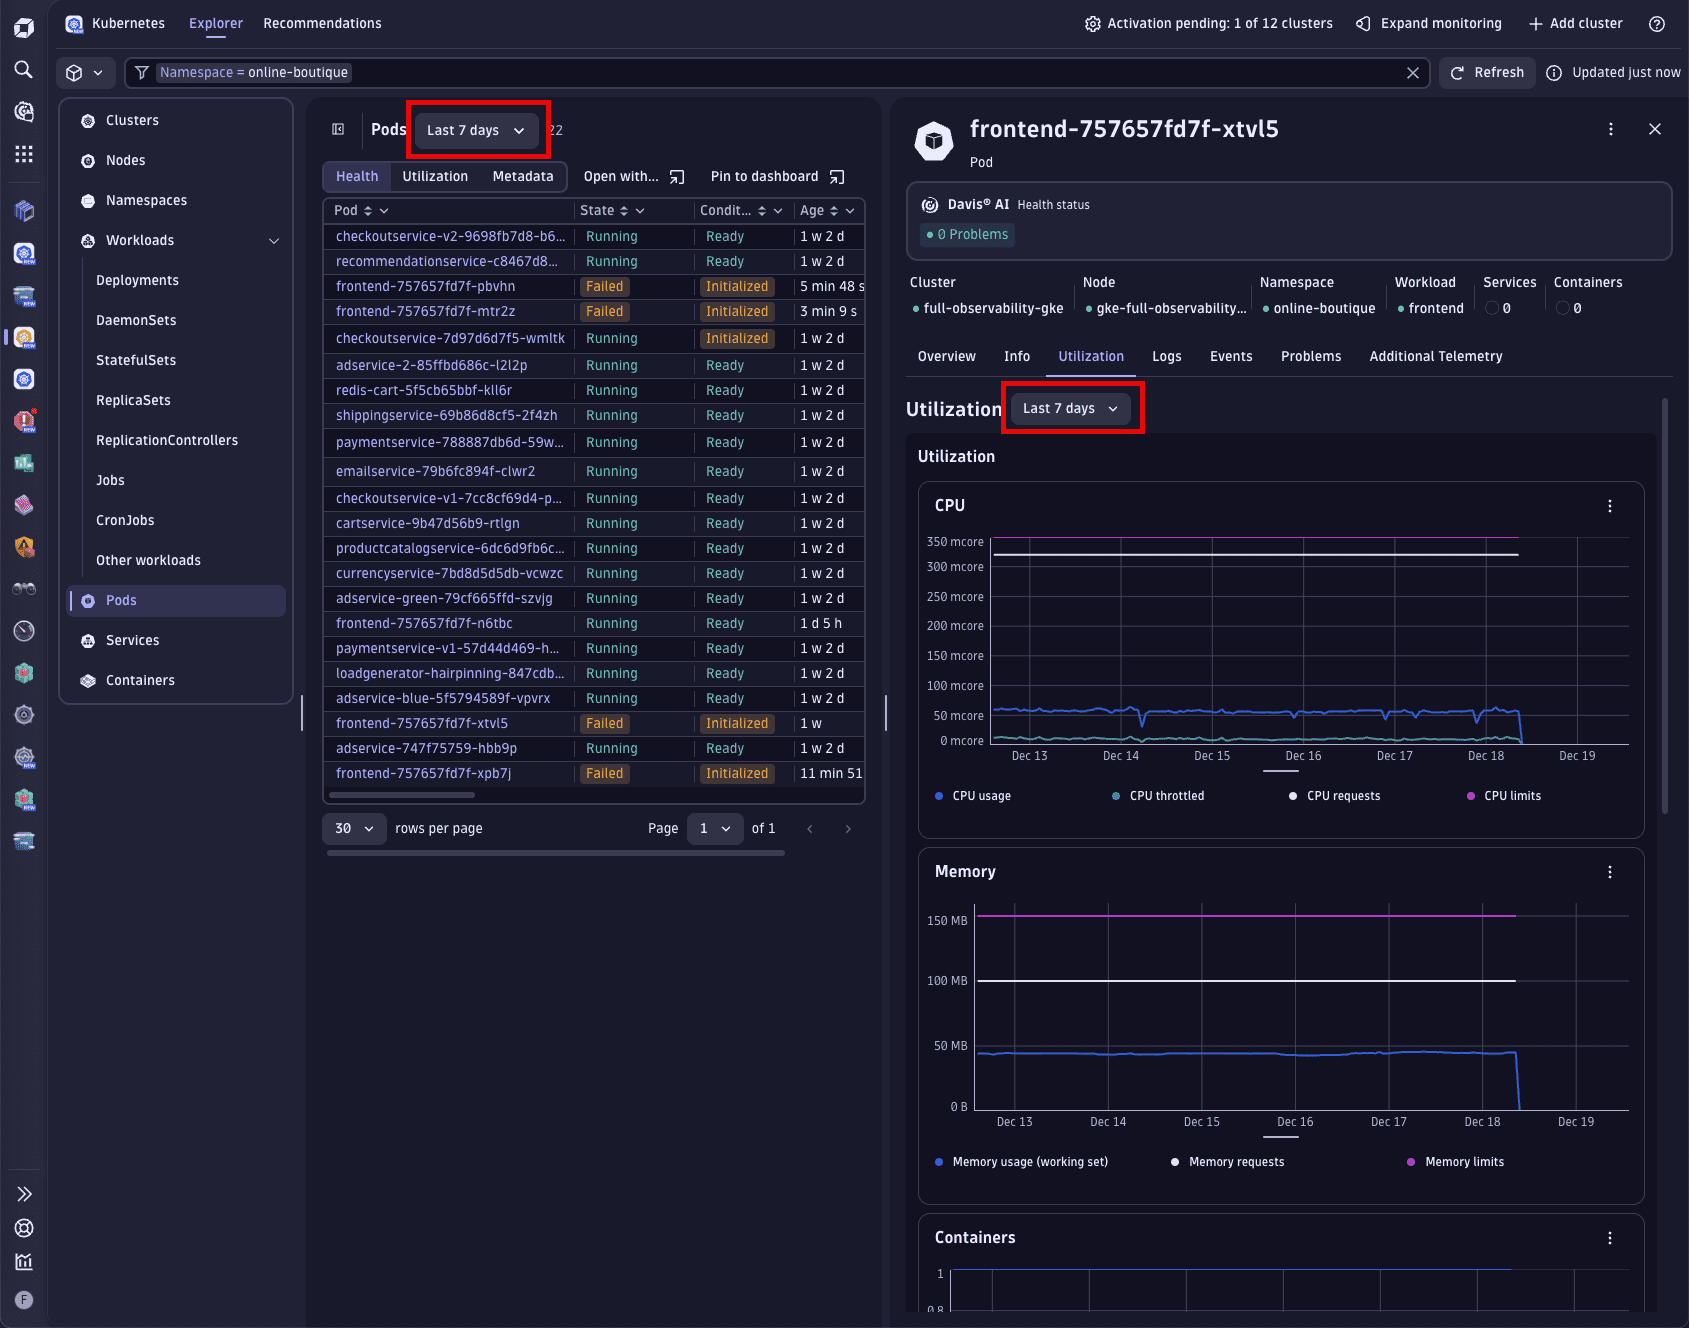
Flexible data selection with the new timeframe selector
Introducing the highly requested timeframe selector for the Kubernetes app. Go back in time and perform post-mortems using the new timeframe selector within the Kubernetes app.
For the complete release history, go to the app listing in the Dynatrace Hub.
You can discover the  Investigations app in Dynatrace Playground.
Share your feedback in Dynatrace Community.
Dynatrace API
To learn about changes to the Dynatrace API in this release, see Dynatrace API changelog version 1.306.