What's new in Dynatrace SaaS version 1.311
- Release notes
- 10-min read
- Rollout start on Mar 25, 2025
This page showcases new features, changes, and bug fixes in Dynatrace SaaS version 1.311.
To learn about new Dynatrace Apps and feature updates with this release, select an item from the table below.
| Category | Updates in this release |
|---|---|
| Across platform | 5 (1 Breaking change) |
| Log monitoring | 1 |
 Dashboards and Dashboards and  Notebooks Notebooks | 5 (1 Breaking change) |
Across platform
Feature update  Developer Tooling
Live Debugger is now in GA
Live Debugger is available to Dynatrace SaaS customers using Full-Stack Monitoring.
The DPS rate card item Code Monitoring must be included in your Dynatrace Platform Subscription (DPS). It will be available for addition starting April 8, 2025. Please contact your sales representative for more information.
Dynatrace Live Debugger has been released to General Availability (GA), providing instant access to code-level debugging data without additional coding or redeployments.
Key capabilities:
- Capture real-time debug snapshots with a single click
- Use non-breaking breakpoints that don't interrupt running code
- Debug across any environment from dev to production
- View integrated snapshots, logs, and traces
Supported runtimes:
- Java
- NodeJS
To learn more, see Live Debugger.
Feature update OpenPipeline
Support for dropping records and fields in OpenPipeline for spans
You can now process span records in  OpenPipeline. The following options are now available:
- Drop record processor: remove complete records based on matching criteria. Dropped records are not considered further in processing and extraction.
- Remove fields processor: remove fields on ingested span records. This takes advantage of use cases such as removing sensitive data before it's stored.
Feature update Digital Experience | Session Replay
Full Session Replay Mobile
Session Replay Mobile lets you capture and watch all sessions from monitored mobile applications (native iOS and Android, and SwiftUI support included). It creates anonymized, video-like recordings of users' interactions with mobile apps. You can watch their taps to identify what they're trying to do, where they're having trouble, and what's frustrating them. You'll be able to fix bugs and make improvements that increase overall user satisfaction.
Session Replay for all mobile sessions (not only those with crashes) is now available for a significant group of Dynatrace SaaS environments.
For more information, see:
Feature update Platform | Launchpads
Add a custom icon to your launchpad
Upload a custom icon to your launchpad to make it stand out and immediately appeal to its users. Launchpads support square icons in common image file formats to be uploaded.
For details, see Add a launchpad icon.
Upcoming change Platform
IP address changes of OneAgents and ActiveGates connecting to Dynatrace SaaS
In March 2025, Dynatrace will change the underlying IP addresses that ActiveGates and OneAgents use when connecting to Dynatrace SaaS on AWS. This will result in a change of frontend IP addresses.
- This change will be completely transparent and won't require immediate action.
- Later this year, however, action may be required, depending on your deployment.
For more information, see IP address changes of OneAgents and ActiveGates connecting to Dynatrace SaaS.
Platform bug fixes, patches, and maintenance
Resolved issues in this release
- Calculated service metrics page: Unsupported units are no longer displayed in the "Unit" selection list. (APPOBS-5161)
Log monitoring
Feature update Infrastructure Observability | Log monitoring
Updated log ingestion limits
- Log analytics: Enhanced log ingestion characteristics with improved support for log records containing large payload sizes.
- All log settings: Updated log ingestion limits to reflect new thresholds and capabilities.
See Log Management and Analytics default limits and Log Monitoring default limits (Logs Classic) for detailed information.
Dashboards and Notebooks
Note: to check your app version, open the menu in the upper-right corner of the app and select What's new.
Breaking change Dashboards
Scopes removed from Dashboards
Dashboards version 1.311+
The following scopes are removed from the Dashboards app:
environment-api:deployment:download: For reading deployment configuration in code tiles, refer to the ActiveGate, Cluster Config, or OneAgent APIs.davis-copilot:conversations:execute: Refer to the CoPilot chat available outside the app for general questions. Existing functionality to generate dashboard tiles with Davis CoPilot is not affected by this change.slo:objective-templates:read: Refer to the SLO app for managing any SLO configuration.app-settings:objects:read: Internal scope, no workaround needed.
Please update your code tiles accordingly. If you use code in your dashboards that relies on any of these scopes, this is a potential breaking change.
Feature update
Moved chart toolbar for Line, Area, Bar, and Band charts
Dashboards version 1.311+ Notebooks version 1.311+
By default, the chart toolbar for Line, Area, Bar, and Band charts is now the lower-right corner and is collapsed.
Feature update
Logarithmic scale for your Categorical bar chart axes
Dashboards version 1.311+ Notebooks version 1.311+
Now, you can use a logarithmic scale for your axes in the Categorical bar chart.
This can be on the x-axis or y-axis, depending on the orientation of the chart.
Feature update
All data fields available in "Displayed fields" for graph charts
Dashboards version 1.311+ Notebooks version 1.311+
You can now select all fields in the data mapping for any graph chart. (Before, we were limited to certain fields.)
Feature update
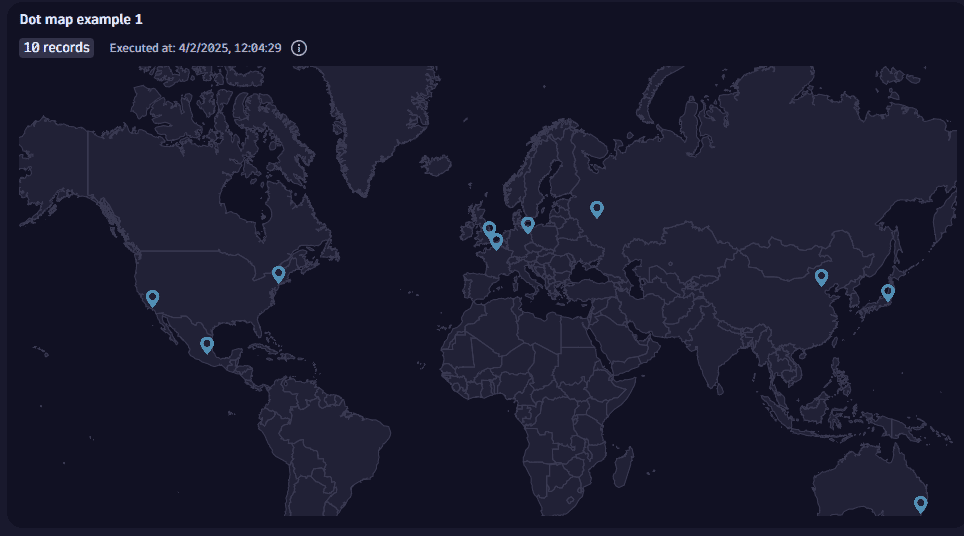
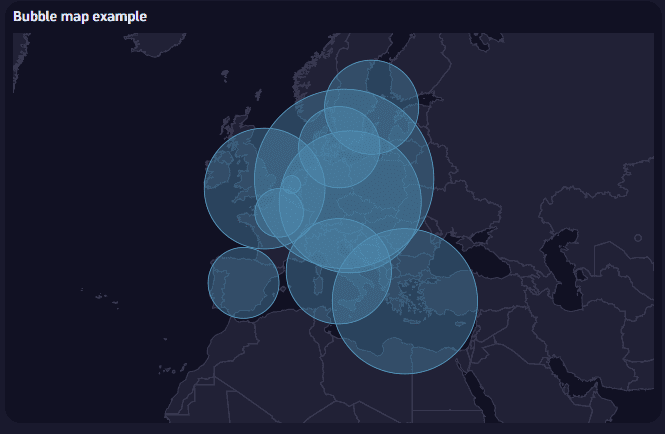
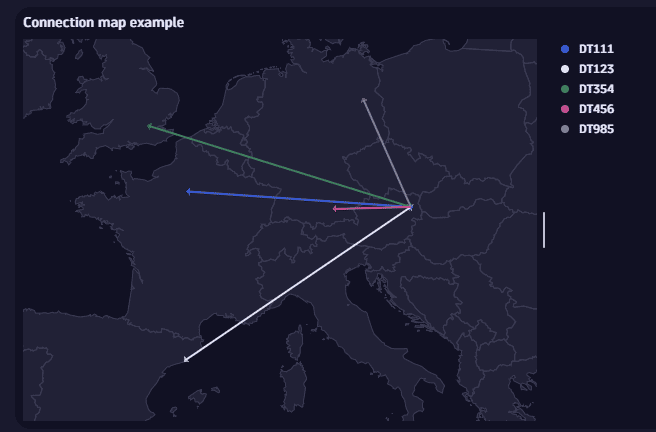
Visualize and analyze geographical data with four world map visualizations
Dashboards version 1.311+ Notebooks version 1.311+
New world maps have been added to the current visualizations.
For details, see Choropleth.

Dynatrace API
To learn about changes to the Dynatrace API in this release, see Dynatrace API changelog version 1.311.