View DPS consumption with ready-made usage dashboards
- Latest Dynatrace
- Explanation
- 6-min read
With Dynatrace ready-made dashboards, you can get an overview of your DPS consumption, identify consumption spikes, and see what's driving that consumption—all in one place. An overview dashboard lets you see your consumption across all DPS categories, while drill-down dashboards give extended insights into specific capabilities.
You can then use this information to optimize your consumption and work through a specific spike end to end.
Prerequisites
- The usage dashboards are ready-made dashboards: They ship with Dynatrace and can be used out-of-the-box for all environments on Latest Dynatrace. To get the dashboards, open Dynatrace and go to
 Dashboards > Ready-made and search for the dashboard by name.
 - The presented data is taken from
dt.system.*, and includes billing usage events and query execution events. To see this information, your Dynatrace user needs thestorage:system:readpermission to see system events. For more information, see Identity and access management (IAM) and Data access.
Overview
Dynatrace provides a Usage - Overview dashboard with information about all your DPS capabilities, and additional drill-down dashboards for high-volume capabilities such as traces, logs, and Full-Stack Monitoring. These dashboards let you find the specific application, user, notebook, dashboard, or host that's responsible for driving consumption.
The dashboards show real-time usage estimates so you can investigate and optimize as consumption happens. For information about how consumption translates to your billed costs, see Overview (Dynatrace Platform Subscription).
Use cases
- Check current consumption against your annual commitment, and see which capabilities trend up.
- Identify the category, capability, or cost center responsible for a spike.
- Find the specific application, user, or query driving scan volume, and get suggested fixes.
- Spot Full-Stack hosts that could move to a lighter monitoring mode.
Usage dashboards
The usage dashboards are:
-
Usage - Overview: The entry point. It provides an overview of usage by rate-card capability and category, shows trends over time, and breaks down cost by cost center.
-
Usage - Traces, Usage - Logs, and Usage - Full-Stack: Drill-down dashboards for the highest-volume capabilities. These give you more detailed insights into consumption of ingest, retain, and query, the top drivers of this consumption, and suggest optimizations.
Usage - Overview dashboard
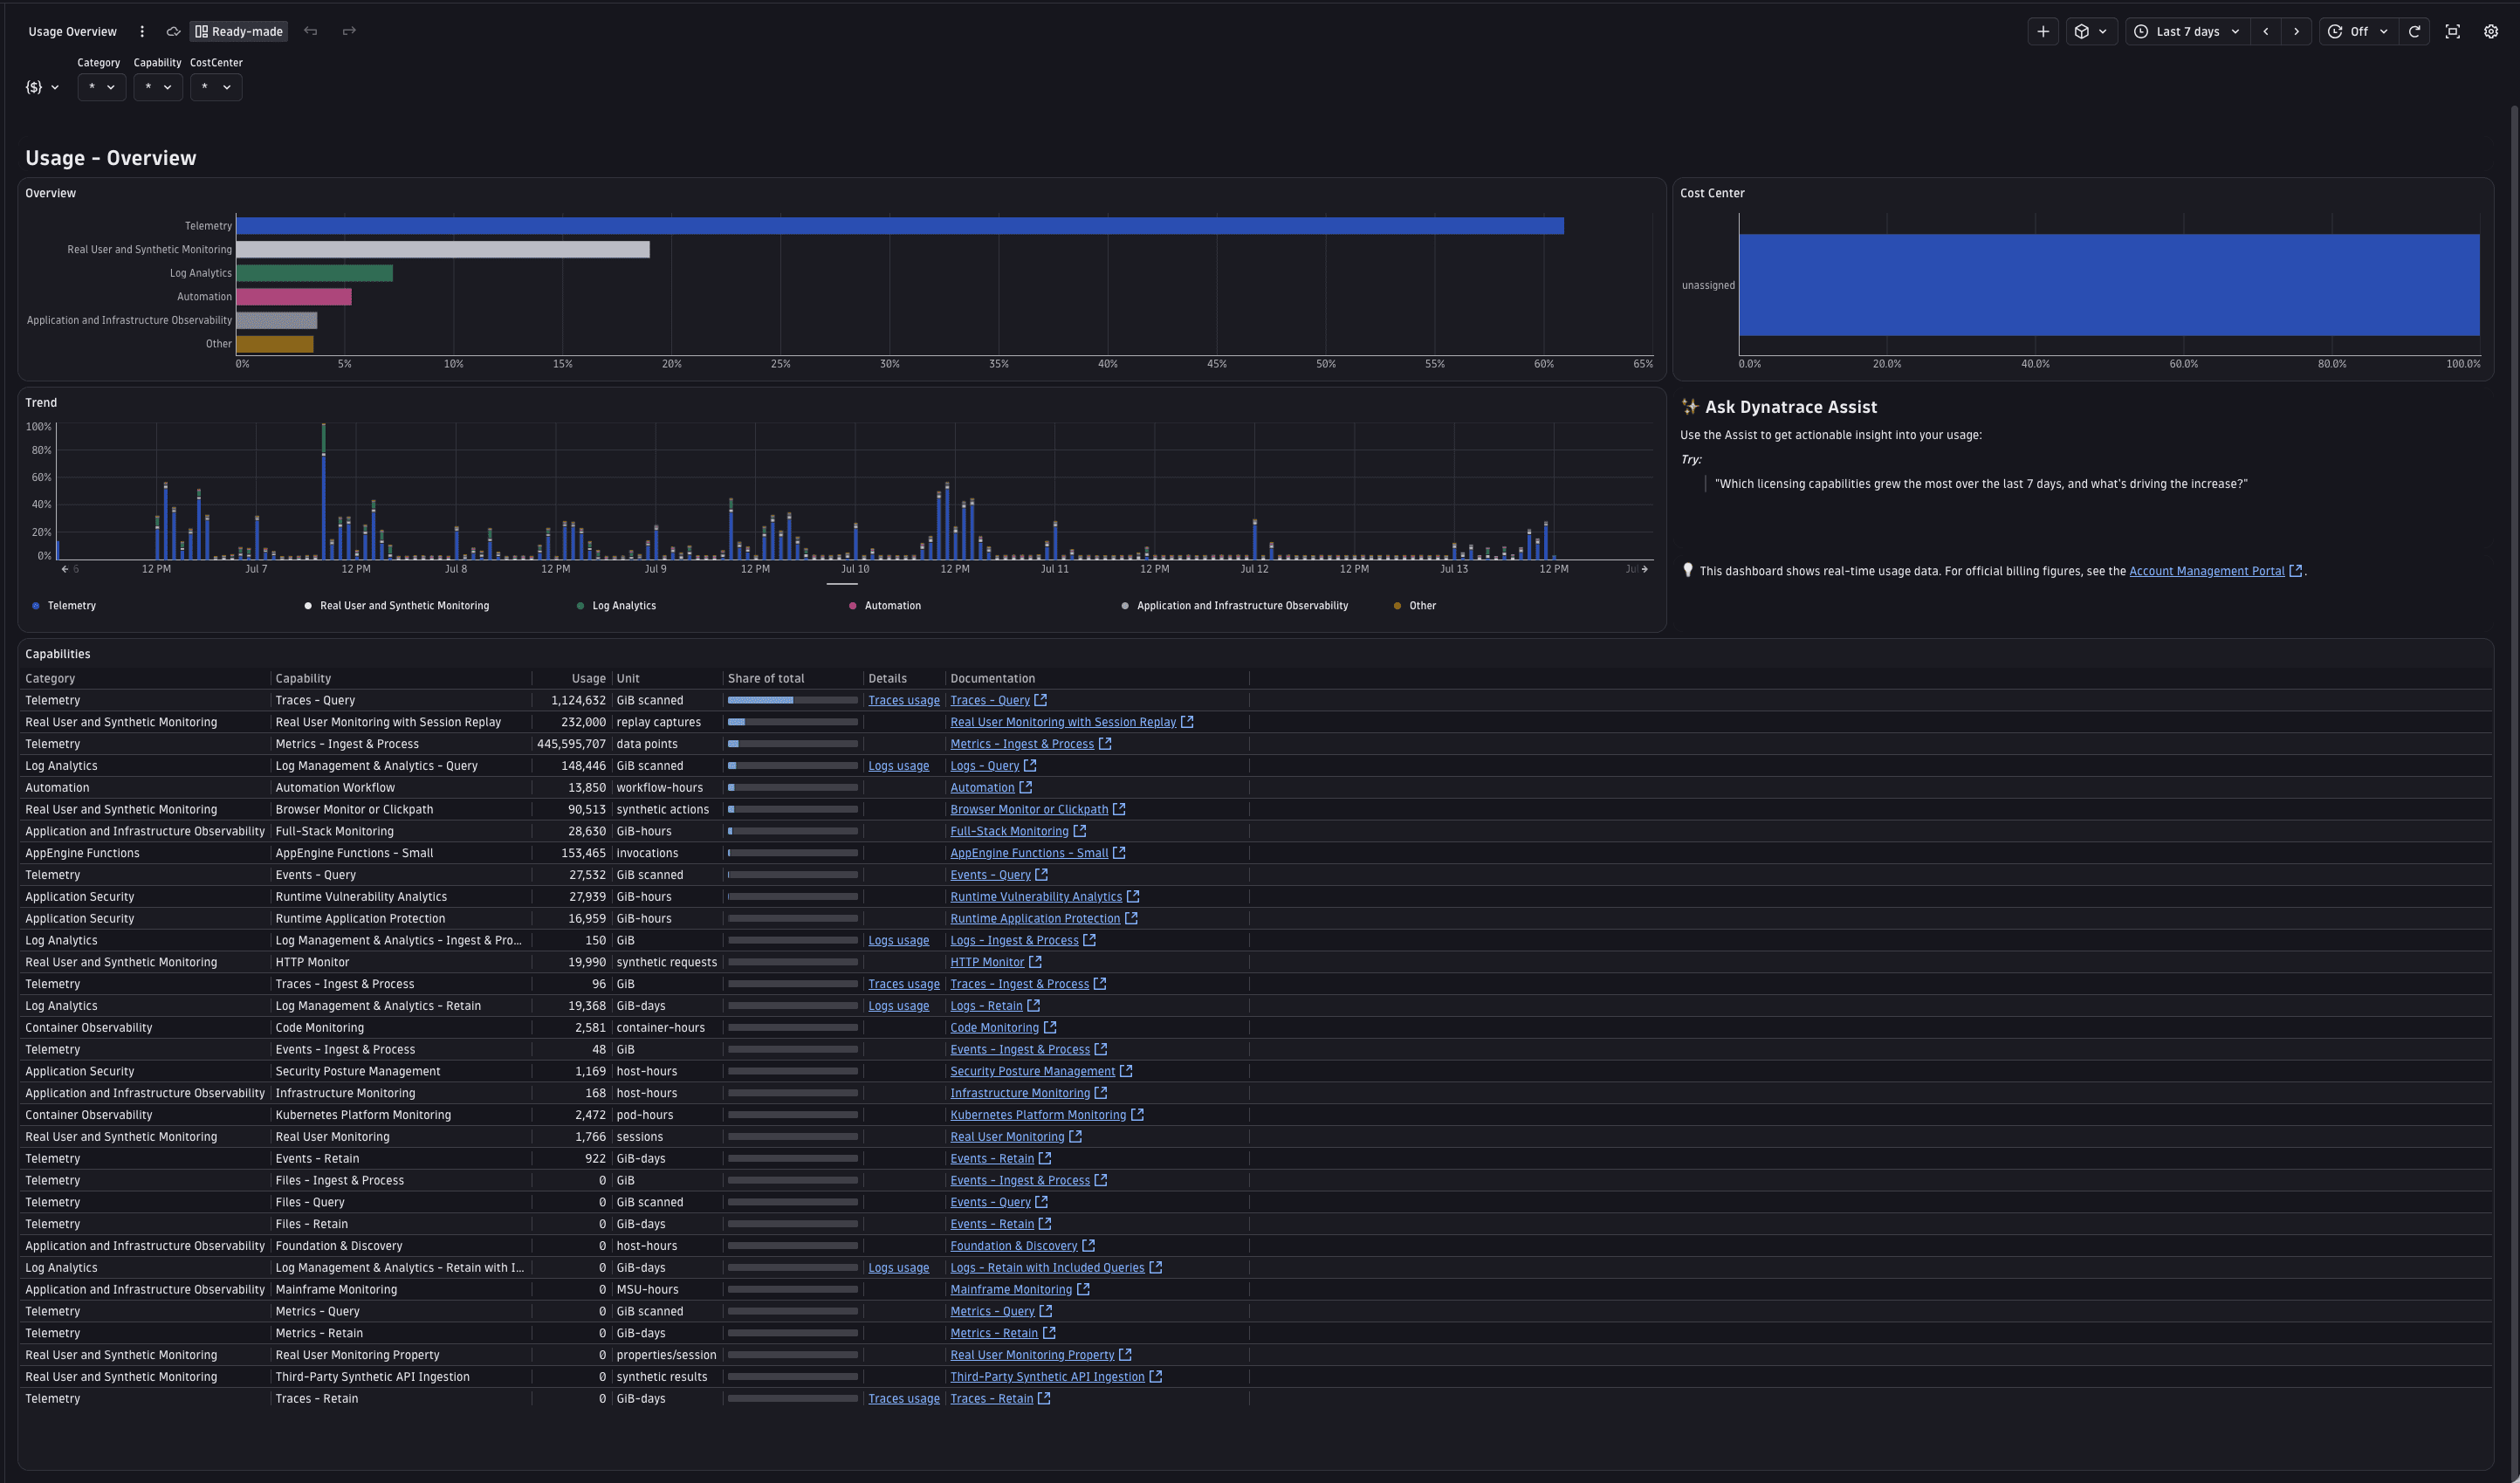
The Usage - Overview dashboard provides data in four ways: You can further filter the information by category, capability, cost center, and custom filters.
- Overview: Consumption ranked by category, shown as a percentage of total consumption. Use it to see, at a glance, which categories are driving the bulk of your consumption.
- Cost Center: Consumption broken down according to cost center. This uses the
dt.cost.costcenterattribute, and records without a cost center appear as unassigned. For information on attributing consumption to cost centers, see Set up Cost Allocation. - Trend: A stacked bar chart of category consumption over the selected timeframe. Use this to spot growth, spikes, and periodic patterns.
- Capabilities: A table of every metered capability with its Category, Usage, Unit, and Share of total. The Details column links to drill-down dashboards where relevant, and the Documentation column links to the capability's licensing documentation.
It also includes an Ask Dynatrace Assist panel with starter prompts to explore consumption in natural language. Open Dynatrace Assist and enter your question there. For more information, see Ask cost questions with Dynatrace Assist.
Usage - Traces
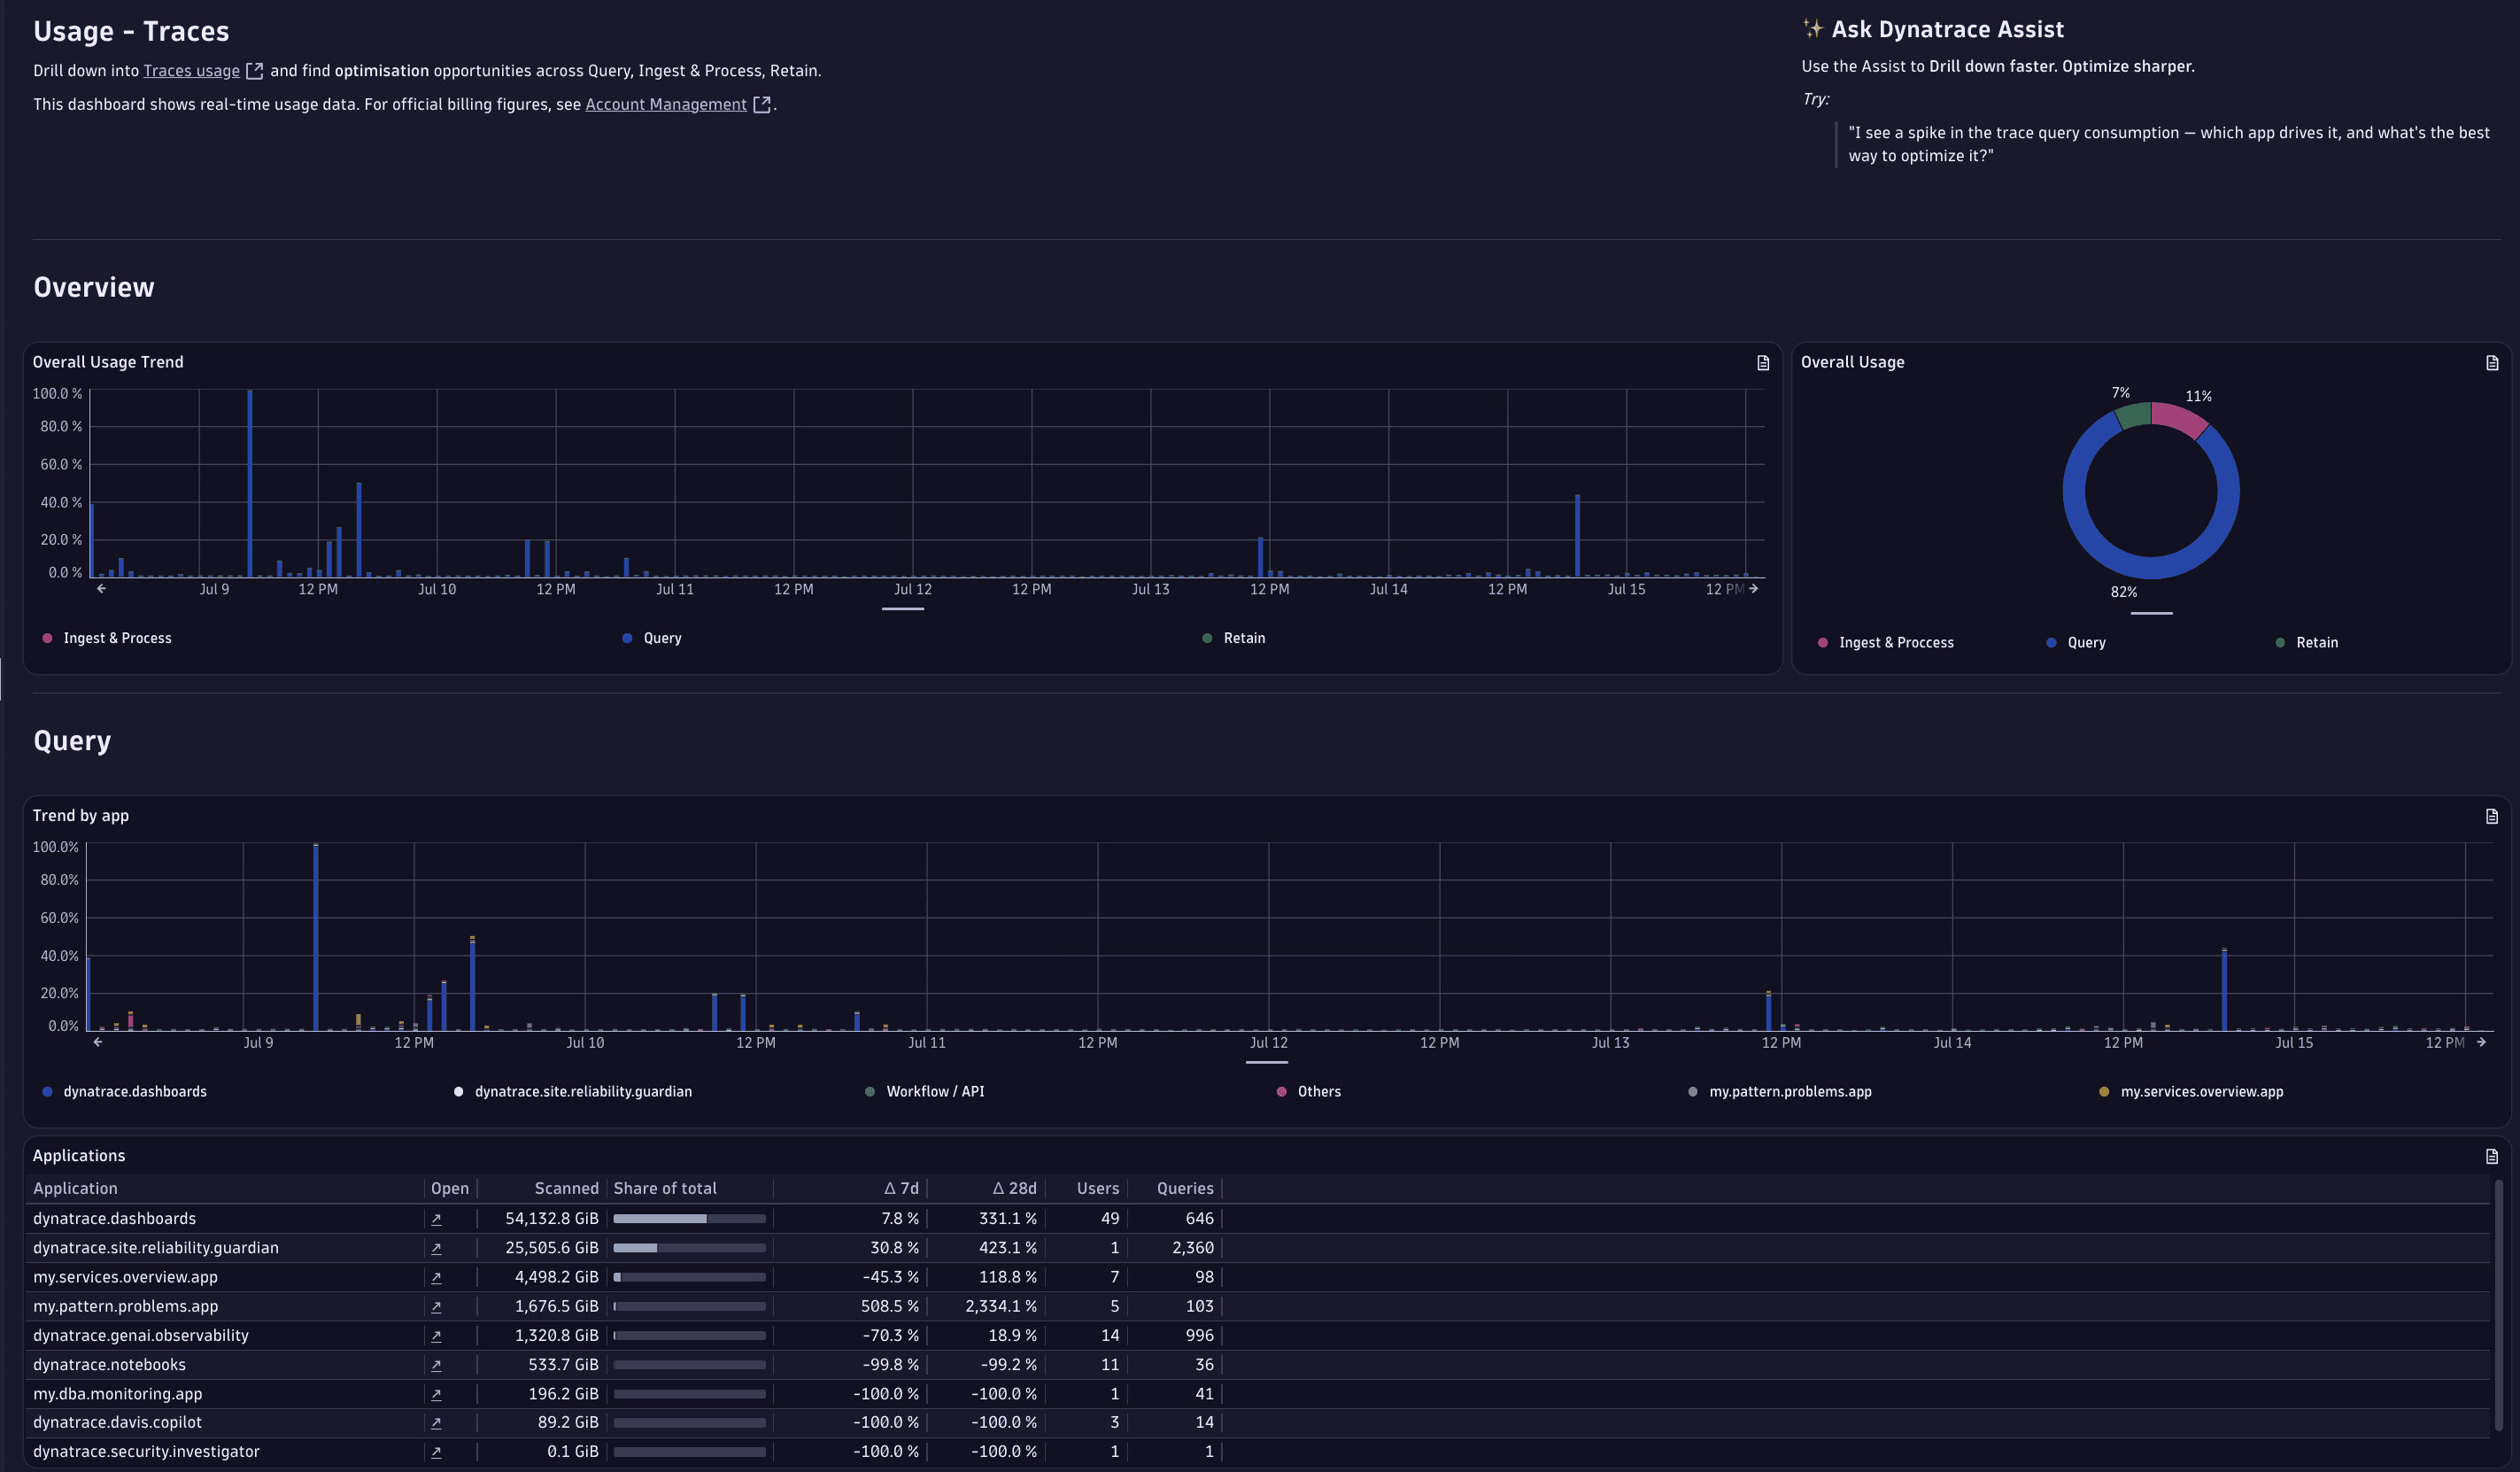
The Usage - Traces dashboard helps you to understand your Traces usage and find optimization opportunities. You can further filter the information by fields such as cost center, Dynatrace app, user, document ID (dashboard or notebook), and custom filters.
- Query: Billable query volume over time, both total volume as well as broken down by source, plus weekly query and active user counts. See the top applications by billable query volume.
- Dashboards and Notebooks with high usage: The top 25 documents by query volume, including usage change and trend. Use this to find frequently accessed dashboards and notebooks running expensive queries.
- Detailed query usage and optimization opportunities: Top 100 users by application and top 100 queries by billable volume. See specific queries that miss a DQL best practice and could be optimized to reduce scan volume.
- Storage overview: A per-bucket breakdown of included versus extended span retention.
Usage - Logs
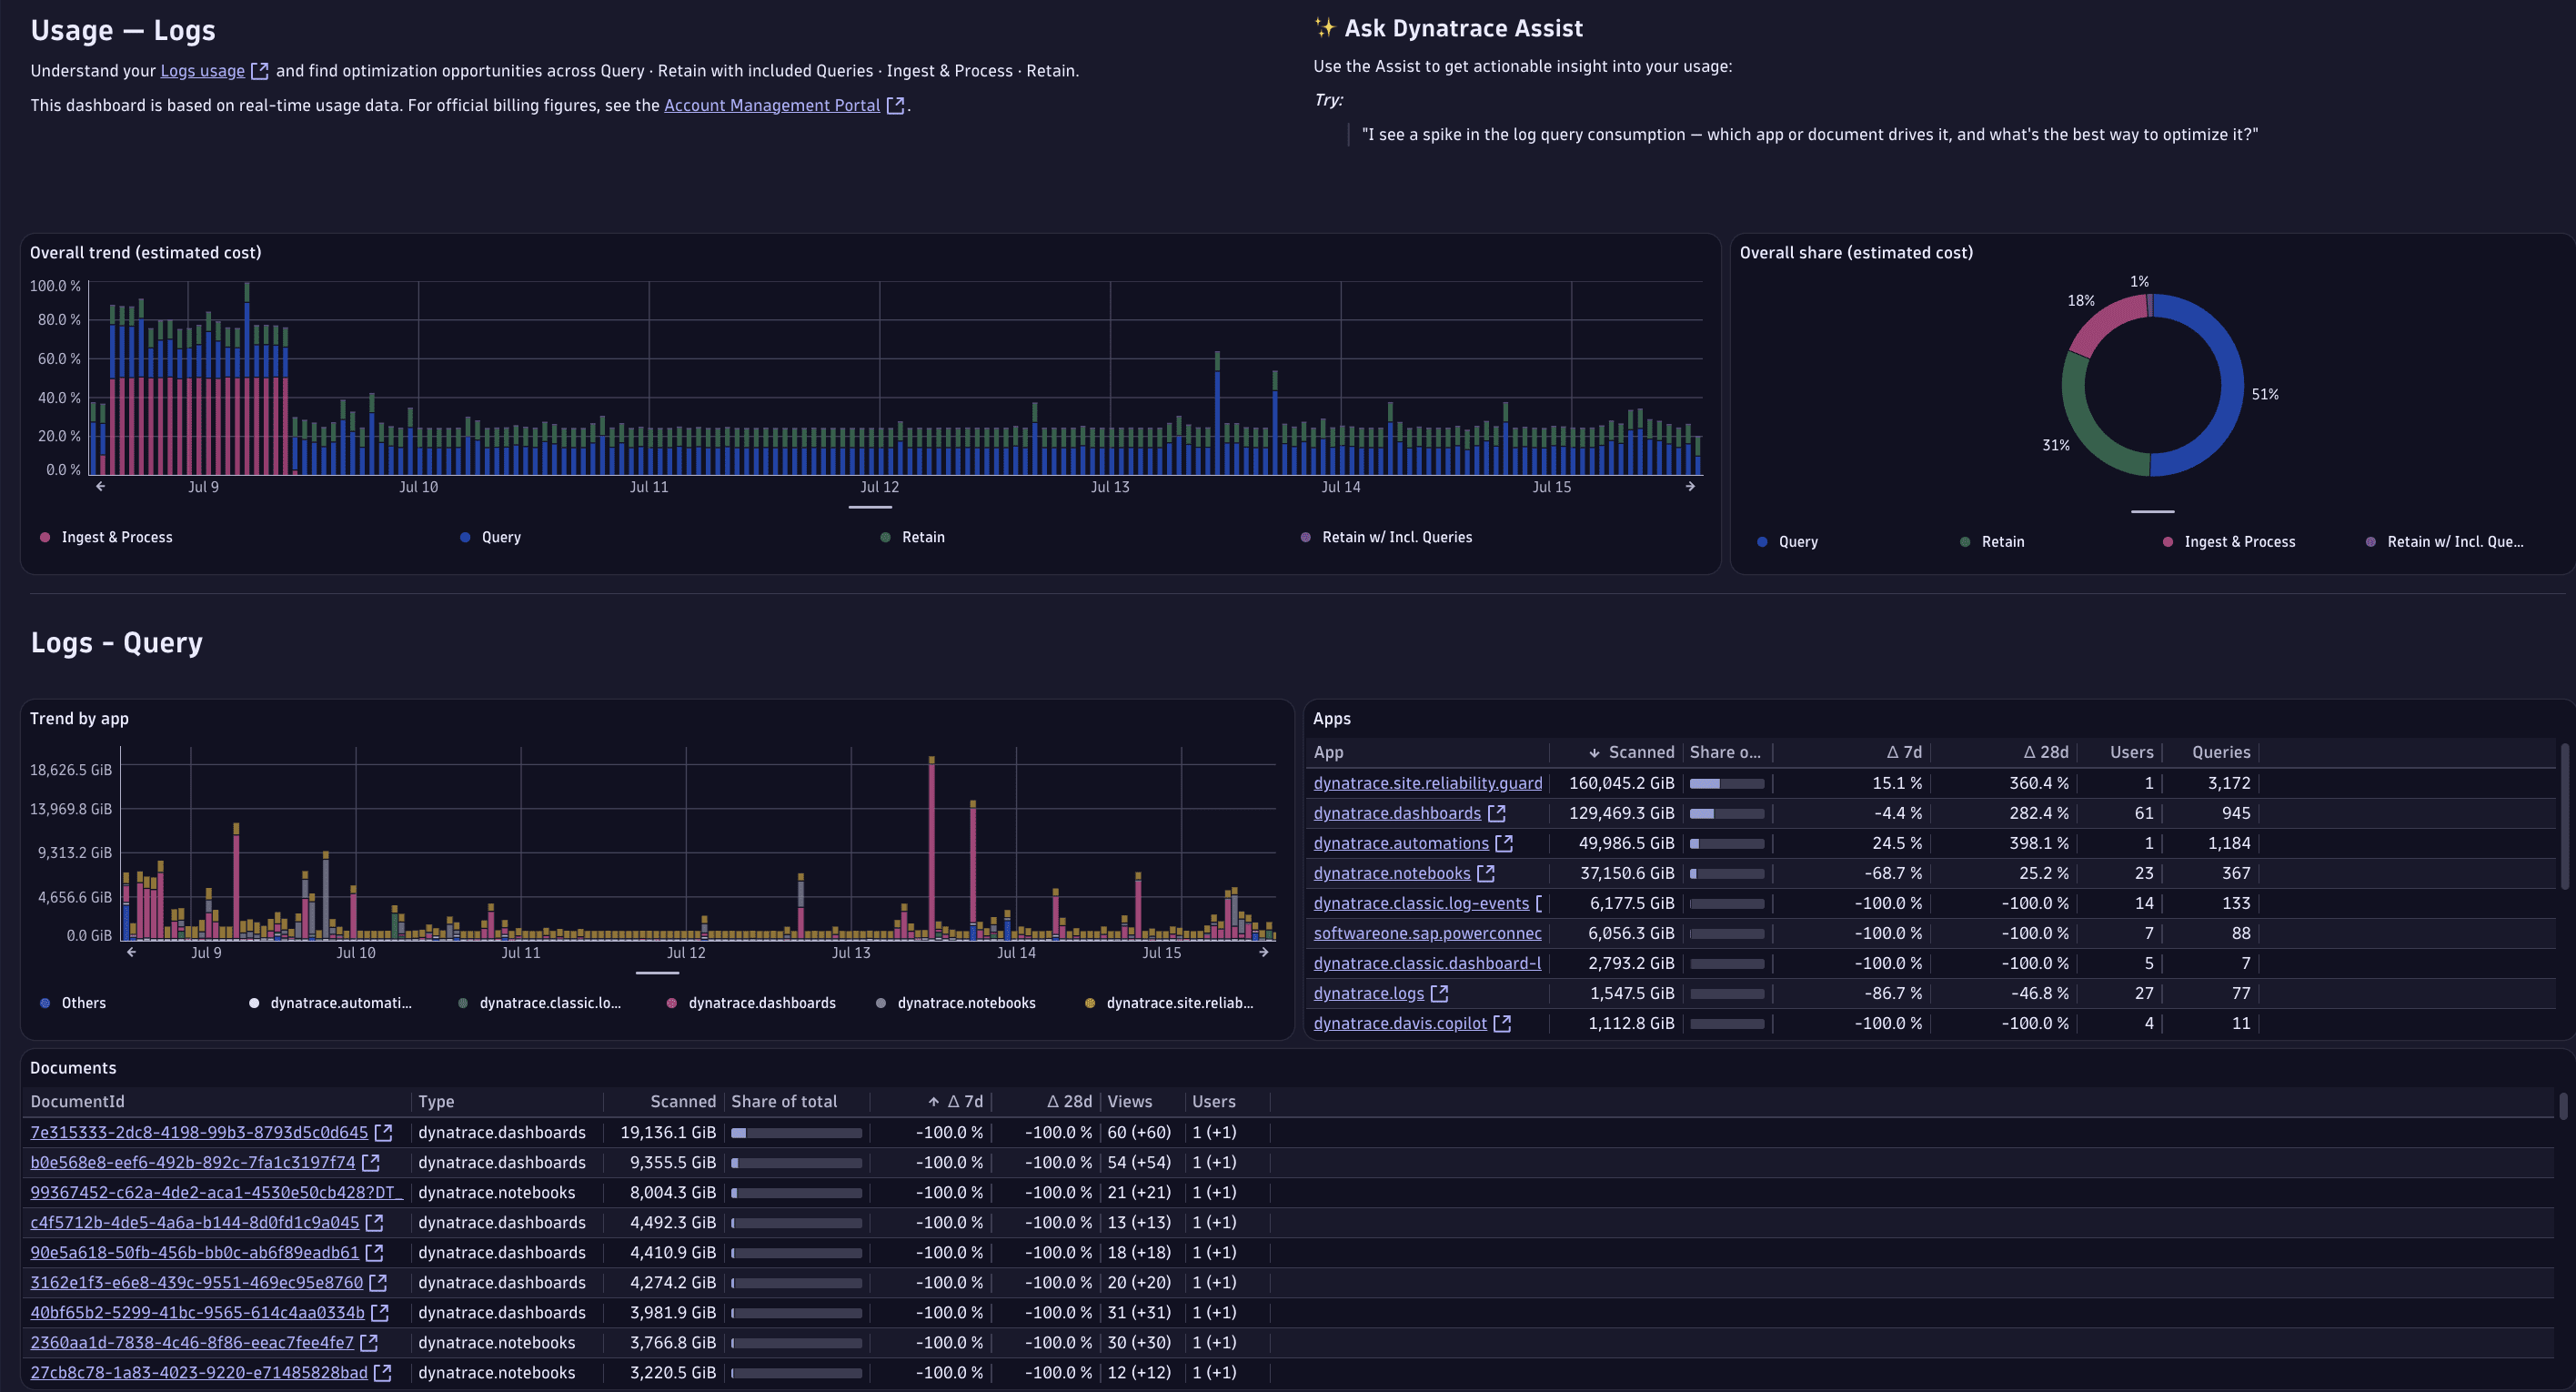
The Usage - Logs dashboard helps you to understand your Logs usage and find optimization opportunities. You can further filter the information by fields such as cost center, Dynatrace app, user, document ID (dashboard or notebook), and custom filters.
- Query: Billable query volume over time, both total volume as well as broken down by source, plus weekly query and active user counts. See the top applications by billable query volume.
- Dashboards and Notebooks with high usage: The top 25 documents by query volume, including usage change and trend.
- Detailed query usage and optimization opportunities: Top 100 users by application and top 100 queries by billable volume. See specific queries that miss a DQL best practice and could be optimized to reduce scan volume.
- Ingest and Retention overview: Daily ingest volume, total retention, and a per-bucket breakdown of log ingest and query usage across buckets.
- Included queries usage overview: Your weekly query multiple and scanned bytes against quota, to help you keep query costs predictable and within your fair usage policy. The query multiple is equal to the Aggregate scanned-GiB volume / Volume of log data that is retained within the Included Queries timeframe, see Understand your quota.
- Logs adoption by use cases: Usage breakdowns for Log Analytics, Logs in Context, and Logs on Dashboards, showing how users are querying logs across different Dynatrace apps.
Usage - Metrics
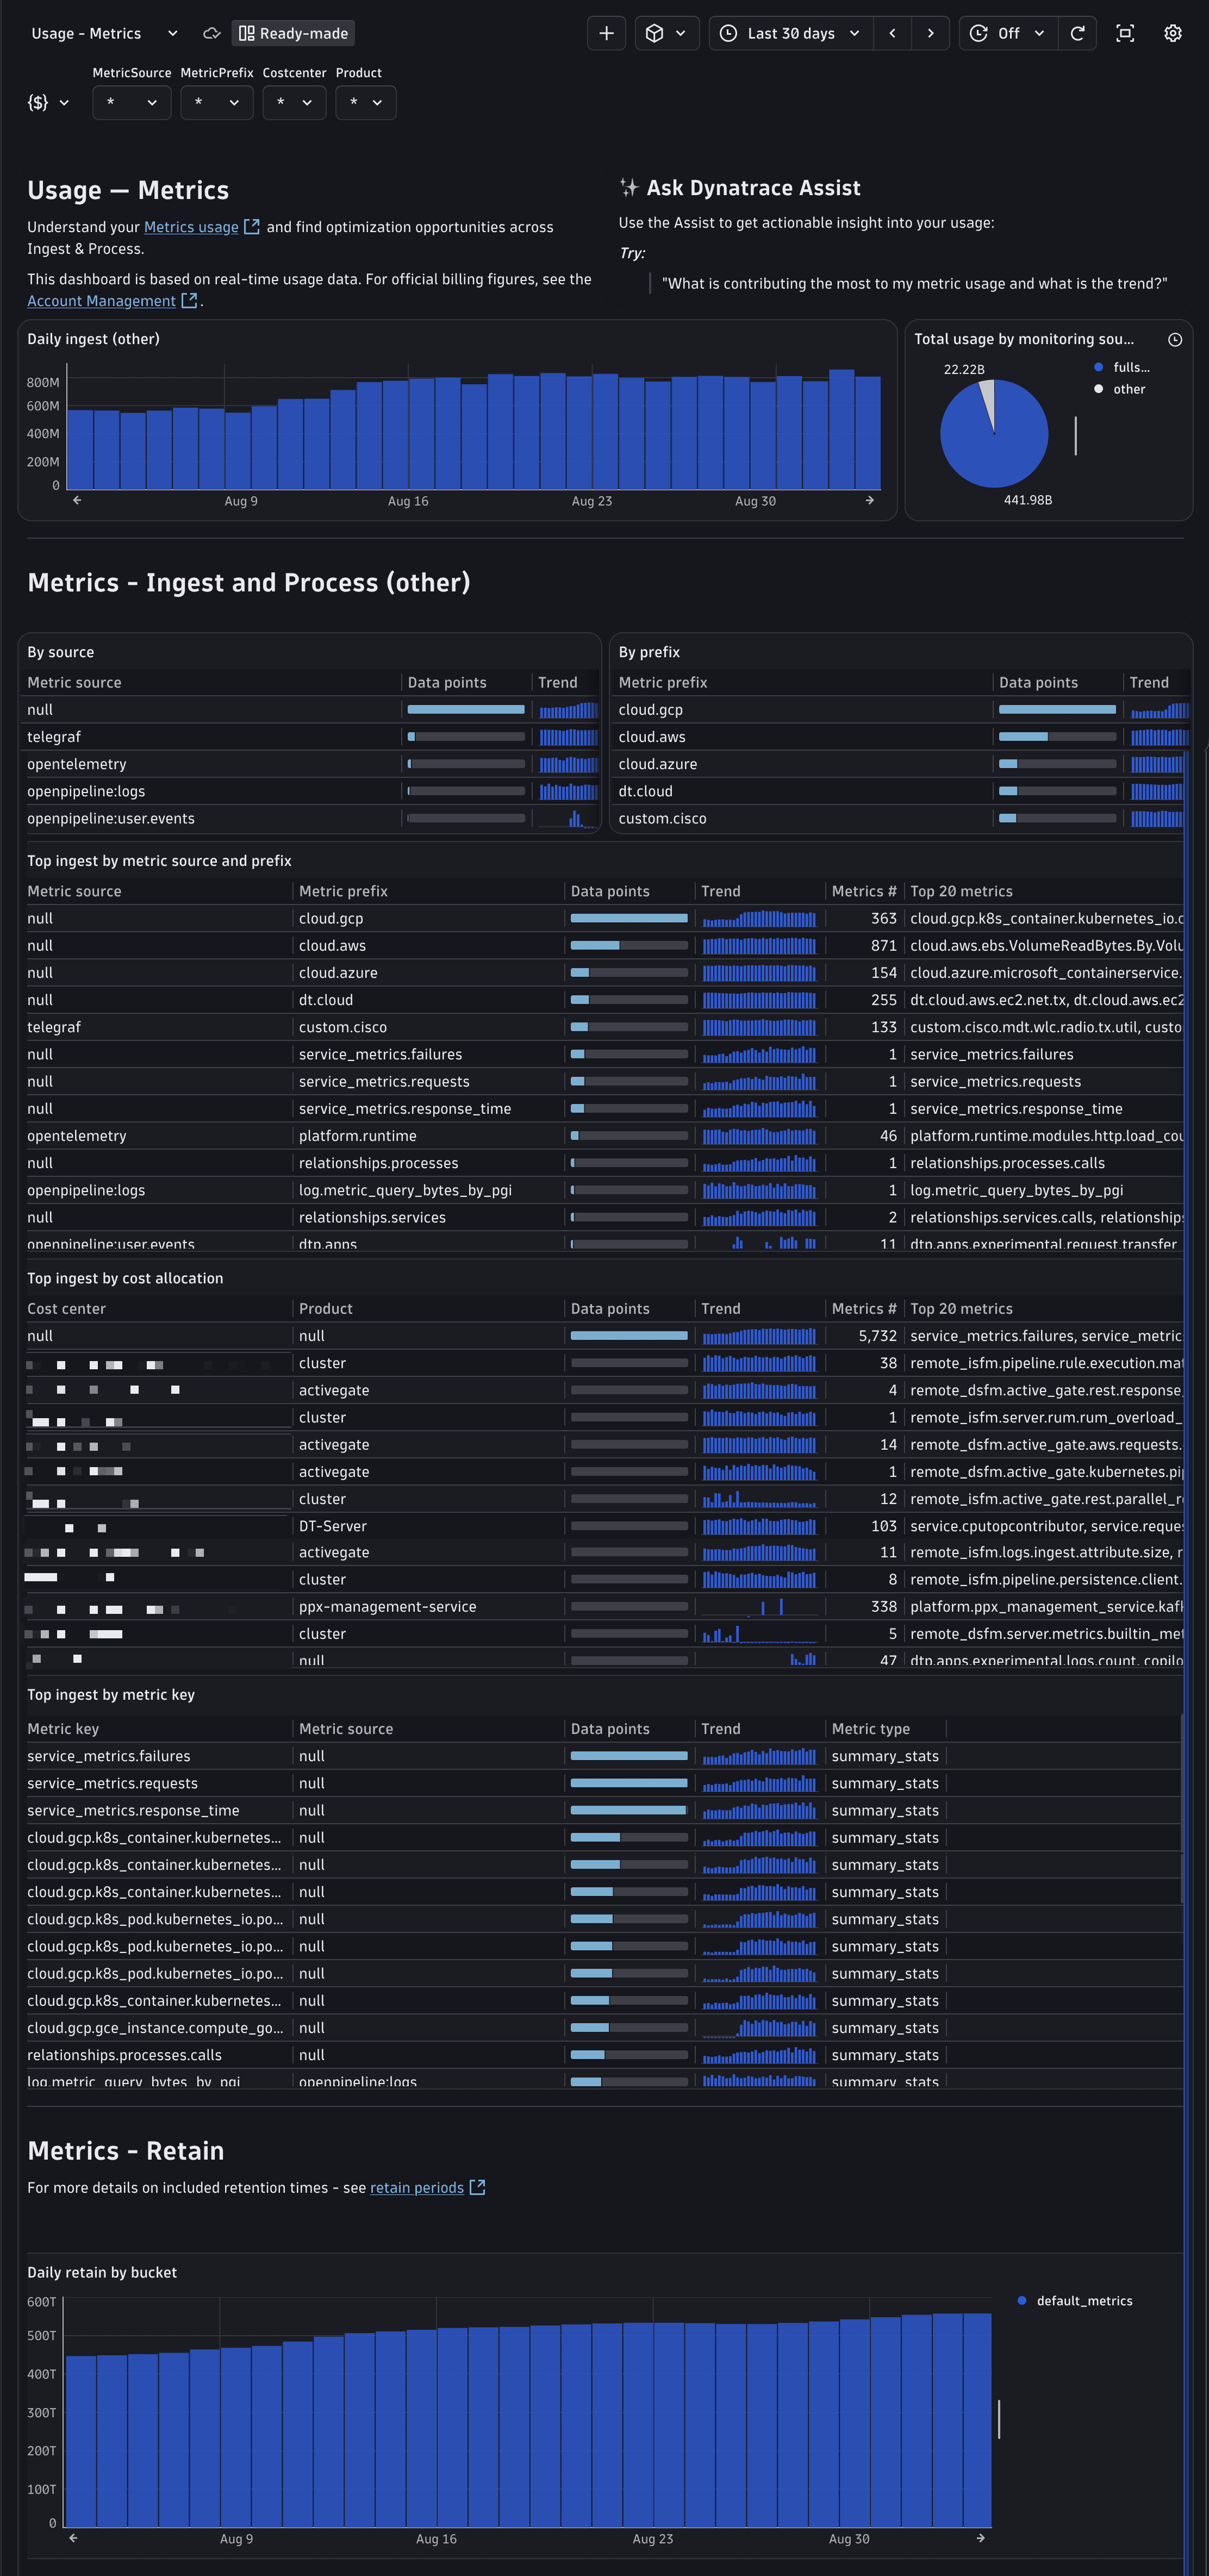
The Usage - Metrics dashboard helps you view, allocate, and predict your metrics usage across the platform. The dashboard provides you with a granular breakout of a metric by source, down to the metric prefix key.
This will help you better:
- Spot metrics ingest spikes. Identify sudden increases in ingest activity and dive into the source.
- Drill-down to see which metrics are driving your ingest and costs. View top metrics by source/prefix, or by the Cost Allocation cost center/product.
- Optimize your metrics cost by identifying unnecessary metrics for ingest, using the Dynatrace Assist along with the Best practices for optimizing metrics cost guide.
Usage - Full-Stack
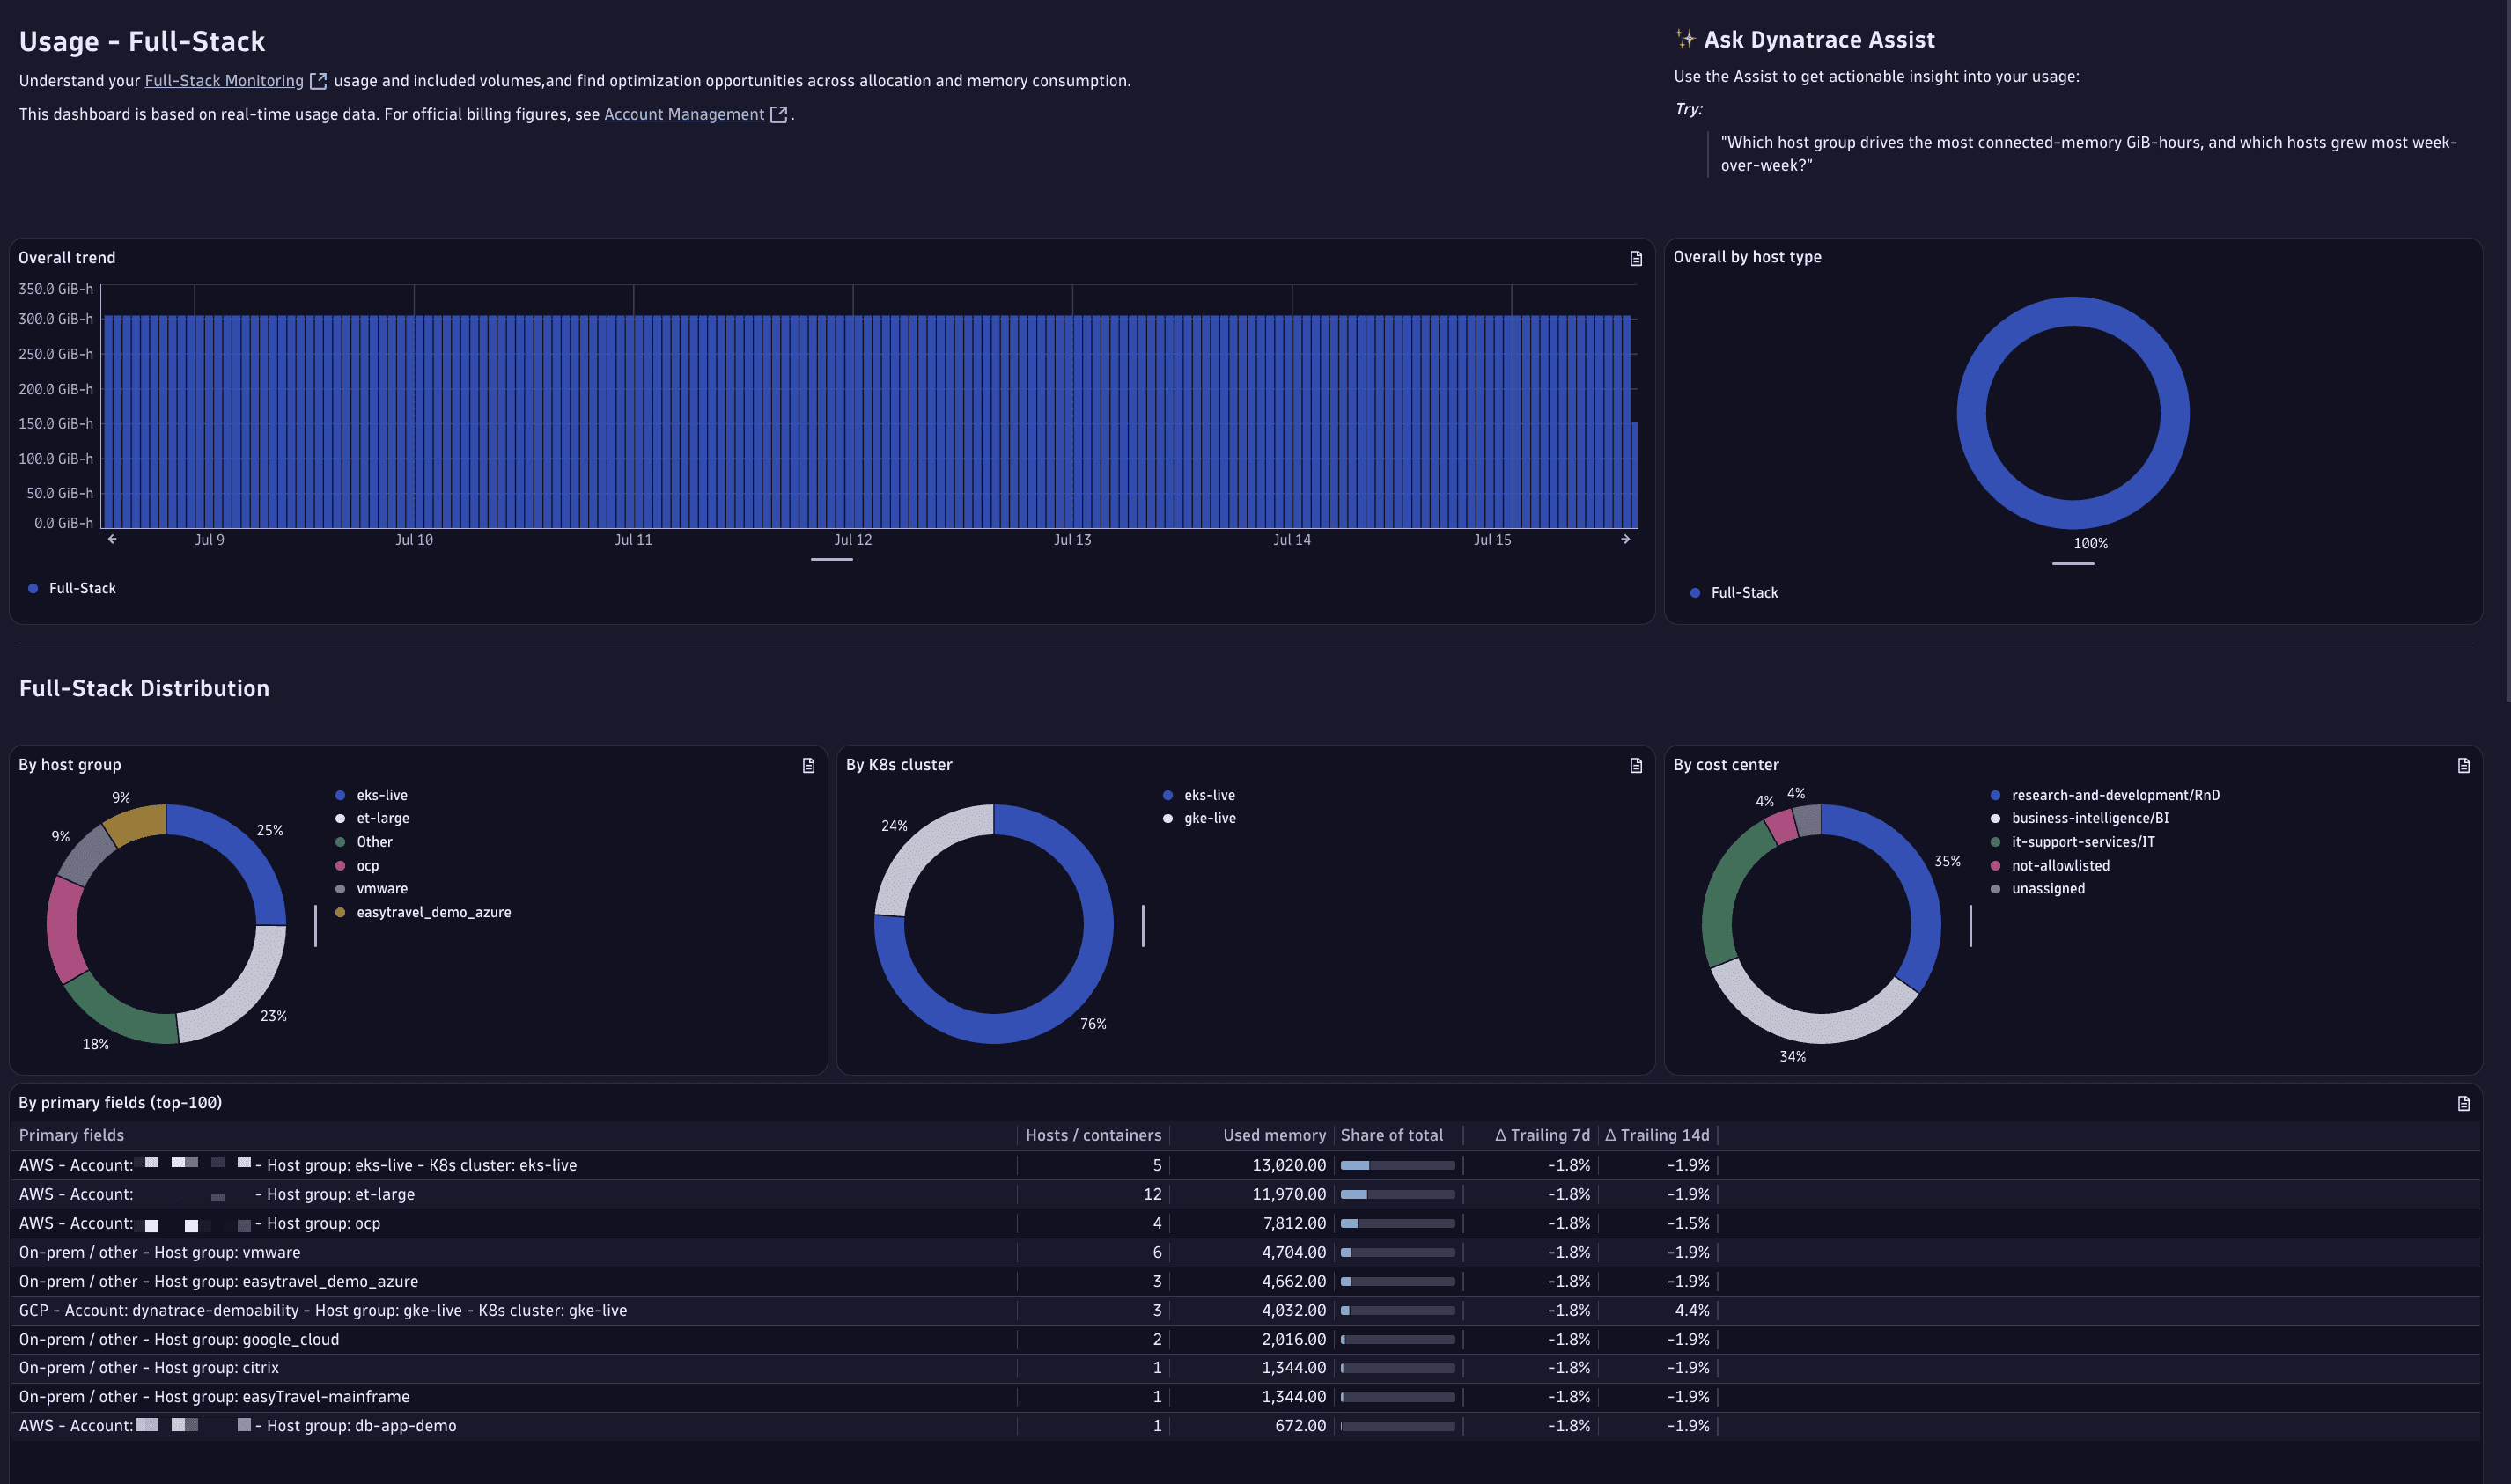
The Usage - Full-Stack dashboard helps you to understand your Full-Stack Monitoring usage and included volumes, and find optimization opportunities.
You can further filter the information by fields such as cost center, host group, primary fields, and custom filters.
- Overall trend: The number of GiB-hours that you're consuming, displayed over time.
- Distribution: GiB-hour consumption sorted by cost center, host group, Kubernetes clusters, and Grail primary fields.
- Metrics: The volume of included metrics (in data points) according to your Full-Stack consumption, see Full-Stack included metrics.
- Traces:
- Your trace capture rate, see Adaptive Traffic Management.
- Ingest volumes display included and extended ingest separately, see Included and extended trace retention.
- A list of which cost centers are driving trace ingest consumption.
- Retention: Buckets that contribute the most to data retention, with a per-bucket breakdown of included versus extended retention, including extended volume.
It also includes an Ask Dynatrace Assist panel with a starter prompt to explore consumption in natural language. Open Dynatrace Assist and enter your question there. For more information, see Ask cost questions with Dynatrace Assist.
Next steps
- To act on what these dashboards reveal, see Optimize.
- To work through a specific spike end to end, see Trace a cost spike to its root cause.