Understand and measure consumption for HTTP Monitor (DPS)
- Latest Dynatrace
- Explanation
- 5-min read
With HTTP Monitor, you can test the availability, performance, and correctness of websites and API endpoints.
This page explains how consumption is calculated and how you can estimate, manage, and optimize usage in Dynatrace.
How consumption is calculated
HTTP Monitor consumption is measured in synthetic requests, using the HTTP Monitor rate-card item. One synthetic request is consumed each time a monitor runs, for each HTTP(S) request that is executed, at each location.
Key terms
- Synthetic request
A synthetic request is a single HTTP(S) request executed by an HTTP Monitor. Each request counts as one synthetic request.
This is regardless of the HTTP method; if the request originates from a public or private location; or if authentication, certificates, custom headers, or scripts are used.
Counting rules and exceptions
-
A synthetic request is consumed as soon as the request is made.
-
If the HTTP Monitor request fails during execution, it's still counted.
-
Requests are counted once per execution at each location. It doesn't matter if the monitoring location is public or private.
-
Requests are counted irrespective of the HTTP method, and whether authentication, client certificates, custom headers, or scripts are used.
-
The following requests do not count towards your HTTP monitor consumption:
-
Requests that are skipped due to pre-execution scripting or logic.
-
Requests that didn't execute, because an earlier request failed.
-
Requests that didn't execute, because the monitor is disabled.
-
Estimate your cost
You can estimate your monthly cost by calculating the total number of synthetic results, and multiplying this by the list price of $0.001 per synthetic result.
Consumption formula
(# of synthetic requests in the monitor)× (# of executions per hour)× (# of locations)× (# of hours)= Total consumed results
Example
A customer has:
- 3 HTTP requests.
- These are executed every 10 minutes (6 times per hour).
- Each request runs from four locations.
- The tests are run for 30 days.
Calculation:
3 requests per executionx 6 executions per hourx 4 locationsx 24 hoursx 30 days= 51,840 synthetic requests
Multiplied by the unit cost of $0.001 per result, the total cost for synthetic tests in this example month is $51.84.
Track your consumption
This section describes the different Dynatrace tools that you can use to track consumption and costs.
Manage your consumption
Dynatrace provides various options to help you understand and analyze your organization's consumption of DPS capabilities.
Insights via Account Management
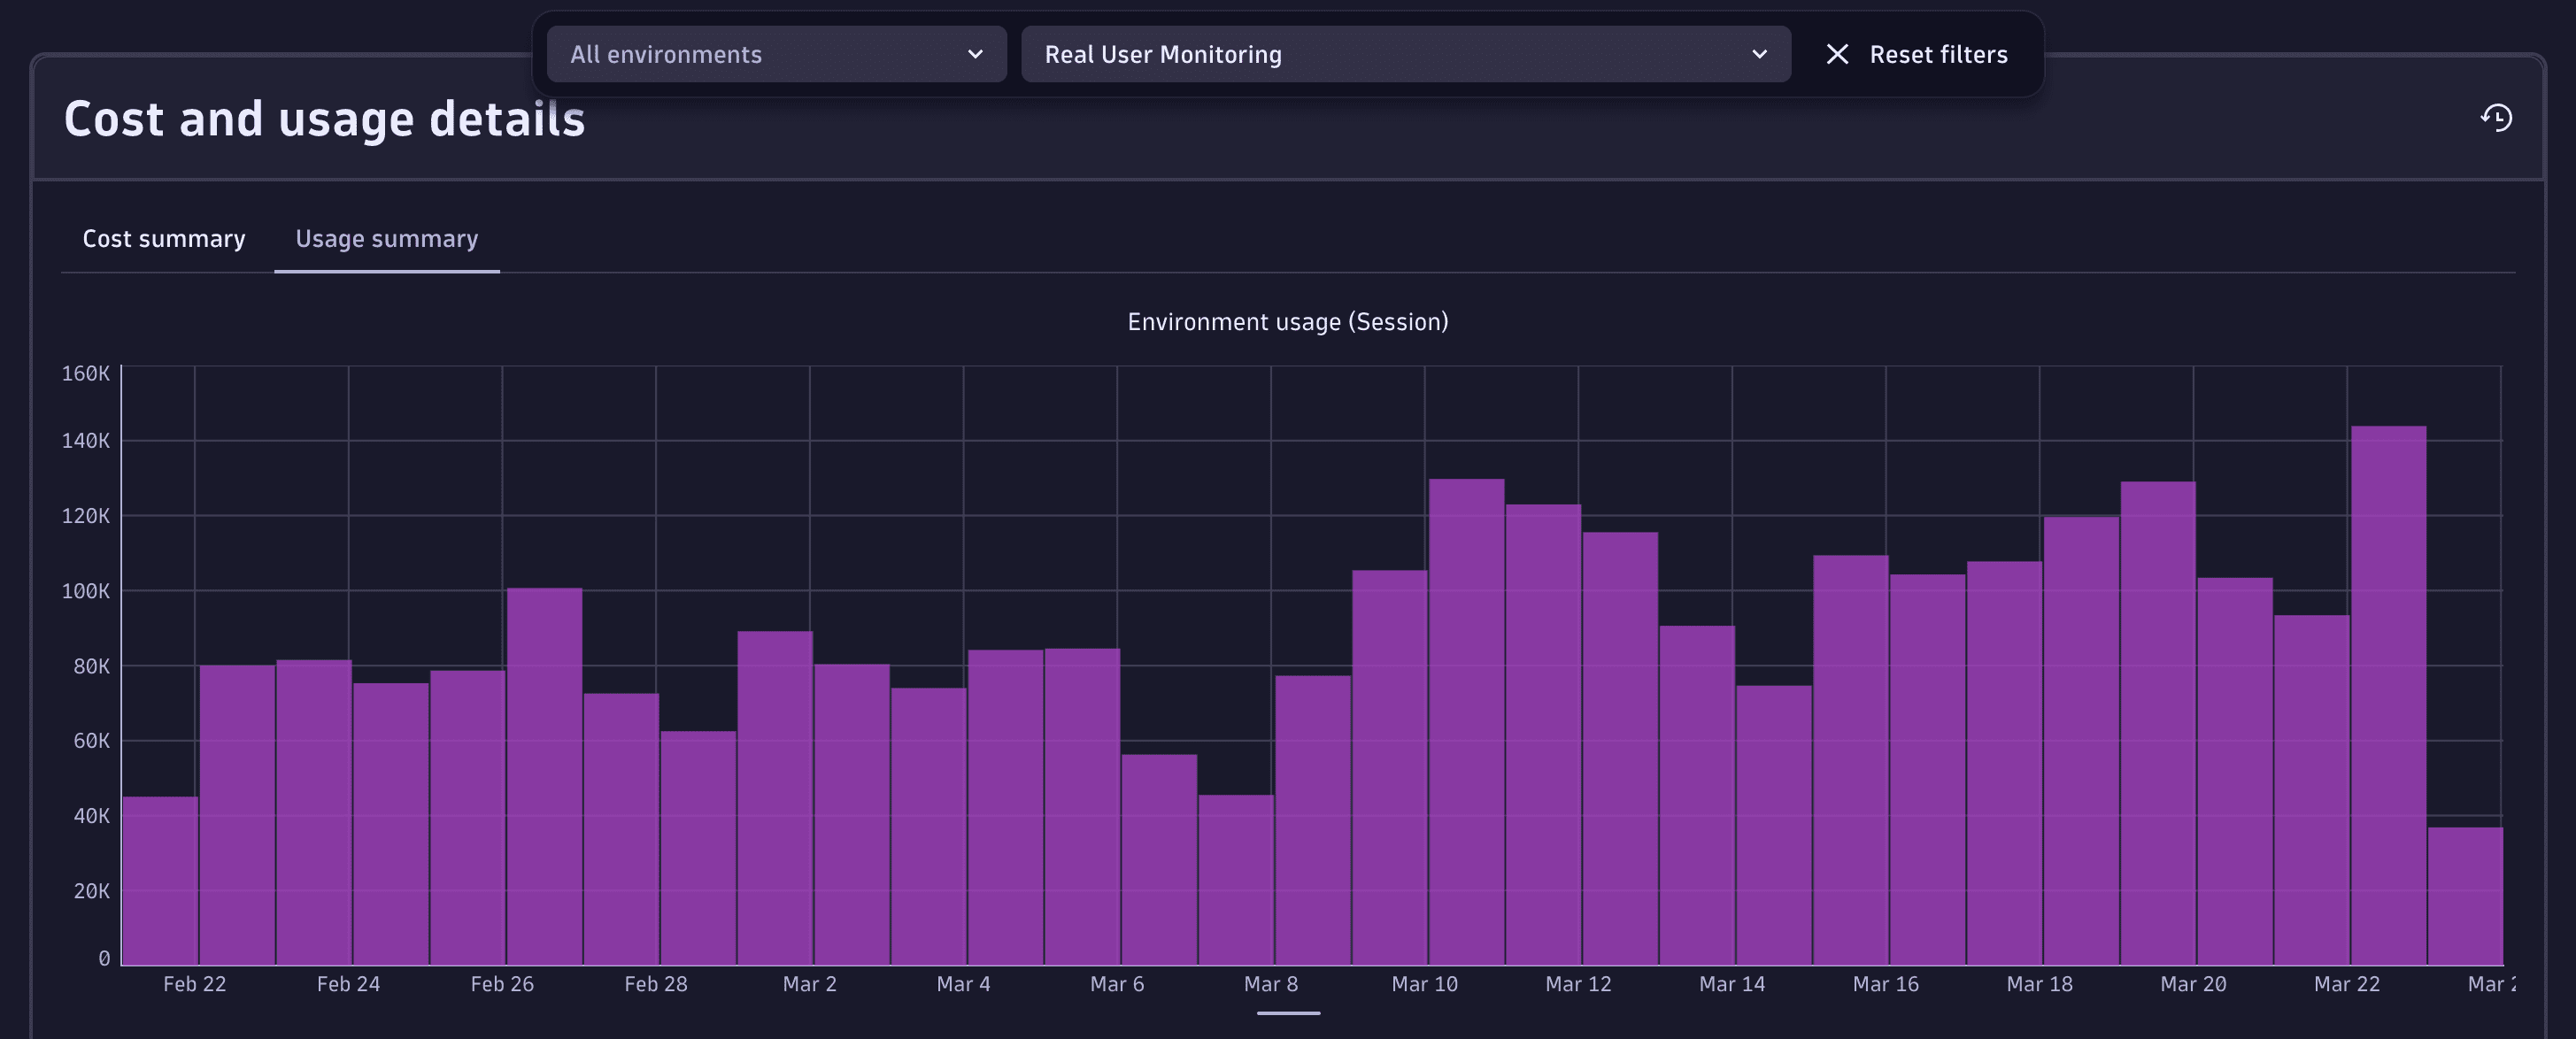
License managers can view usage and costs in Account Management. Go to Account Management > Subscription > Overview > Cost and usage details > Usage summary and select the HTTP Monitor capability.
For more information, see Overview (Dynatrace Platform Subscription).
Insights via billing usage events
Billing usage events (BUEs, billing_usage_event) are system events emitted by Dynatrace into the dt.system.events data space.
You can use DQL to query BUEs, and analyze usage and cost for Real User Monitoring capabilities without re-applying billing rules or session-counting logic.
BUEs represent already-calculated, billable usage for DPS capabilities (not any configuration or potential usage), and are aligned with what is shown in Account Management and on invoices. Therefore, they're the recommended data source for understanding related consumption.
Billing usage events contain:
- Which DPS capability was consumed.
- The usage amount that contributes to billing.
- The time window the usage belongs to.
- The entity context the usage is attributed to (for example, an application).
Query billing usage events with DQL
You can use billing usage events as the authoritative source when building cost allocation, usage analysis, or cost transparency views.
For example, aggregate by application to understand which applications contribute most to usage and cost.
Here are some example DQL queries for various use cases. You can use these queries as-is, or modify them to meet your needs.
-
Total usage over time
fetch dt.system.events| filter event.kind == "BILLING_USAGE_EVENT" and event.type == "HTTP Monitor"| dedup event.id| summarize totalUsage = sum(billed_sessions), by:{bin(timestamp, 1d)} -
HTTP session usage by application (in the last seven days)
fetch dt.system.events, from: -7d| filter event.kind == "BILLING_USAGE_EVENT"| filter event.type == "HTTP Monitor"| dedup event.id| summarize total_sessions = sum(billed_http_request_count), by: {dt.entity.http_check}| fieldsAdd app_name = entityName(dt.entity.http_check)| sort total_sessions desc| limit 20
Insights via API
You can query insights via the Environment API – Grail Query. Example DQL queries are provided in Query billing usage events with DQL.
FAQs
Do failed requests still consume synthetic requests?
Yes. A request is counted once it starts executing. Skipped requests caused by a failure are not counted.
Do custom authentication, headers, or certificates increase consumption?
No. Only executed HTTP requests count.
How are redirects counted?
If redirect-following is enabled, each redirect is an additional synthetic request. If disabled, only the initial request counts.
Do on-demand executions consume requests?
Yes. Manual executions consume synthetic requests the same way scheduled executions do.