Overview (Dynatrace Platform Subscription)
- Latest Dynatrace
- Explanation
- 3-min read
- Published Nov 24, 2025
The Account Management Overview view provides three key analyses of your DPS subscription.
- Budget summary: A summary of total subscription period costs and forecast, with a breakdown by environment.
- Cost and usage breakdown: A detailed cost and usage breakdown for the last 30 days.
- Cost and usage analysis: A drilldown view with flexible filter options to view and compare costs and usage.
You can access this information at Account Management > Subscription > Overview.
All budget and cost information is also available via the Dynatrace Platform Subscription API.
If you see Account Management > License, please refer to our Dynatrace classic license documentation instead.
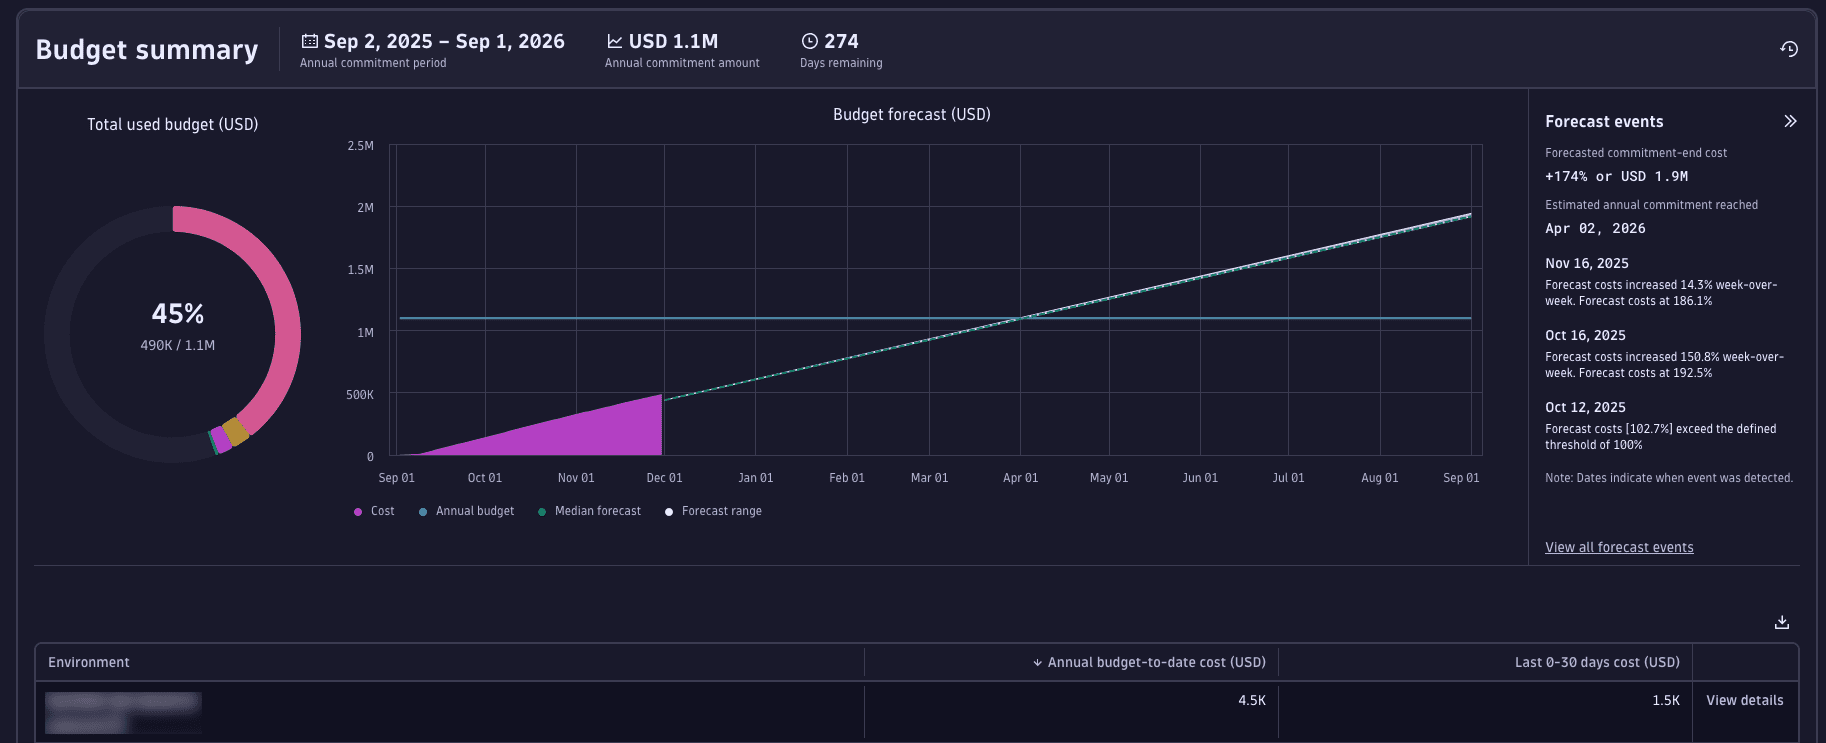
Budget summary
The Budget summary displays details about annual costs and a forecast, with a breakdown of costs by environment.
-
Overall subscription information includes:
- Annual commitment period: The current subscription period. (If you have a multi-year subscription, this shows just your current subscription period.)
- Annual commitment amount: Your committed budget for the current subscription period, in the currency as defined in your subscription agreement.
- Days remaining: How many days are left in the current subscription period.
-
The Total used budget donut chart provides a snapshot of the percentage of your annual commitment amount that has already been consumed, along with the actual amount and your accrued usage. Hover over the chart to display the exact breakdown for each environment. (Note that the chart lists only the first four environments; all other environments are grouped into Other).
-
The Budget forecast line chart shows your cumulative accrued costs. Data is shown from the start of the subscription period, and includes a forecast of costs through the end of the period. Hover over the chart to display the actual and forecast costs.
Account Management uses advanced forecasting models to predict future costs. These forecasts are available only for accounts with 15 days or more of cost data.
Forecast data is an estimate only. It does not guarantee future costs.
-
Forecast events: Projected on-demand usage increase (percentage and cost) that you're forecast to incur at the end of the annual commitment period. When usage is forecasted to exceeds the annual commitment, the panel shows the specific date at which the forecasted usage exceeds the annual commitment.
-
Environment: Cost details for each environment.
- Annual budget-to-date cost: The cumulative cost for the given environment, measured from the start of the commitment period.
- Last 0–30 days cost and Last 0–30 days change: Cumulative cost and percentage change by environment for the last 30 days. Because environment usage may fluctuate within the commitment period, these columns help you identify the environments that currently incur the highest costs.
-
To view the cost breakdown for an environment by capability, select Actions > View details.
Cost and usage
The Cost and usage pane provides a detailed analysis of the last 30 days of costs and usage related to your subscription. To view this information, select either Cost summary (for costs) or Usage summary (for usage).
Cost summary
The Cost Summary tab displays costs incurred over the previous 30 days, across all environments and capabilities.
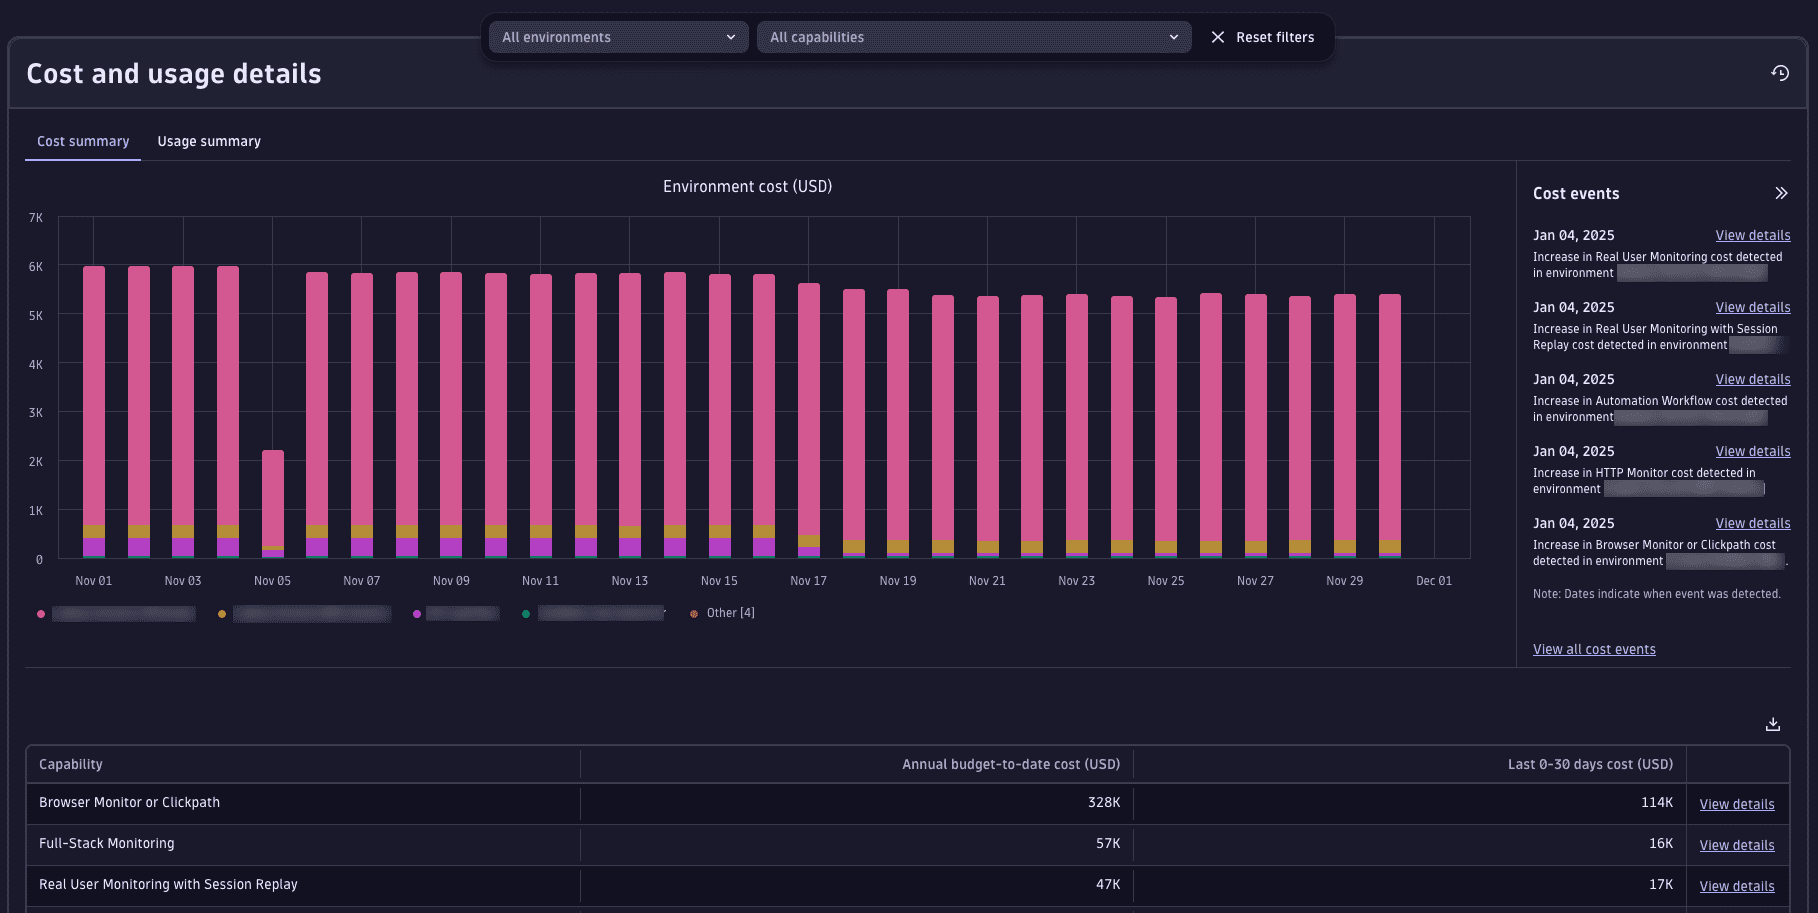
The bar chart at the top shows costs related to the environment over time.
- Hover over a value on the chart to show a cost breakdown by environment.
- Select an environment name to show/hide it on the chart.
- To filter cost data from specific environments or capabilities, use both the All environments and All capabilities filters that are visible above the chart. (Note that only the first four environments, ranked by costs from highest to lowest, are shown individually. All other environments are grouped into Other.)
The tabular data beneath the chart breaks down costs at the capability level.
- Annual budget-to-date cost is the cumulative cost for the given environment, measured from the start of the commitment period.
- Last 0–30 days cost and Last 0–30 days change show cumulative cost and percentage change by environment for the previous 30 days. Because environment usage may fluctuate within the commitment period, these columns help you identify the environments that currently incur the highest costs.
- To view the cost breakdown for a capability, select Actions > View details.
Usage summary
The Usage summary tab displays a chart that shows the usage incurred by individual capabilities over the previous 30 days.

- The total usage for each capability is displayed in that capability's unit of measure.
- Use the filter above the chart to view usage for different environments and capabilities.
Capability cost and usage analysis
The Capability cost and usage analysis page allows you to view subscription costs and usage side by side, and provides additional time frame filters.
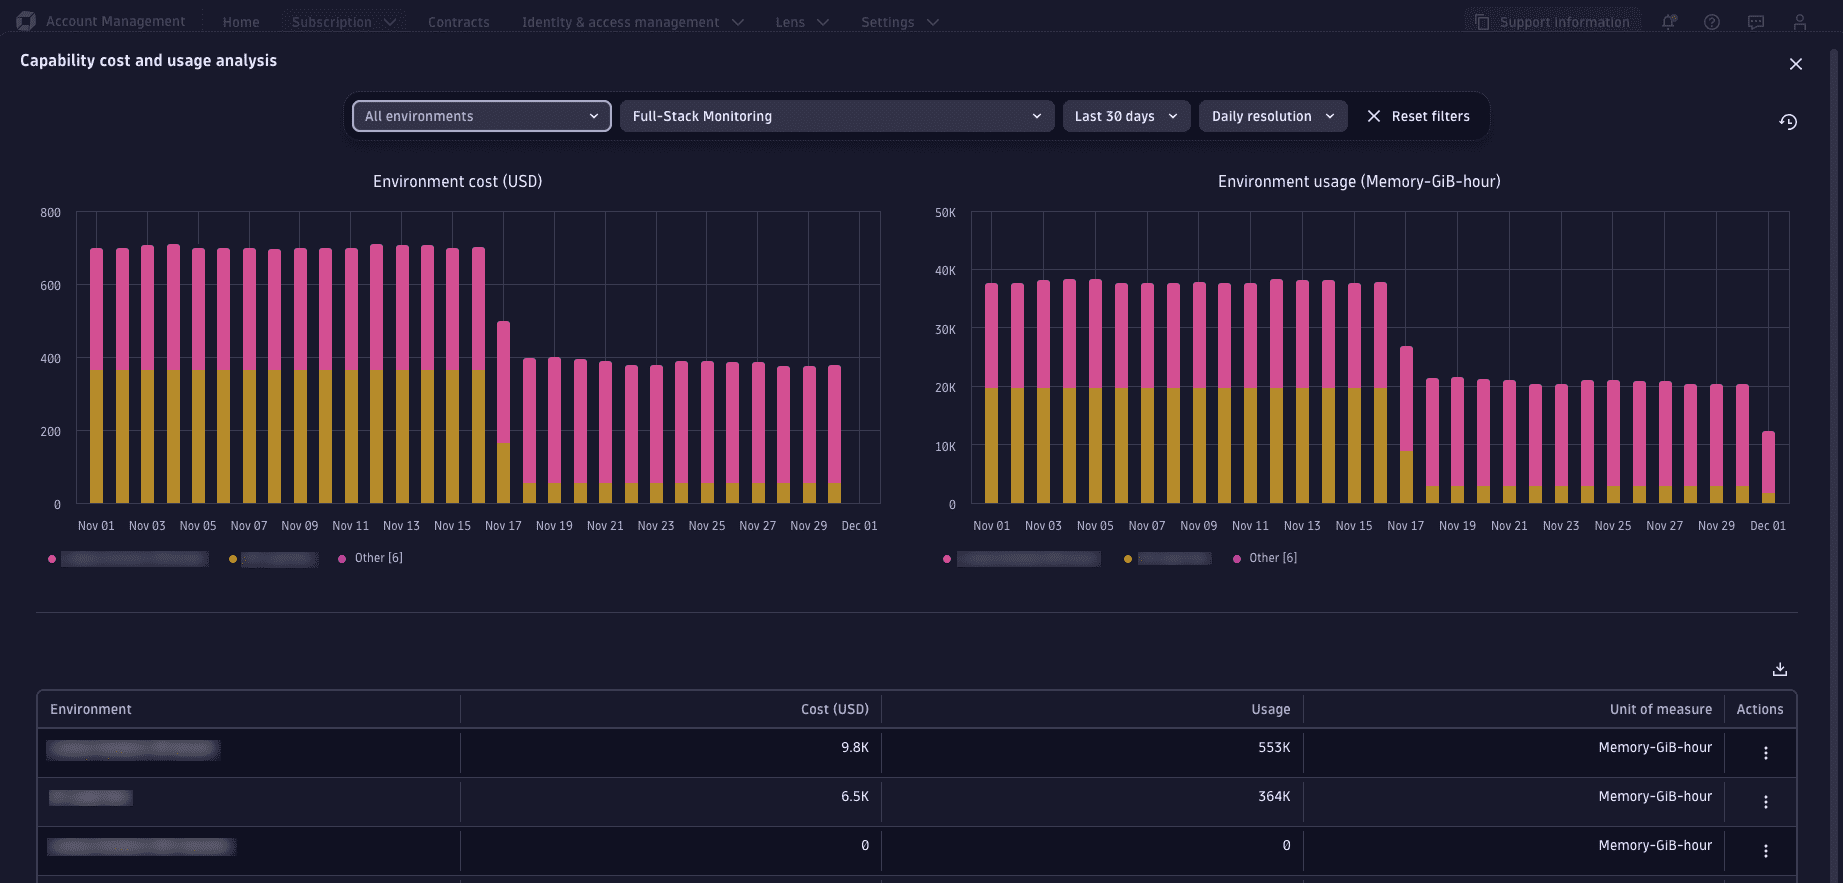
- The Environment cost chart displays the daily costs in your subscription's configured currency unit. The Environment usage chart displays daily usage in that capability's unit of measure.
- Use the filter to change the time frame. By default, the chart displays the previous 30 days of data.
- The table displays the total cost and total usage based on the selected filters.
Environment cost and usage analysis
The Environment cost and usage analysis page allows you to view capability costs and usage for a specific environment.
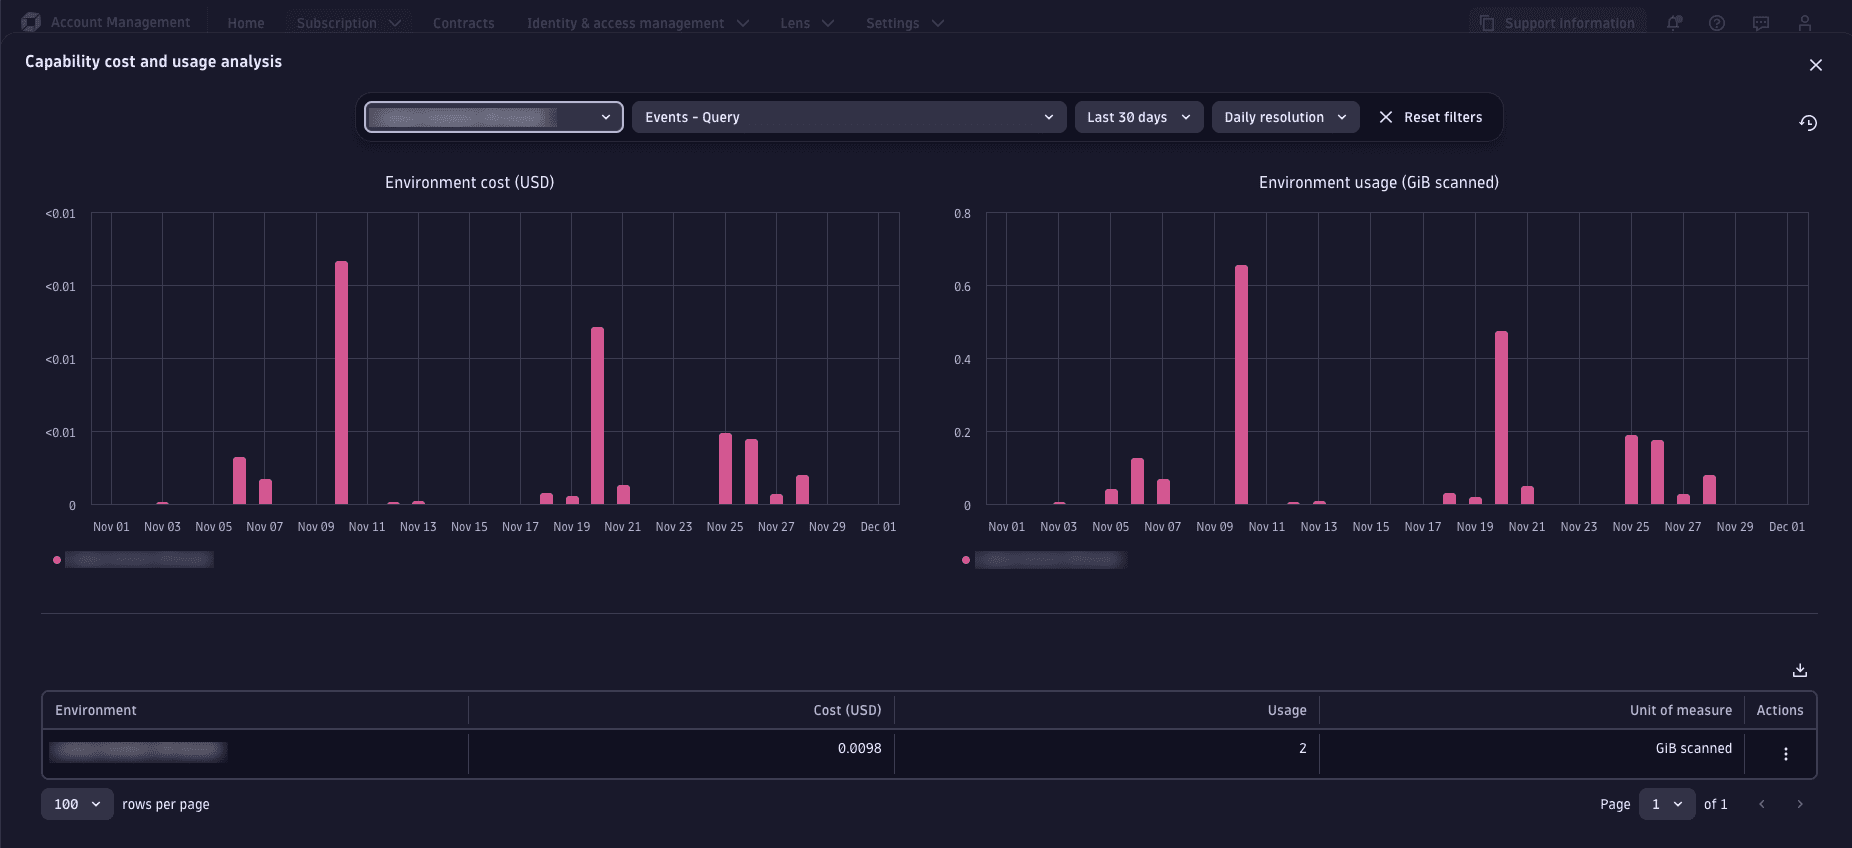
To view the environment cost and usage analysis for any environment, select Actions > View details. This page is a variant of the Capability cost and usage analysis page, which displays cumulative cost and usage by capability.
Select a capability from the filter above the chart to view usage for the selected time frame.