Where to view your costs
- Latest Dynatrace
- Explanation
- 6-min read
Dynatrace exposes the same underlying cost and usage data through several surfaces. Choose the one that fits your task:
- Account Management: The front door for subscription totals, capability and environment breakdowns, billing reports, and the APIs that expose this same data programmatically.
- Usage dashboards: Ready-made dashboards that visualize real-time consumption by capability and let you drill into traces, logs, and Full-Stack consumption to find what drives cost. See View DPS consumption with ready-made usage dashboards.
- DQL: When you need granular analysis, use DQL to query billing events.
- Dynatrace Intelligence: The Dynatrace AI lets you explore costs in natural language.
Overview
Dynatrace records every metered usage record to Grail as a billing event. Account Management surfaces this data as ready-made summaries, breakdowns, and reports. The same data is queryable directly with DQL or natural language through Dynatrace Intelligence, and exportable for finance integrations.
Use cases
- Check your current subscription consumption against your annual commitment.
- Compare cost across environments, capabilities, or time periods.
- Build a custom DQL query for a cost question Account Management doesn't answer.
- Ask a natural-language cost question through Dynatrace Intelligence.
- Pull billing data into Excel, Power BI, or another finance tool.
Account Management
Account Management gives you hourly reporting on DPS usage, daily updates on your current budget, and a drill-down view that lets you compare costs across time periods, environments, and capabilities.
Cost overviews
You can get an overview of your Dynatrace Platform Subscription consumption in Account Management > Subscription.
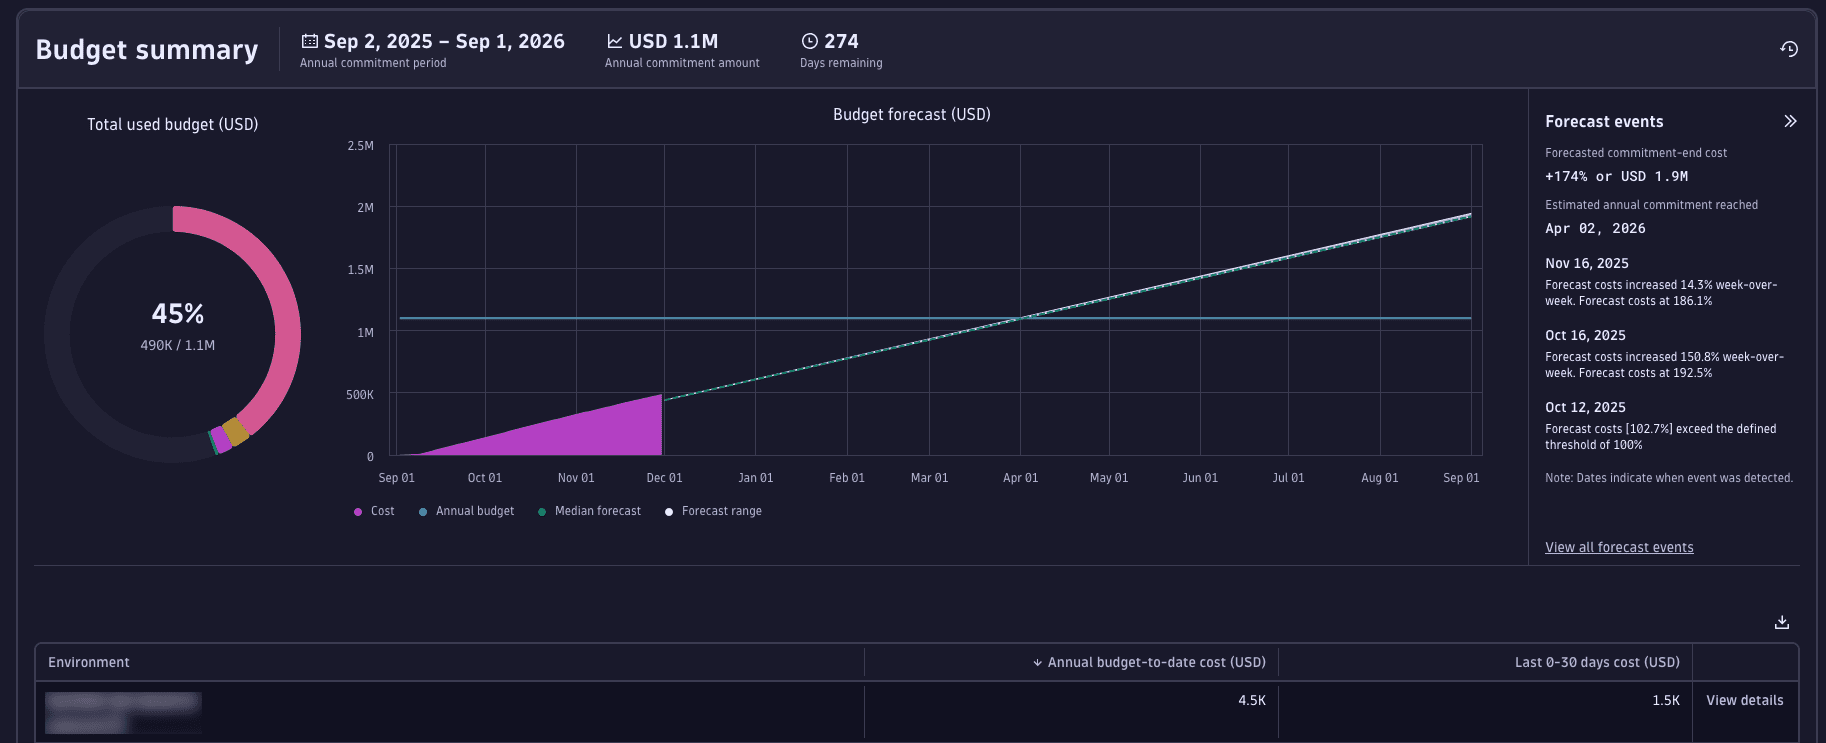
- Budget summary: a summary of total subscription period costs and forecast, with a breakdown by environment.
- Cost and usage breakdown: a detailed cost and usage breakdown for the last 30 days, including consumption by capability and by environment.
- Cost and usage analysis: a flexible drill-down view where you can compare time periods, filter by environment or capability, and identify cost drivers and trends.
For a detailed walkthrough of the UI, see Overview (Dynatrace Platform Subscription).
Billing report
Your billing report provides details about accrued costs per booking date. Use this view to determine which Dynatrace monitoring costs were recognized and booked on which day.
Billing reports are available in Account Management > Subscription > Billing report.
For more information, see Billing report.
APIs for cost data integration
Every usage and cost data point you see in Account Management is also available via the Dynatrace API. This means you can export your consumption data, share it across teams, and integrate it into any tool your organization already uses, from finance systems to custom dashboards. Common use cases:
- Share cost visibility with budget owners and finance teams.
- Feed consumption data into enterprise tools.
- Automate budget reports and alerts.
- Integrate with internal cost allocation or chargeback systems.
For a full walkthrough including OAuth setup, request examples, and a Workflow automation, see Export cost data via API.
You can also explore all available endpoints directly in the API Explorer in Account Management or via the Account Management API documentation.
Other ways to view your costs
When Account Management's pre-built views don't answer your questions, you can work with the same underlying data directly in your environment.
Query billing events with DQL
For granular analysis Account Management can't do on its own, query billing events directly from your environment using DQL.
For more information about DQL, see Use DQL queries.
Dynatrace writes every metered usage record to dt.system.events with event.kind == "BILLING_USAGE_EVENT". These events contain the capability being consumed, usage quantity in the relevant unit, timestamps, and cost allocation tags (if configured).
For example, to return the top 20 most expensive query events in the last hour, run the following query:
fetch dt.system.events| filter event.kind == "BILLING_USAGE_EVENT"| filter event.type == "Events - Query"| filter timestamp > now() - 1h| dedup event.id| fields timestamp, event.type, billed_bytes| sort billed_bytes desc| limit 20
For the full schema of billing events, see System event models.
Ask cost questions with Dynatrace Intelligence
Dynatrace Intelligence is an agentic and generative AI that lets you explore your data through natural language. You can ask it questions about your costs and cost drivers, and it will help you understand those costs, predict future consumption, and optimize your usage. It translates your prompt into DQL and can auto-execute the generated queries, with no manual query writing needed.
You can use it from:
- Dynatrace Assist: Ask questions about your environment, get help with onboarding, or learn about Dynatrace concepts.
 Dashboards: Type a question in context and Dynatrace Intelligence generates a matching DQL query.
 Notebooks: Same natural language experience, tailored for exploratory analysis.
For examples and best practices, see:
Related topics
 Dynatrace Platform Subscription