Understand and manage consumption for Real User Monitoring (DPS)
- Latest Dynatrace
- Explanation
- 5-min read
Real User Monitoring (RUM) provides full visibility into how end users experience every digital transaction across web, mobile, and single-page applications.
This page explains how RUM consumption is calculated, and how you can manage your RUM spend in Dynatrace.
How consumption is calculated
The unit of measurement for RUM consumption is sessions, plus the number of session properties that are captured within those sessions.
This is measured using:
- The Real User Monitoring rate card item, if session replay isn't enabled.
- The Real User Monitoring with Session Replay rate card item, if session replay is enabled.
- The Real User Monitoring Property rate card item, which is applied separately.
Key terms
- User session
A user session (or just "session") represents one user's visit to an application. A user session summarizes user interactions and technical events that occur during that visit. One user session can span multiple applications, across both web and mobile components.
For more information, see User sessions in RUM Classic.
- Application
An application (or just "app") is a customer-defined logical entity in Dynatrace, used to monitor part or all of a customer-facing application. Dynatrace captures user sessions for web, mobile, and custom applications. It has an end-user interface and receives real user traffic.
For more information, see Applications in RUM Classic.
- Session property
A session property is metadata that provides information about your application's performance, which Dynatrace collects during a specific RUM session.
For more information, see Capture event and session properties for web frontends.
Counting rules and exceptions
-
If a user visit spans multiple applications, Dynatrace counts one session for each application the user interacted with.
-
If a user visit lasts longer than one hour in a given application, Dynatrace counts an additional session for every starting hour. For complete details on when RUM user sessions start and end, see User session timings.
-
A user visit related to a hybrid mobile application, which for technical reasons includes a web application and a mobile application, is considered a single user session.
-
User sessions that include only one user action (for example, a page load or a navigation that triggers web requests) are considered bounced. These don't count towards RUM consumption.
-
Applications with fewer than 2 user actions per hour do not generate user session consumption.
-
RUM includes up to 20 session properties for each application at no additional cost. Additional session properties (beyond the included 20) are billed at Real User Monitoring Property rates for each session in which the property appears.
Note: When migrating an existing RUM Classic application to Latest Dynatrace, we protect you from double billing and charge only for the maximum number of properties configured in either RUM Classic or Latest Dynatrace.
Calculation example
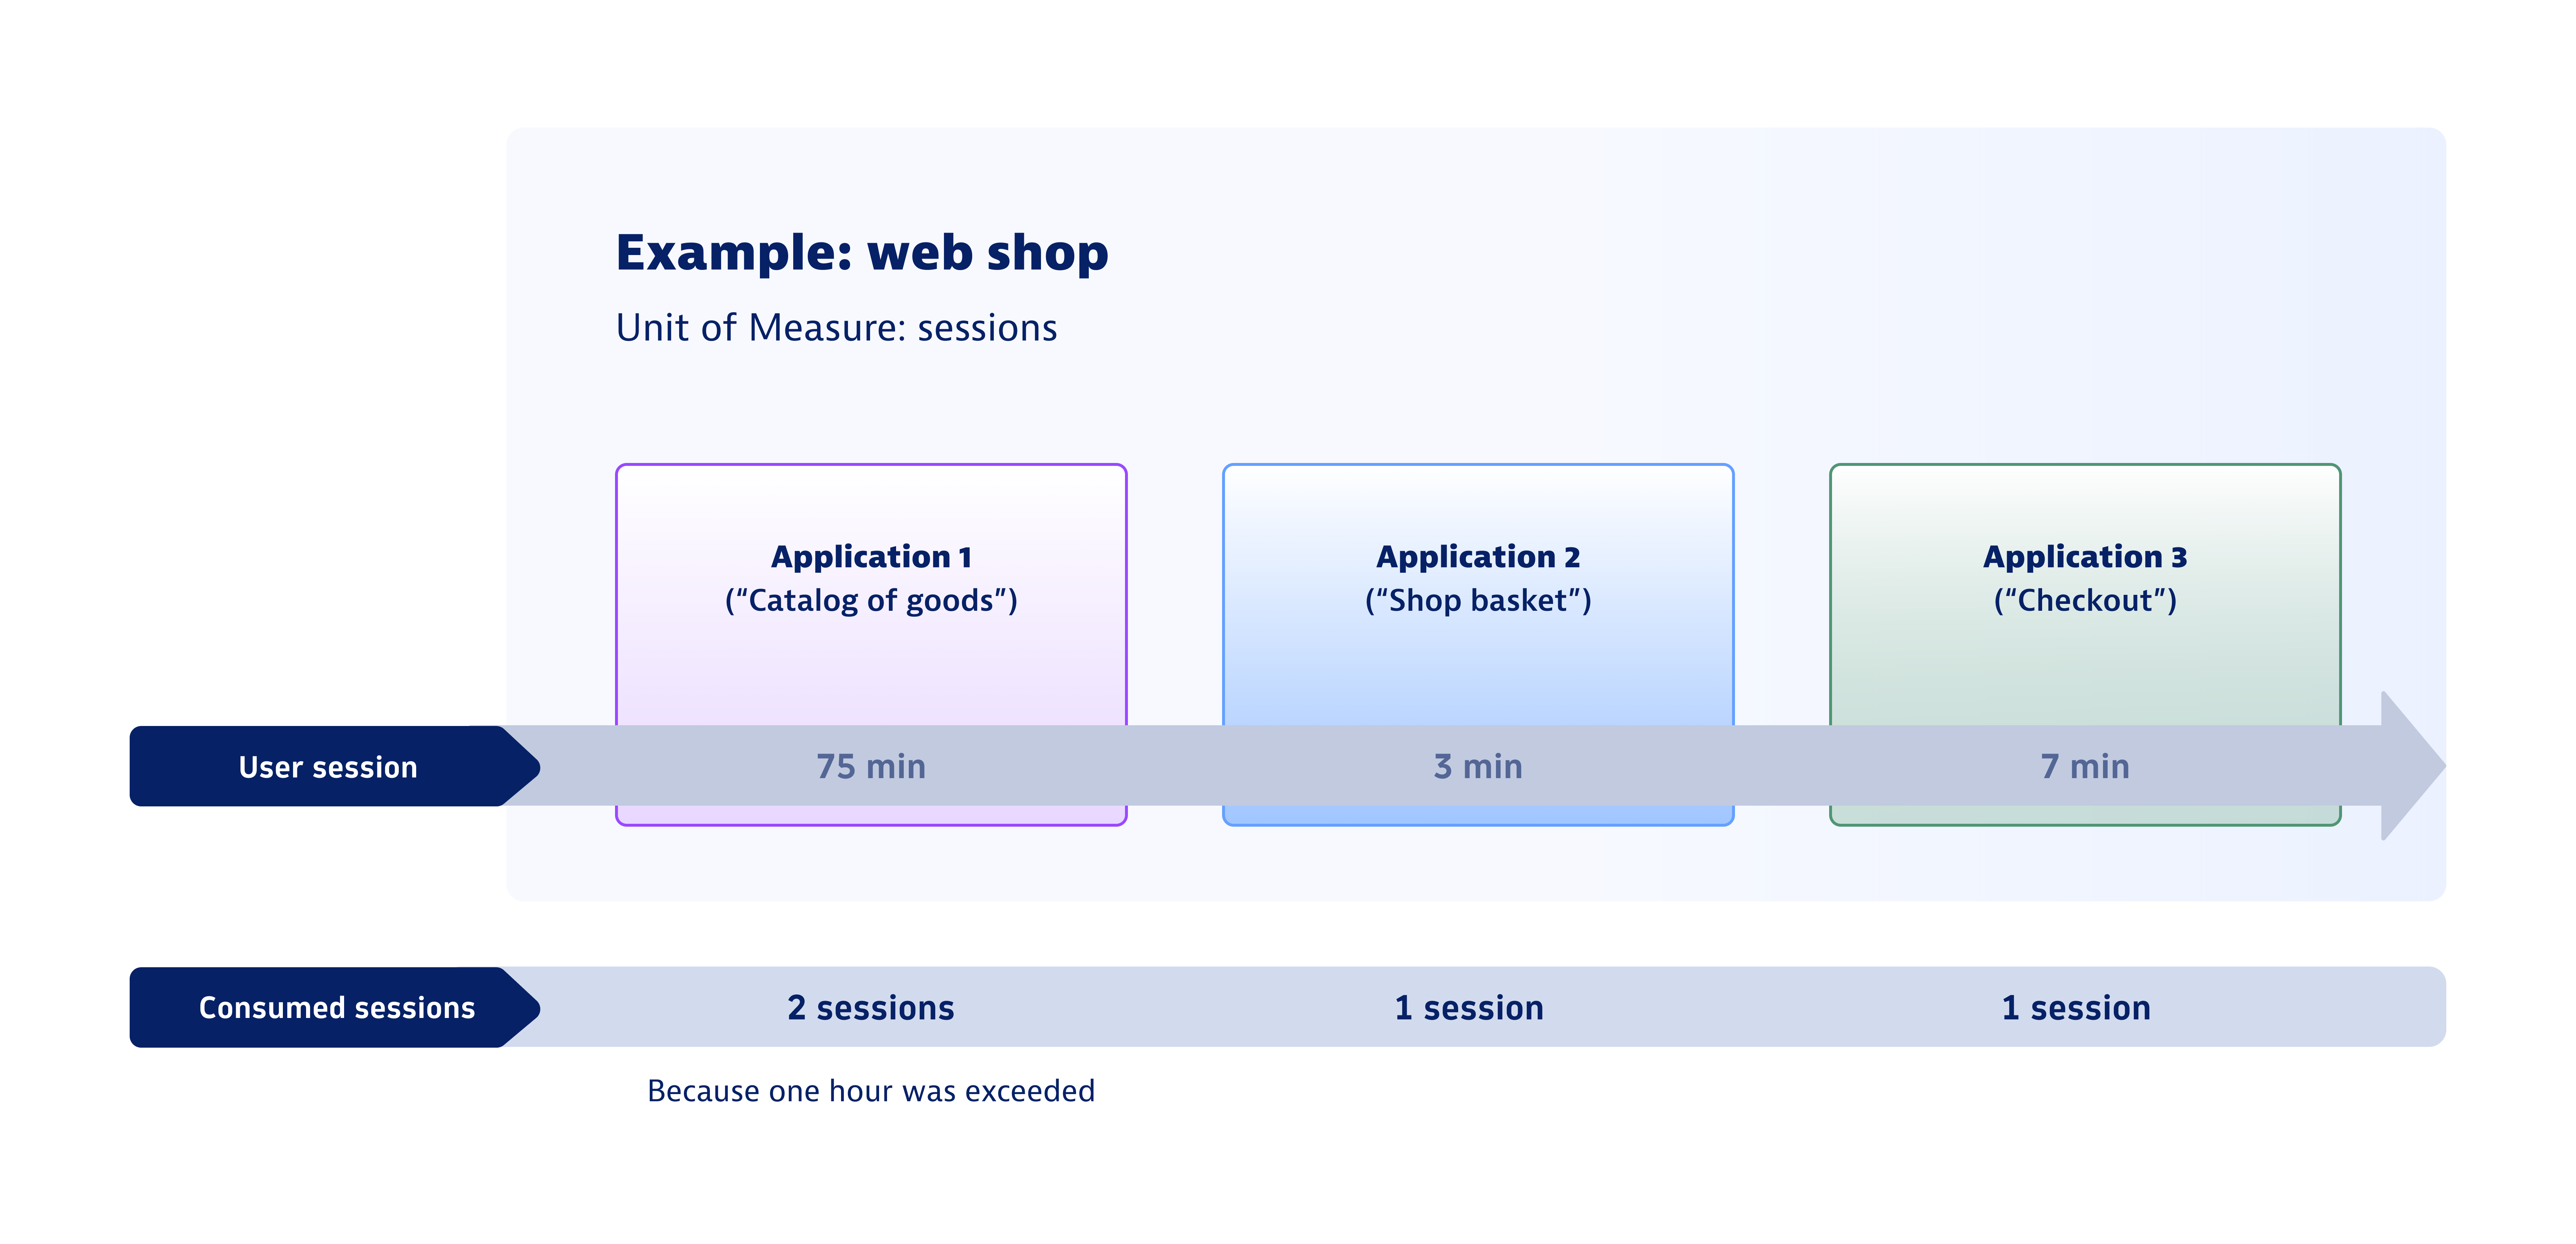
As an example, a user visits a retail website to make a purchase.
The user:
- Browses the online catalog of goods and adds some items to a basket. This takes 75 minutes.
- Reviews the items in the shopping basket. This takes 3 minutes.
- Checks out and purchases the items. This takes 7 minutes.
Because sessions are billed per application per hour, four total sessions are consumed, see the figure below.
Estimate your cost
The following example demonstrates how costs are calculated for RUM sessions.
-
Calculations are based on the following list prices (which may differ from your rate card prices):
- Real User Monitoring: $0.00225 per session.
- Real User Monitoring with Session Replay: $0.0045 per session.
- Real User Monitoring Property: $0.0001 per property per session.
- All costs are in USD.
-
One month is equivalent to 30 days.
-
The monitored entity is a single web application.
- The entity is monitored 24 hours per day.
- All user visits were less than one hour.
- Traffic levels are 5,000 sessions per hour (equivalent to 3,600,000 sessions per month).
Cost example 1: Real User Monitoring
If you enable Real User Monitoring at the list price, your monthly costs would be:
- 3,600,000 sessions × $0.00225 = $8,100 per month
Cost example 2: Real User Monitoring with Session Replay
If you enable Real User Monitoring and 20% (720,000) of the total sessions have Real User Monitoring Session Replay enabled, your monthly costs would be:
- Real User Monitoring: 2,880,000 x $0.00225 = $6,480 per month
- Real User Monitoring with Session Replay: 720,000 x $0.0045 = $3,240 per month
- $6,480 + $3,240 = $9,720 per month
Cost example 3: Real User Monitoring Property
If you define 30 session properties, your monthly costs would be:
- 30 total properties – 20 included properties = 10 billable properties per session
- 10 billable properties × 3,600,000 sessions = 36,000,000
- 36,000,000 × $0.0001 = $3,600 per month
Understand and manage your consumption
Dynatrace provides various options to help you understand and analyze your organization's consumption of RUM capabilities.
Insights via Account Management
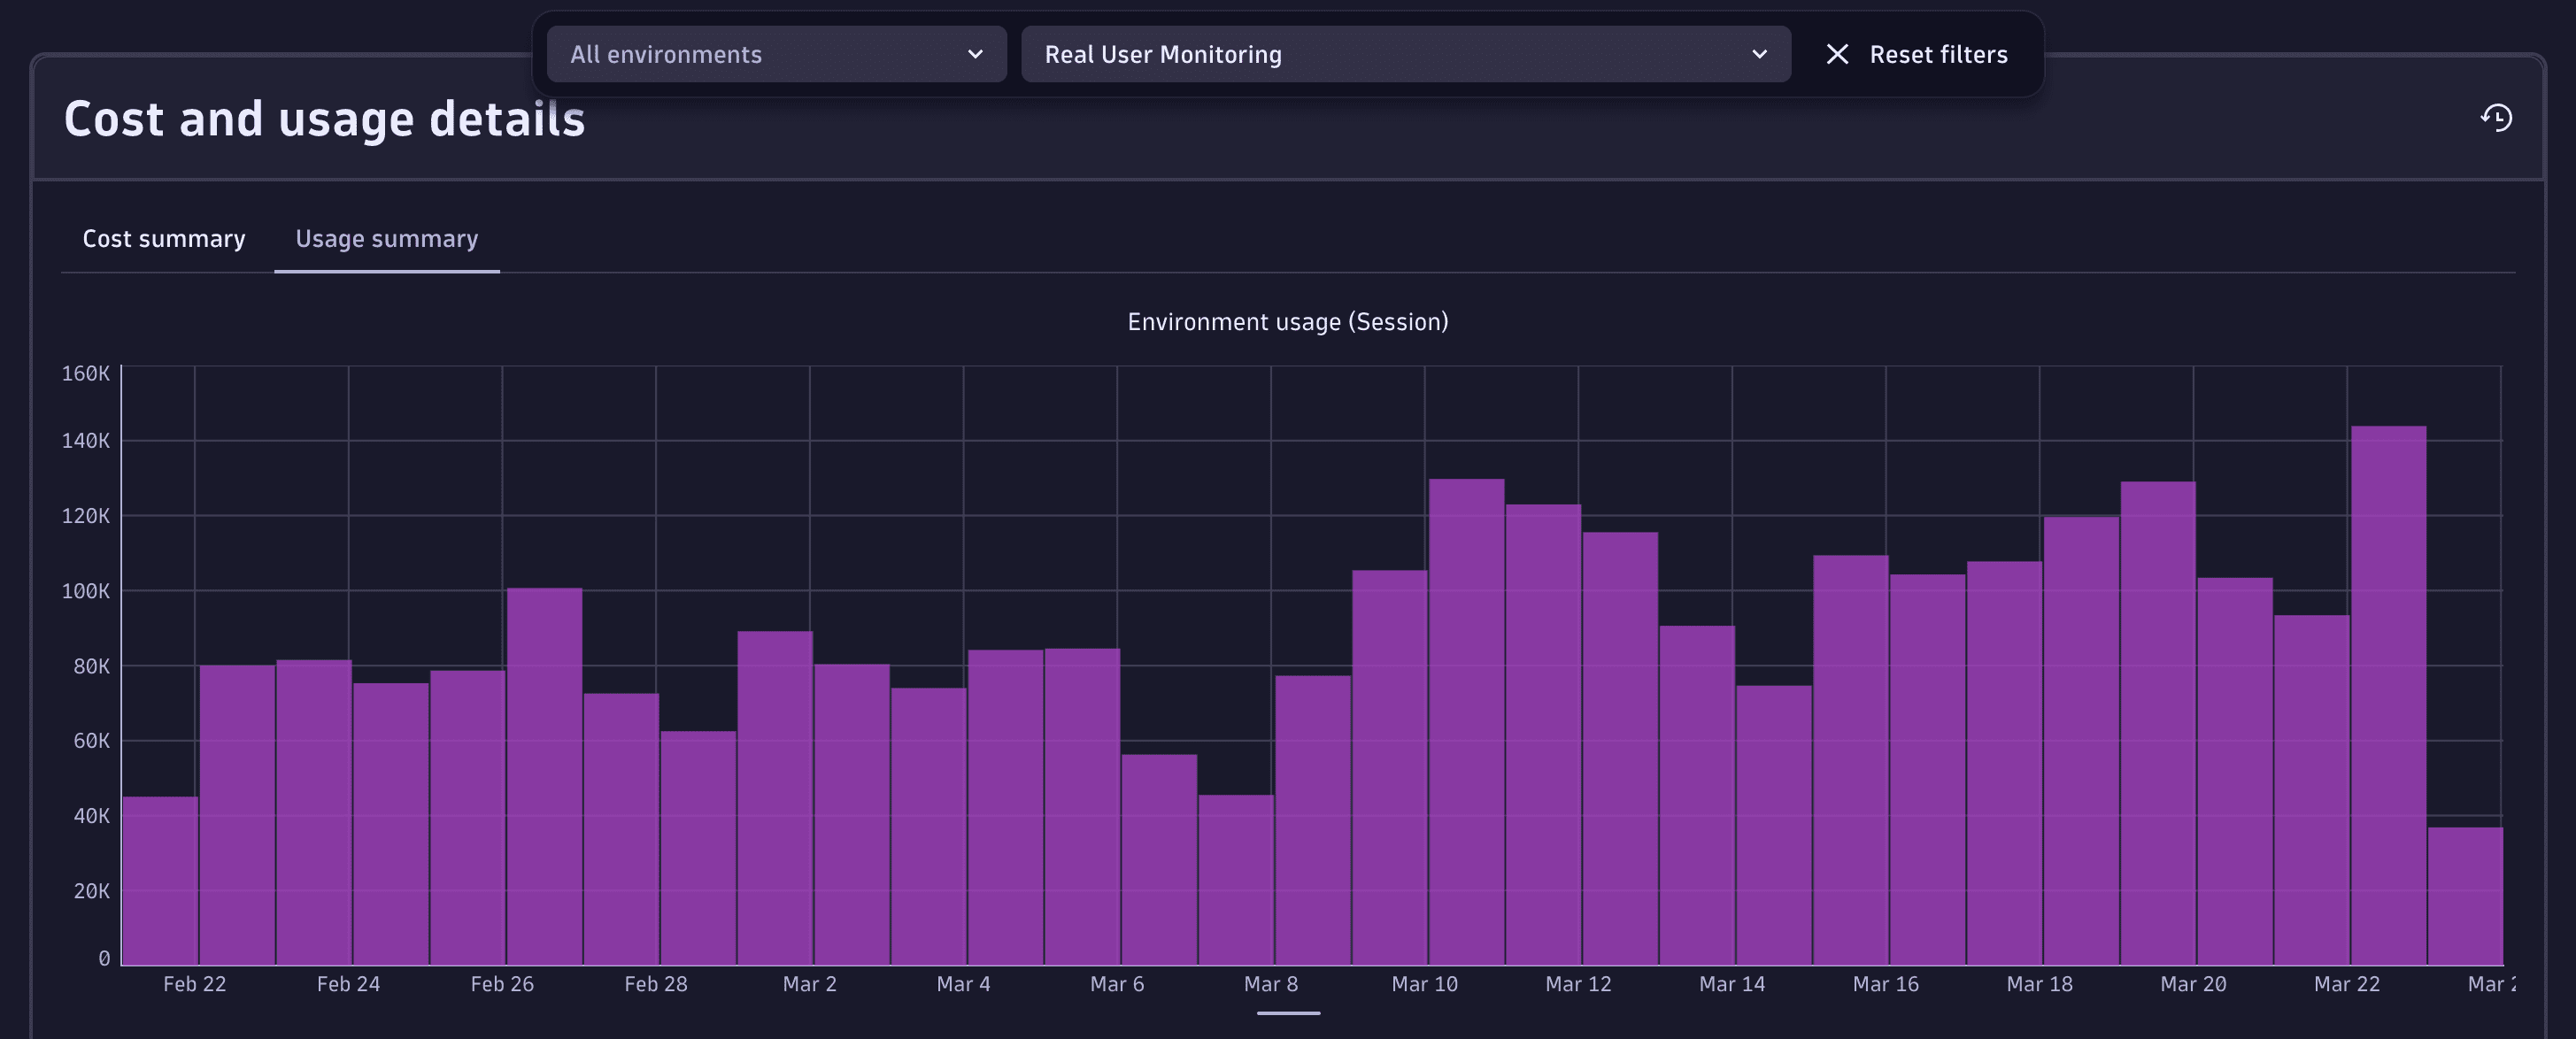
License managers can view usage and costs in Account Management.
Go to Account Management > Subscription > Overview > Cost and usage details > Usage summary and select the appropriate category, whether Real User Monitoring, Real User Monitoring with Session Replay, or Real User Monitoring Property.
For more information about the subscription overview UI, see Overview (Dynatrace Platform Subscription).
Insights via billing usage events
Billing usage events (BUEs, billing_usage_event) are system events emitted by Dynatrace into the dt.system.events data space.
You can use DQL to query BUEs, and analyze usage and cost for Real User Monitoring capabilities without re-applying billing rules or session-counting logic.
BUEs represent already-calculated, billable usage for DPS capabilities (not any configuration or potential usage), and are aligned with what is shown in Account Management and on invoices. Therefore, they're the recommended data source for understanding RUM-related consumption.
Billing usage events contain:
- Which DPS capability was consumed.
- The usage amount that contributes to billing.
- The time window the usage belongs to.
- The entity context the usage is attributed to (for example, an application).
Billing usage events for RUM capabilities
The table below describes billing usage events for the three RUM capabilities.
| Capability | usageAmount | Counting rules |
|---|---|---|
Real User Monitoring | The sessions that are billed at the Real User Monitoring rate, for the given application and time window. | All counting rules are already applied (per application, per hour, bounced sessions excluded). |
Real User Monitoring with Session Replay | The sessions that are billed at the Real User Monitoring with Session Replay rate, for the given application and time window. | Only sessions where Session Replay was enabled. |
Real User Monitoring Property | The billable property occurrences across sessions. | Only properties beyond the included 20 per application are counted, and only when they're present in a session. |
Query billing usage events with DQL
You can use billing usage events as the authoritative source when building cost allocation, usage analysis, or cost transparency views:
- Filter billing usage events by capability to distinguish between Real User Monitoring usage, Real User Monitoring with Session Replay usage, and Real User Monitoring Property usage.
- Aggregate by application to understand which applications contribute most to usage and cost.
Here are some example DQL queries for various use cases. You can use these queries as-is, or modify them to meet your needs.
-
Total Real User Monitoring usage over time
fetch dt.system.events| filter event.kind == "BILLING_USAGE_EVENT" and event.type == "Real User Monitoring"| dedup event.id| summarize totalUsage = sum(billed_sessions), by:{bin(timestamp, 1d)} -
Total usage per capability (all applications)
fetch dt.system.events| filter event.kind == "BILLING_USAGE_EVENT"| filter event.type == "Real User Monitoring" orevent.type == "Real User Monitoring with Session Replay" orevent.type == "Real User Monitoring Property"| fieldsAddweb_or_mobile = coalesce(dt.entity.application, dt.entity.device_application),platform = if(isNotNull(dt.entity.application), "Web", else: "Mobile")| dedup event.id| summarizeRUM = sum(billed_sessions),Replay = sum(billed_replay_sessions),Property = sum(billed_property_sessions),by:{platform, web_or_mobile, event.type} -
Total usage per capability for a single application
fetch dt.system.events| filter event.kind == "BILLING_USAGE_EVENT"| filter event.type == "Real User Monitoring" orevent.type == "Real User Monitoring with Session Replay" orevent.type == "Real User Monitoring Property"| fieldsAddweb_or_mobile = coalesce(dt.entity.application, dt.entity.device_application),platform = if(isNotNull(dt.entity.application), "Web", else: "Mobile")| filter web_or_mobile == "APPLICATION-DC92E74A7A844E6E"| dedup event.id| summarizeRUM = sum(billed_sessions),Replay = sum(billed_replay_sessions),Property = sum(billed_property_sessions),by:{platform, web_or_mobile} -
Real User Monitoring usage per application
fetch dt.system.events| filter event.kind == "BILLING_USAGE_EVENT" and event.type == "Real User Monitoring"| fieldsAddweb_or_mobile = coalesce(dt.entity.application, dt.entity.device_application),platform = if(isNotNull(dt.entity.application), "Web", else: "Mobile")| dedup event.id| summarize totalUsage = sum(billed_sessions), by:{platform, web_or_mobile}| sort totalUsage desc -
Real User Monitoring with Session Replay usage by application
fetch dt.system.events| filter event.kind == "BILLING_USAGE_EVENT" and event.type == "Real User Monitoring with Session Replay"| fieldsAddweb_or_mobile = coalesce(dt.entity.application, dt.entity.device_application),platform = if(isNotNull(dt.entity.application), "Web", else: "Mobile")| dedup event.id| summarize totalUsage = sum(billed_replay_sessions), by:{platform, web_or_mobile}| sort totalUsage desc -
Real User Monitoring Property usage by application
fetch dt.system.events| filter event.kind == "BILLING_USAGE_EVENT" and event.type == "Real User Monitoring Property"| fieldsAddweb_or_mobile = coalesce(dt.entity.application, dt.entity.device_application),platform = if(isNotNull(dt.entity.application), "Web", else: "Mobile")| dedup event.id| summarize totalUsage = sum(billed_property_sessions), by:{platform, web_or_mobile}| sort totalUsage desc
Insights via API
You can query insights via the Environment API – Grail Query. Example DQL queries are provided in Query billing usage events with DQL.
FAQs
Are bounced sessions counted toward RUM consumption?
No. Sessions that include only a single user action (for example, a page load without further interaction) are considered bounced. Bounced sessions are filtered out and do not contribute toward RUM consumption.
How does Dynatrace count sessions when a visit spans multiple applications?
If a user interacts with more than one application during their visit (for example, both a web application and a mobile component), each application counts as one session.
Exception: An interaction with a hybrid mobile application, which spans both mobile and web technologies, is counted as a single session.
When do additional RUM session charges apply for properties?
Each application includes up to 20 properties at no additional cost. Each property beyond these 20 is billed one time for every session in which that property appears.
Does enabling Session Replay increase consumption?
Yes. Sessions with Session Replay enabled are billed according to the Real User Monitoring with Session Replay item on your rate card.
What happens if a session lasts longer than one hour?
Dynatrace counts an additional session every time a new hour of activity begins. For example, a 2.5‑hour visit to the same application counts as three sessions.