Understand and measure consumption for Third-Party Synthetic API Integration (DPS)
- Latest Dynatrace
- Explanation
- 5-min read
Third-Party Synthetic API Integration allows you to ingest synthetic test results from external monitoring providers into Dynatrace. This centralizes availability and performance data from multiple synthetic tools, unifies alerting, and allows you to analyze external synthetic results alongside all other observability data in Dynatrace.
This page explains how consumption is calculated and counted, which can help you forecast, monitor, and control usage.
How consumption is calculated
Consumption is measured in third-party synthetic results, using the Third-Party Synthetic API Integration rate-card item. Each time an external test run sends a result to Dynatrace through the API, Dynatrace counts one third-party synthetic result.
Key terms
- Third-party synthetic result
A third-party synthetic result is a single test execution outcome sent to Dynatrace by an external synthetic vendor. This is based on the total number of results ingested via the Third-Party Synthetic API, counted once per ingested result, independent of configuration, success/failure, location, or frequency.
Counting rules and exceptions
-
Each ingested result counts as one unit, regardless of:
- Which vendor produced the result.
- The type of test.
- Whether the test succeeded or failed.
- How often or where the test executed.
-
If a test run never sends data to Dynatrace, that run doesn't count toward consumption.
-
Example results include:
- Uptime checks.
- API test executions.
- Multi-step synthetic test results.
- Periodic availability checks from external tools.
Estimate your cost
You can estimate your monthly cost by calculating the total number of third-party synthetic results ingested and multiplying this by the list price of $0.001 per third-party synthetic result.
Consumption formula
(# of results sent per test)× (# of executions per hour)× (# of tests)× (# of hours)= Total consumed results
Example
A customer has:
- 20 external synthetic tests.
- Each test runs every five minutes (12 times per hour).
- Each run sends one result.
- The tests are run for 30 days.
Calculation:
1 result per testx 12 executions per hourx 20 testsx 24 hoursx 30 days= 172,800 synthetic results
Multiplied by the unit cost of $0.001 per result, the total cost for synthetic tests in this example month is $172.80.
Understand and manage your consumption
Dynatrace provides various options to help you understand and analyze your organization's consumption of DPS capabilities.
Insights via Account Management
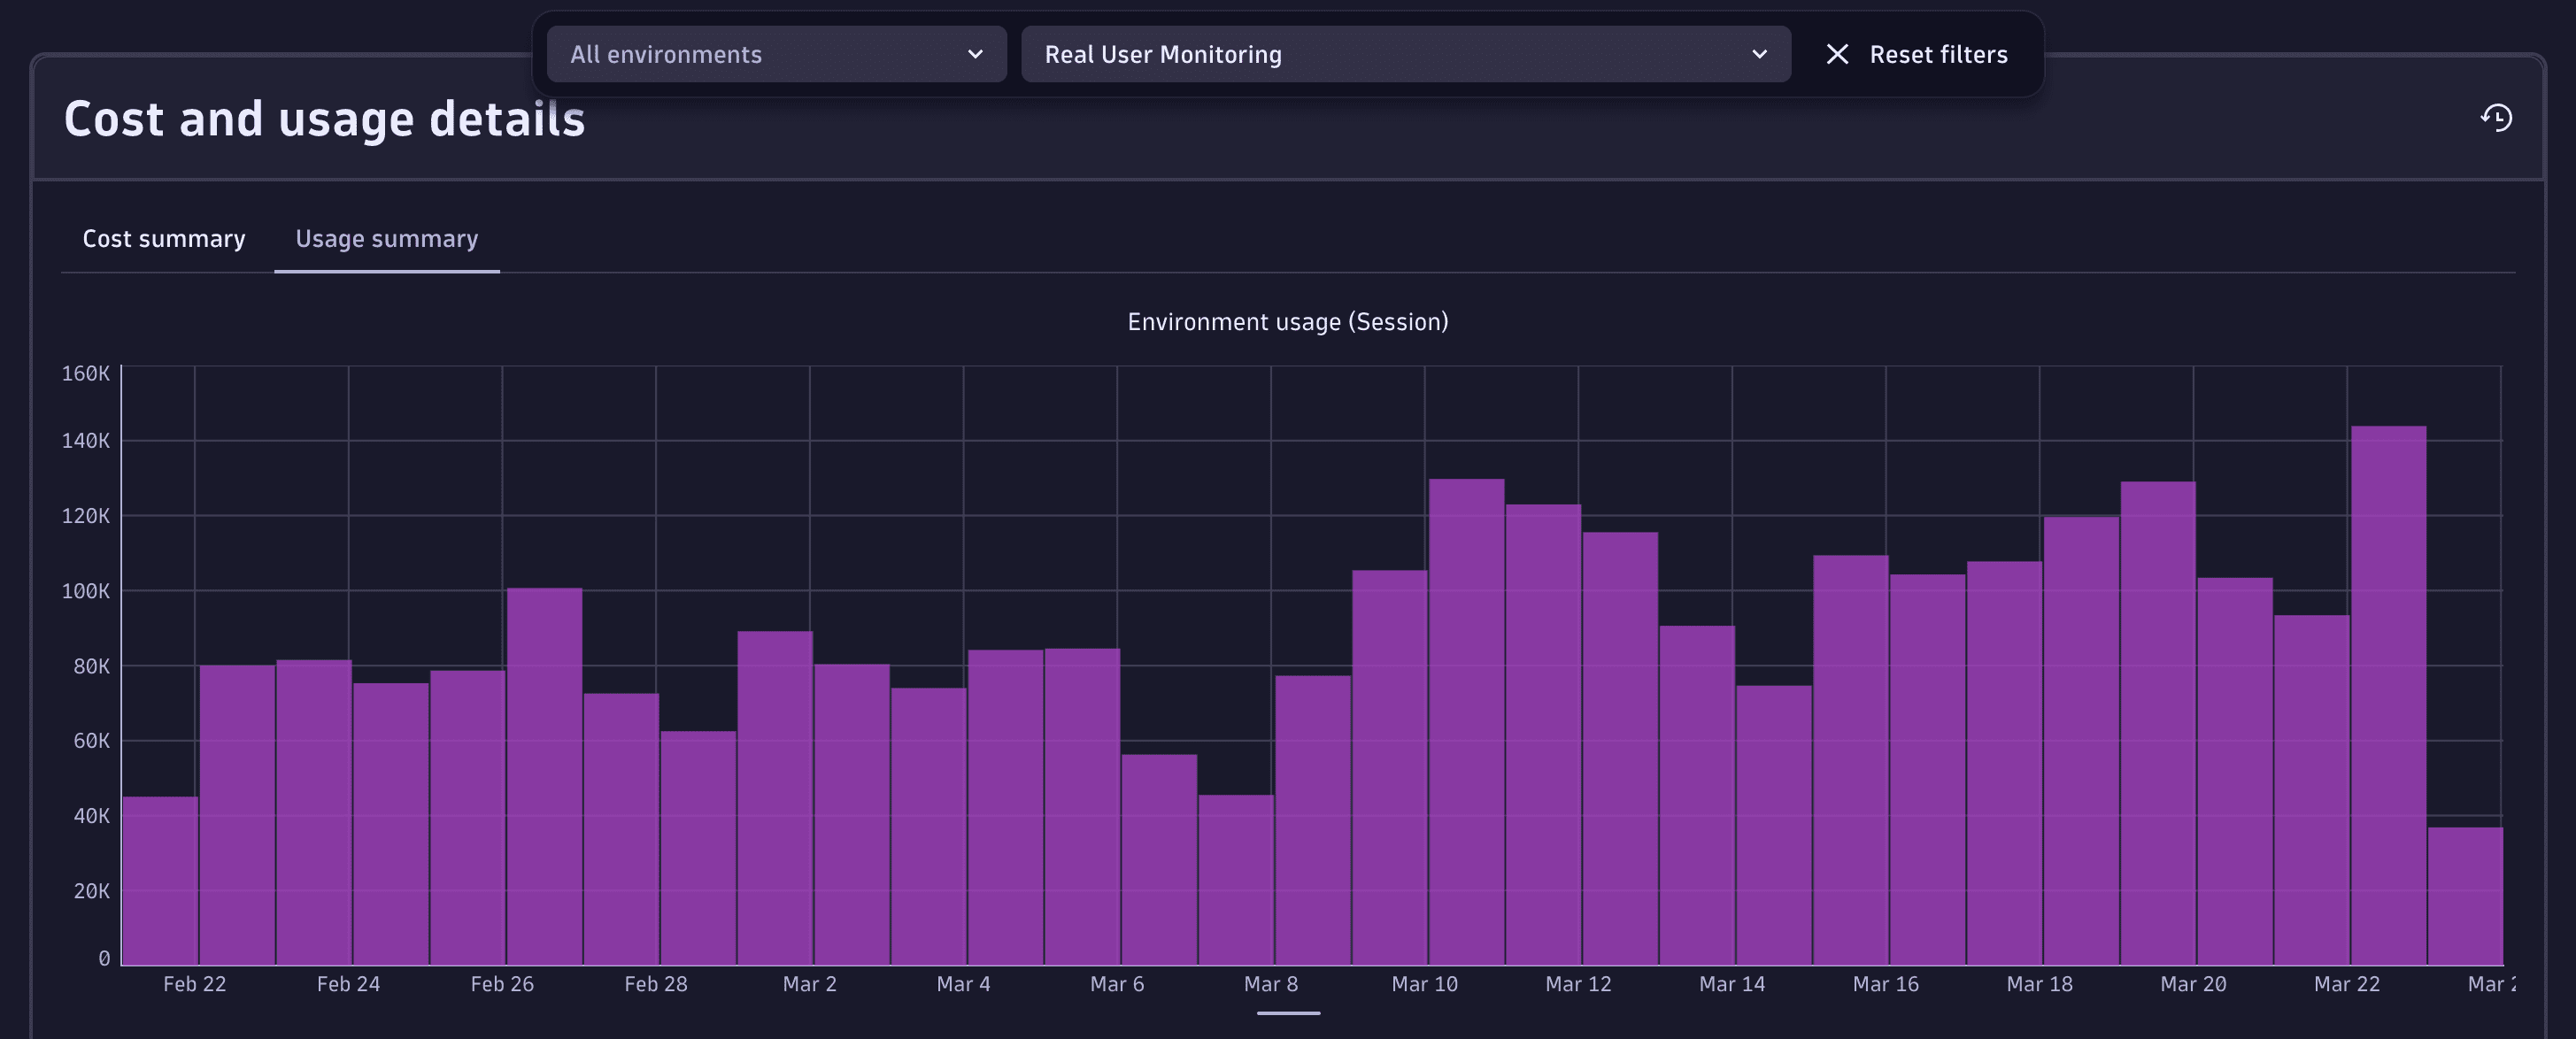
License managers can view usage and costs in Account Management. Go to Account Management > Subscription > Overview > Cost and usage details > Usage summary and select the Third-Party Synthetic API Ingestion capability.
For more information, see Overview (Dynatrace Platform Subscription).
Insights via billing usage events
Billing usage events (BUEs, billing_usage_event) are system events emitted by Dynatrace into the dt.system.events data space.
You can use DQL to query BUEs, and analyze usage and cost for Real User Monitoring capabilities without re-applying billing rules or session-counting logic.
BUEs represent already-calculated, billable usage for DPS capabilities (not any configuration or potential usage), and are aligned with what is shown in Account Management and on invoices. Therefore, they're the recommended data source for understanding related consumption.
Billing usage events contain:
- Which DPS capability was consumed.
- The usage amount that contributes to billing.
- The time window the usage belongs to.
- The entity context the usage is attributed to (for example, an application).
Query billing usage events with DQL
You can use billing usage events as the authoritative source when building cost allocation, usage analysis, or cost transparency views.
For example, aggregate by application to understand which applications contribute most to usage and cost.
Here are some example DQL queries for various use cases. You can use these queries as-is, or modify them to meet your needs.
-
Total usage over time
fetch dt.system.events| filter event.kind == "BILLING_USAGE_EVENT" and event.type == "Third-Party Synthetic API Integration"| dedup event.id| summarize totalUsage = sum(billed_sessions), by:{bin(timestamp, 1d)}
Insights via API
You can query insights via the Environment API – Grail Query. Example DQL queries are provided in Query billing usage events with DQL.
FAQs
Do failed third-party test results count toward consumption?
Yes. Each ingested result is counted once, whether it succeeded or failed.
Does Dynatrace charge per step within a multi-step external test?
No. Dynatrace only charges for the ingest of test execution results. Therefore, it doesn't matter how many steps the external vendor executed to get the result.
What if a third-party test runs but doesn't send its result to Dynatrace?
Only results that are ingested count toward consumption. Missed or unsent runs do not contribute to usage.
Can I control how many results my vendor sends to Dynatrace?
Many external vendors allow you to configure test frequency or conditional reporting. These settings directly influence consumption.