Best practices for optimizing metrics cost
- Latest Dynatrace
- Best practices
- Published Apr 03, 2026
As teams adopt open standards for observability, one key strength of this approach is that you control what data you send to Dynatrace: which metrics you collect, how you filter them, and how they are enriched before export.
However, without deliberate configuration, you may still find that you're ingesting more metric data than necessary. This can add noise and drive up costs.
Dynatrace provides powerful tools to help you filter, refine, and control metric ingestion at the source and in Dynatrace, so your data stays actionable, cost-efficient, and aligned with what your teams actually need to monitor.
Use the best practices on this page to understand, optimize, and manage your metrics costs.
Core concepts
Here is a list of core concepts you should understand before learning how Dynatrace bills for metrics consumption.
| Term | Definition |
|---|---|
Metric | A metric is a named numerical measurement that represents a specific aspect of a system, observed over time |
Dimension | A dimension is a key-value pair used to filter, split, or group metrics |
Metric data point | A metric data point is a single recorded value taken at a specific point in time |
Timeseries | A timeseries is a unique combination of a metric and its dimension values |
Cardinality | Cardinality is the number of unique timeseries a metric produces |
Understand metric ingest
Before optimizing metric ingest, it is important to understand which metrics are ingested and stored in Dynatrace, and how they are distributed across your organization.
The number of ingested metric data points is based on three main factors.
- The number of metrics
- Collection intervals
- Cardinality
Any increase in these factors leads to higher consumption.
For example, a metric split by dimensions (such as service, status_code, and region) creates one timeseries for each distinct combination.
The more combinations, the higher the cardinality, and the more data points generated per collection cycle.
This section explains how to analyze metrics ingest to help you make informed optimization decisions.
All DQL queries can be run in Dynatrace, for example with  Notebooks,
  Dashboards, or
  Workflows.
1. Find high-cardinality cost centers, cost products, or metric sources
Start by identifying which cost centers, cost products, or metrics sources contribute the most to your metric cardinality. This helps pinpoint which business units ingest most metrics, allowing you to target optimization efforts where they will have the greatest impact.
Run the following DQL queries to view the breakdown by cost centers, cost products, or metric sources.
The metrics command scans a maximum of 100,000 series.
If you scan a large amount of data, the results for these queries may be truncated and you won't get the full picture for your environment.
If you reach this limit, use the DQL queries described in Drill down into metric keys to narrow the query scope, for example, by focusing on a particular metric source.
For more information about metrics limits, see DQL metric commands.
If the query returns only null values, Cost Allocation for metrics has not yet been set up.
For more information, see Ensure metrics costs are allocated.
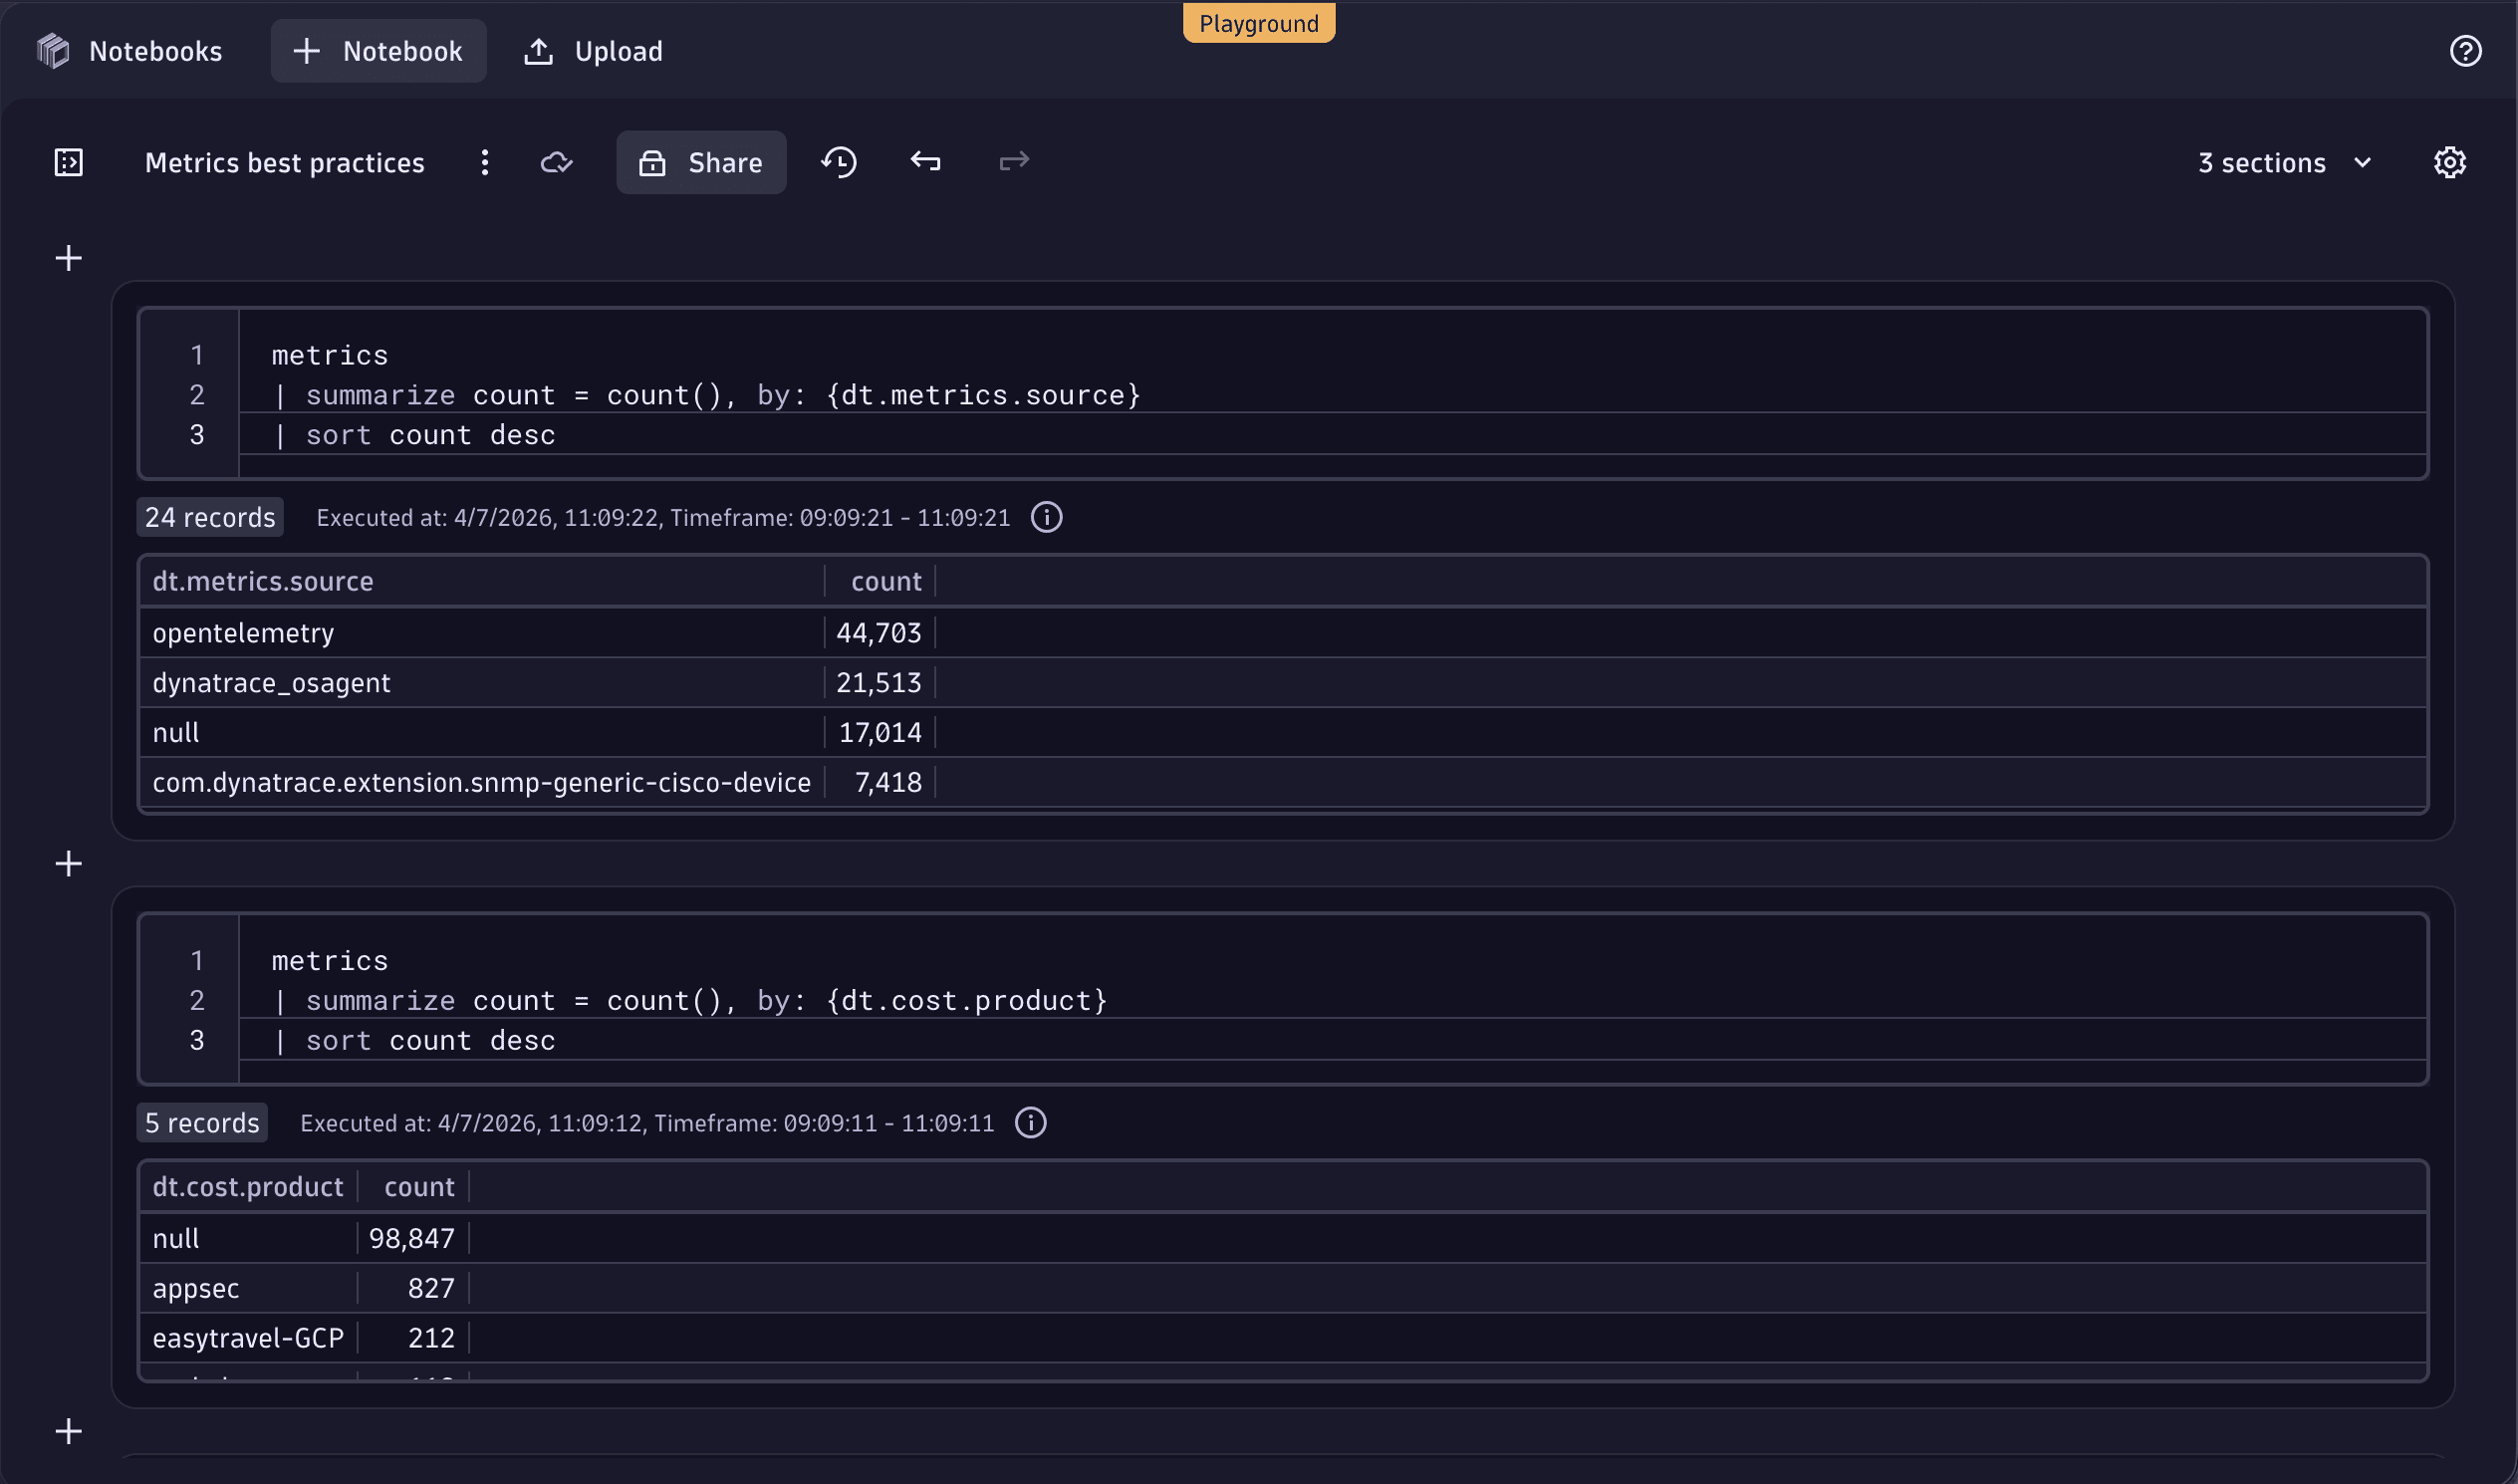
metrics| summarize count = count(), by: {dt.metrics.source}| sort count desc
metrics| summarize count = count(), by: {dt.cost.costcenter}| sort count desc
metrics| summarize count = count(), by: {dt.cost.product}| sort count desc
The following example shows these queries executed in a notebook.
2. Drill down into metric keys
Once you identify high-cardinality attributes, filter by these and examine individual metric keys.
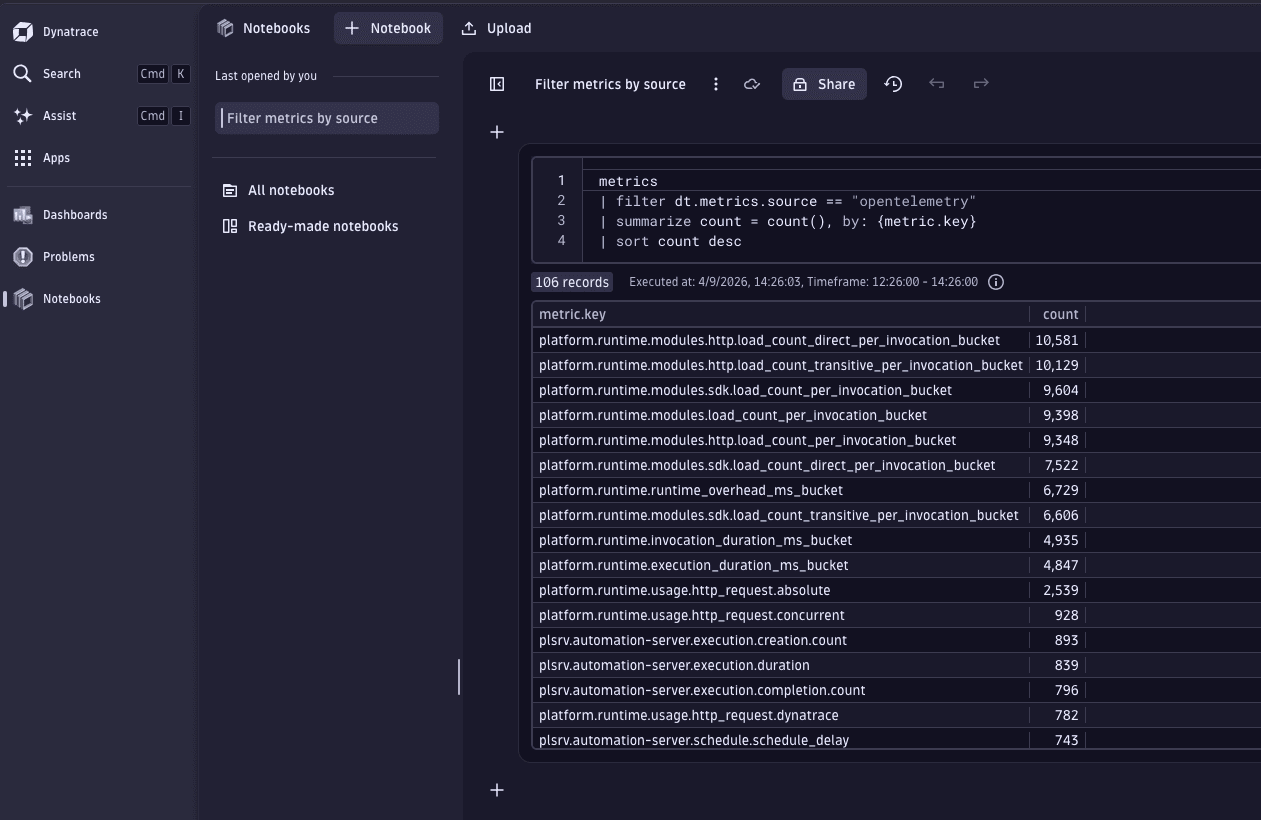
The following DQL examples show how to identify metrics for filtered cost centers, cost products, or metric sources. These queries reveal which specific metrics within the filtered attributes contribute the most to cardinality.
You can also use these filters to limit the amount of scanned data, because the metrics command scans a maximum of 100,000 series.
metrics| filter dt.metrics.source == "metric_source_name"| summarize count = count(), by: {metric.key}| sort count desc
metrics| filter dt.cost.costcenter == "cost_center_name"| summarize count = count(), by: {metric.key}| sort count desc
metrics| filter dt.cost.product == "product_name"| summarize count = count(), by: {metric.key}| sort count desc
3. Analyze a specific metric key
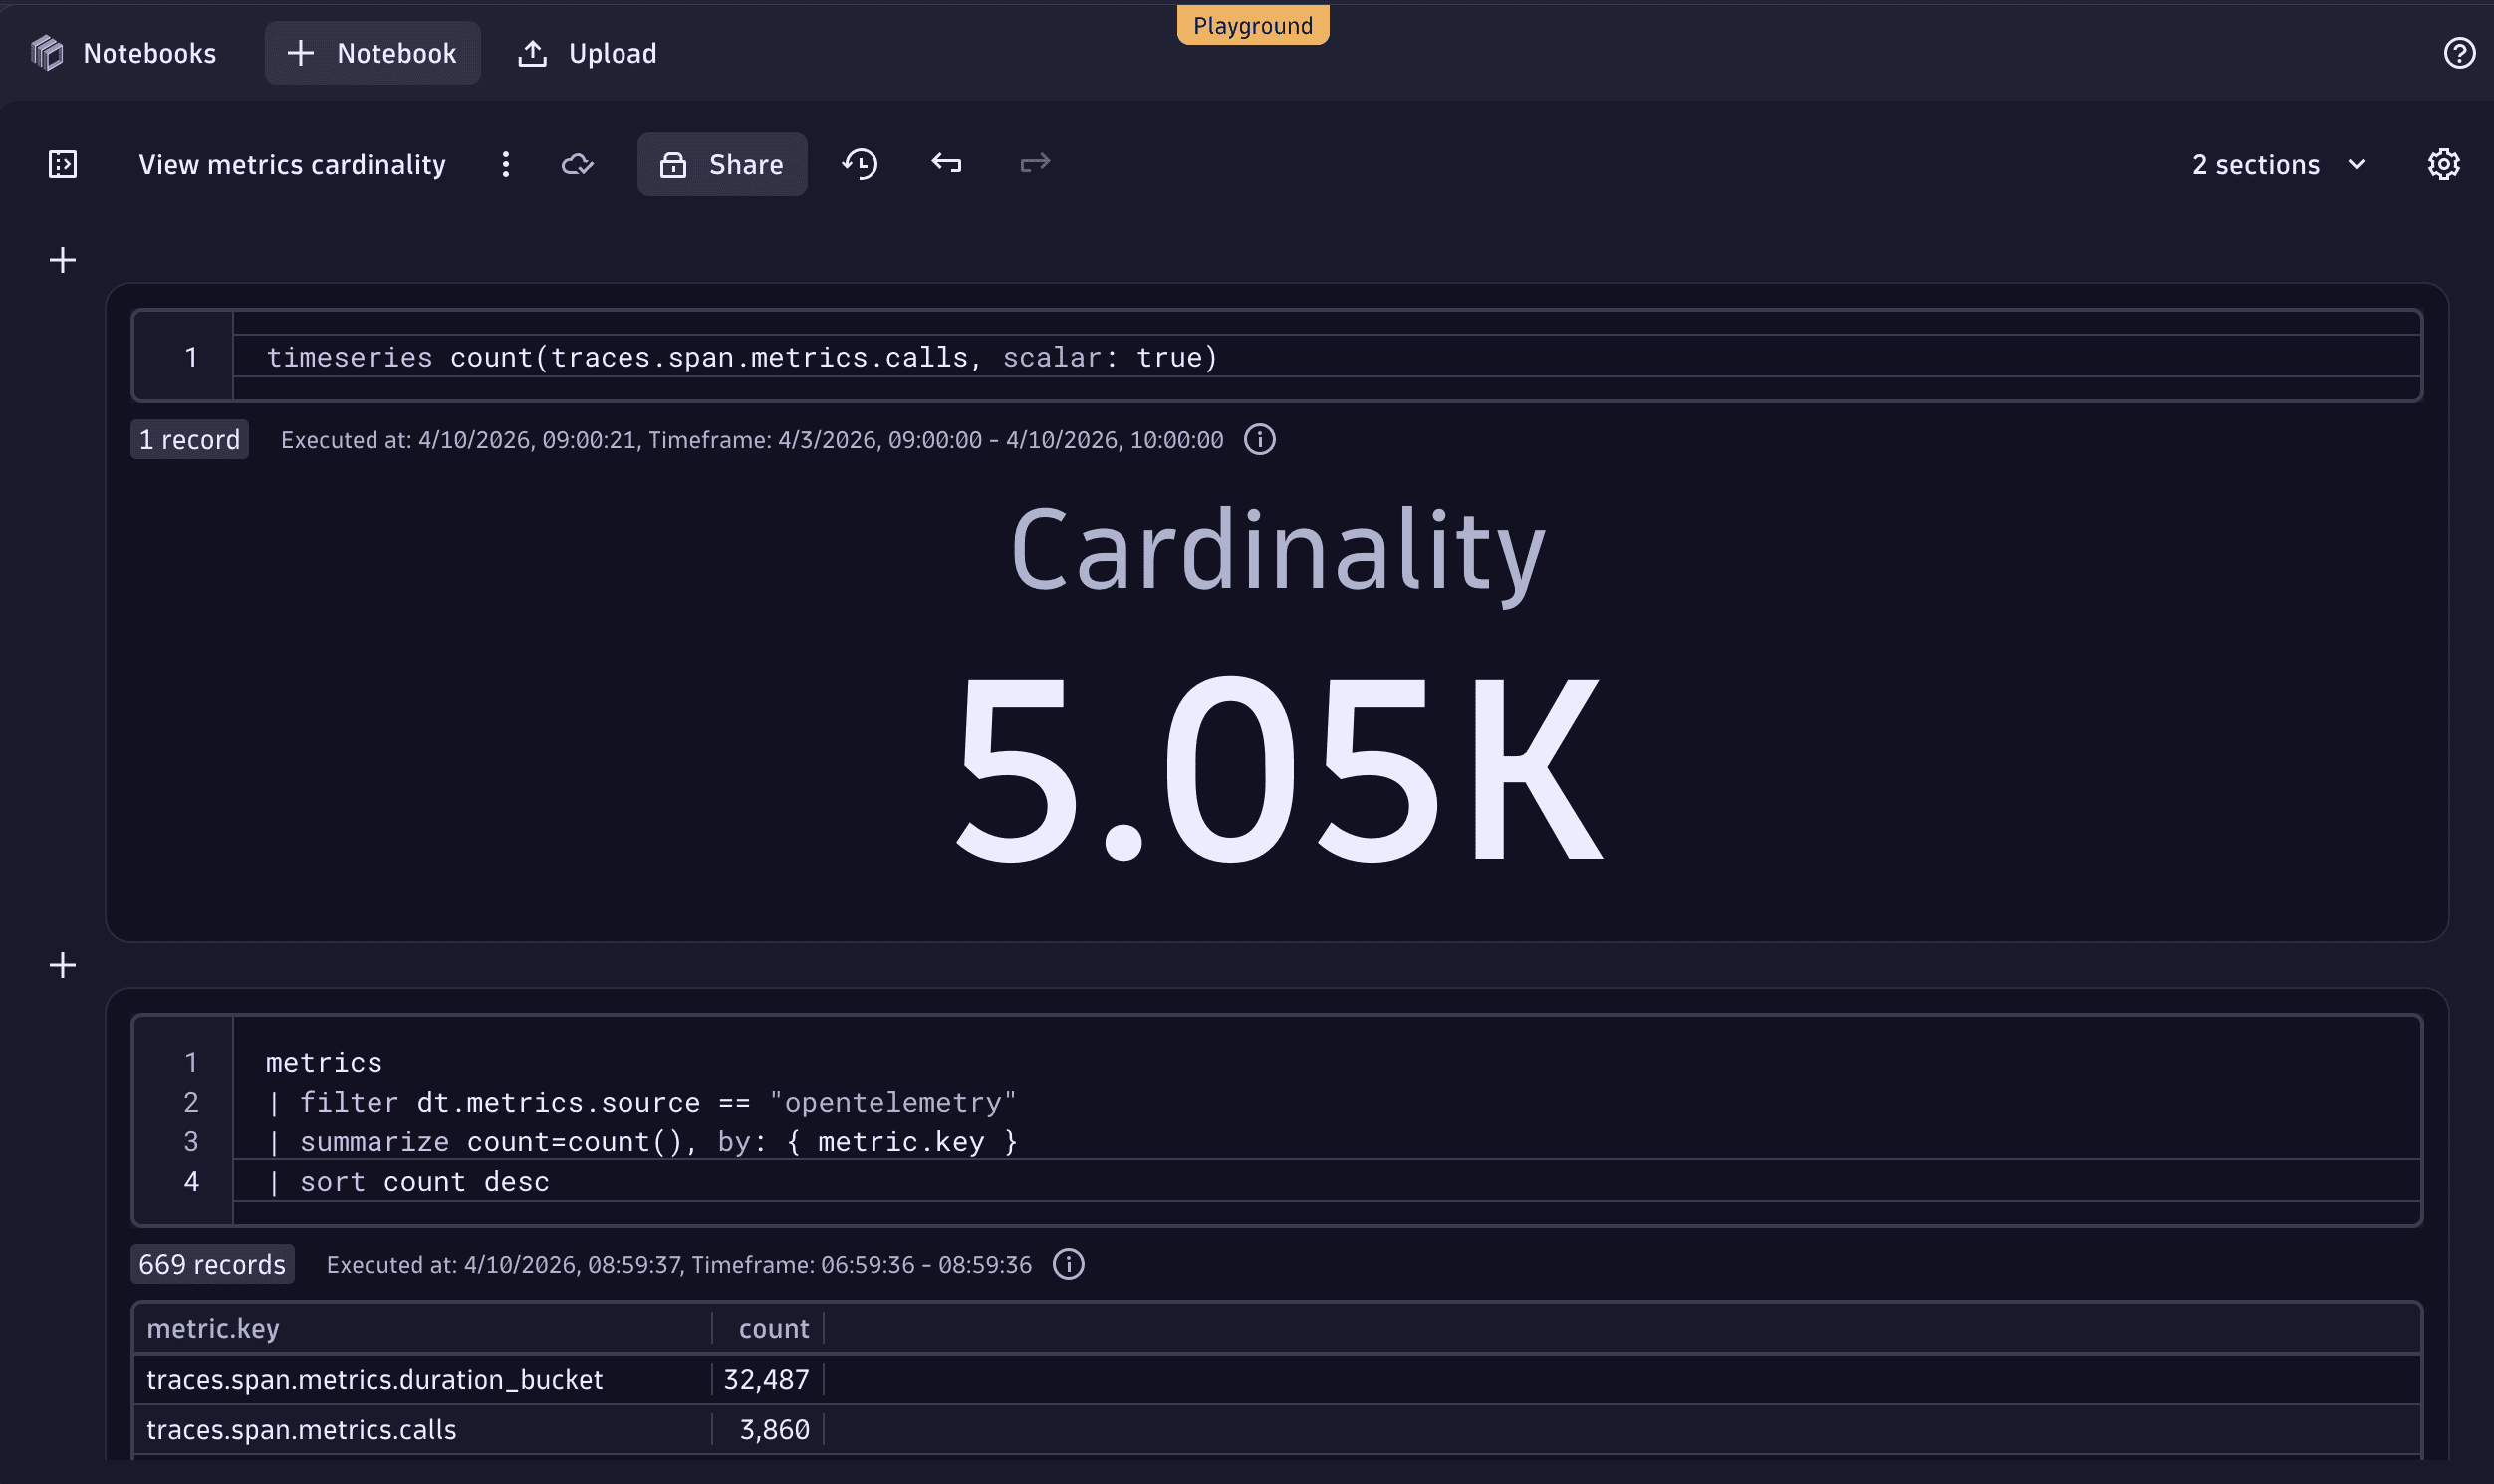
Once you've drilled down with the metrics command, you can use the timeseries command to get the cardinality for a specific key.
timeseries count(metric.key, scalar: true)
For more information, see DQL timeseries examples.
The following example shows the results of this DQL query expressed as a Single value visualization.
Understand metrics ingest via the OTel Collector
If you ingest metrics via the OTel Collector, you can use these specific tips to analyze metric ingest in more detail.
1. Use Dynatrace self-monitoring metrics
Dynatrace provides built‑in self‑monitoring metrics for OTLP metrics ingest. These metrics show how many OTLP data points arrive at the ingest API and provide a high‑level view of how much metric data is being ingested. They can also be used to validate that fewer data points are flowing in after applying filters on the client side or in the Collector.
Available self‑monitoring metrics are described in the table below.
| Description | Metric key |
|---|---|
Number of incoming OTLP data points |
|
Number of accepted data points |
|
Number of rejected data points 1 |
|
Number of OTLP requests 2 |
|
This metric can be split by reason to understand why data points were rejected.
One OTLP request can contain multiple OTLP data points. This metric may not be available in all environments.
2. Use OTel Collector internal telemetry
The Collector provides internal telemetry, which you can use to understand how many metrics are received and how many are exported.
otelcol_receiver_accepted_metric_points: Number of metric data points received by the Collectorotelcol_exporter_sent_metric_points: Number of metric data points exported by the Collector
These metrics are available only if the OTel Collector is configured to export internal telemetry data to Dynatrace. For more information, see OTel Collector self-monitoring.
3. Use the OTel Collector debug exporter
To inspect individual metrics and their attributes, you can use the Collector's debug exporter. This prints metrics directly to the Collector's console and is useful for troubleshooting and validation.
The code block below provides an example that you can integrate into your Collector configuration.
exporters:debug:verbosity: detailedservice:pipelines:metrics:receivers: [otlp]processors: [batch]exporters: [debug, otlp_http/dynatrace]
Optimize cost during ingest
You can reduce your ingest cost by decreasing the number of ingested metric data points.
Optimization can be applied at two levels. Both approaches support the same key best practices, so your choice comes down to your specific needs and preferences.
- In Dynatrace, using OpenPipeline. If you prefer a centralized, unified approach to managing your data pipeline, we recommend OpenPipeline.
- At the source, for example with the OTel Collector. If your use case requires reducing data volume early, before it leaves your network, optimizing at the source is often a better fit.
Bindplane will soon provide new options to optimize metrics at the edge, offering further possibilities to reduce ingest costs.
For more information, see our Community post: Dynatrace to acquire Bindplane to bring control to the telemetry lifecycle
1. Drop metrics
Dropping metrics helps eliminate unused data, such as metrics that you haven't used in the last year.
Although OpenPipeline rules are evaluated during ingest in the Dynatrace cluster, any metrics dropped by these rules (or upstream before ingestion) are neither stored nor retained. As a result, they don’t incur costs related to Metrics - Ingest & Process billing.
Dropping records means they are never persisted. Therefore, they are not recoverable.
Drop metrics in OpenPipeline
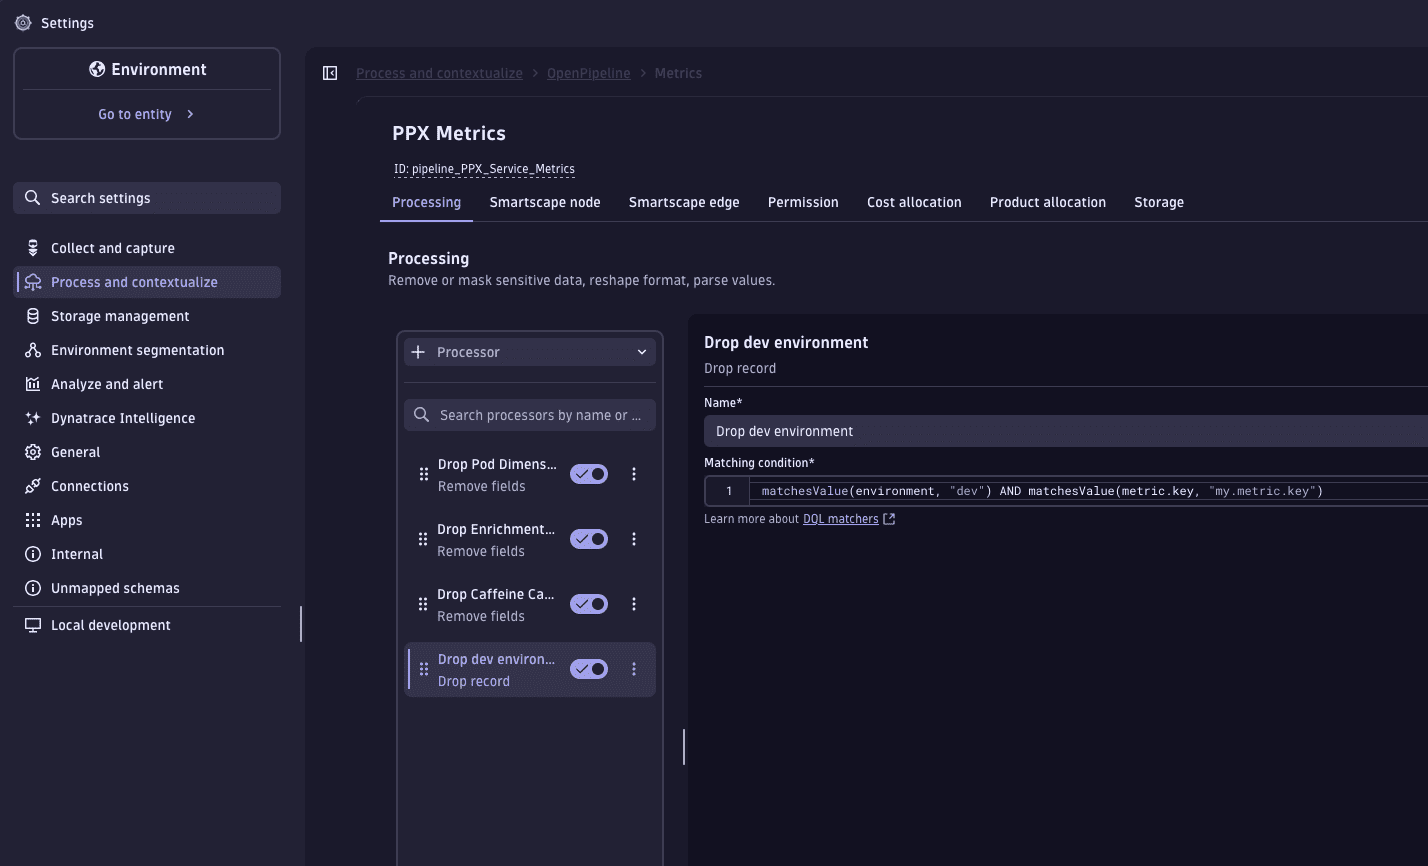
OpenPipeline allows you to drop metrics during the Processing stage by using a Drop record processor. This lets you drop metrics by name, drop data points based on resource attributes, and drop data points based on metric point attributes.
-
Go to Settings > Process and contextualize > OpenPipeline > Metrics.
-
Route the target metrics to a pipeline.
-
In the Processing stage, add a Drop record processor.
-
Set the matching condition to a DQL query that identifies the metrics you want to drop. For example, you can:
-
Drop metrics with specific attributes.
matchesValue(environment, "dev") -
Drop all metrics with specific attributes for specific metric keys.
matchesValue(environment, "dev") AND matchesValue(metric.key, "my.metric.key")
-
The Drop record processor executes for all matches. Every metric record matching the query is dropped and never written to storage.
Drop metrics at the source
Dropping metrics within the OTel Collector prevents specific time series or data points from being ingested altogether.
You can drop metrics at different points in the ingest process:
-
At the data producer. Generally, the closer to the client you drop data, the lower the overall cost. However:
- Depending on your setup, dropping data at the source may difficult to configure.
- Because there is no standardized way to filter metrics across heterogeneous OTLP data producers, this approach may not always be practical.
-
In OTel SDKs. In OTel SDKs, the concept used to drop metrics is called a View. When creating custom metrics, always consider metric cardinality and avoid using volatile dimensions (for example, timestamps or other attributes that change rapidly over time).
-
In the OTel Collector. You can configure your Collector pipeline to drop metrics or individual data points. The
filterprocessor allows you to drop metrics by name, drop data points based on resource attributes, and drop data points based on metric point attributes.Example usages of the
filterprocessor are shown in the code block below.processors:filter/drop-unwanted:error_mode: ignoremetrics:metric:# Drop metrics matching these names- 'IsMatch(name, "my.metric.key")'datapoint:# Drop datapoints with specific attributes- 'attributes["environment"] == "dev"'# Or drop datapoints with specific attributes for specific metric names only.- attributes["environment"] == "dev" and metric.name == "my.metric.key"For more information, see Transform and filter data with the OTel Collector.
2. Reduce metric cardinality
High-cardinality dimensions, such as user IDs or request IDs, significantly increase metric storage requirements. Removing a high-cardinality dimension reduces the number of stored timeseries and can lower cost.
Keeping dimensions meaningful and bounded is critical for managing cost and performance.
Reduce cardinality in OpenPipeline
In OpenPipeline metrics processing, metric dimensions are stored as fields on the record. When you remove a field from a record, that dimension is not ingested for the given metric.
While this preserves metric-level rollups, and rollups by remaining dimensions, it removes per-value data for the removed dimension.
You can use either a DQL processor or a Remove fields processor.
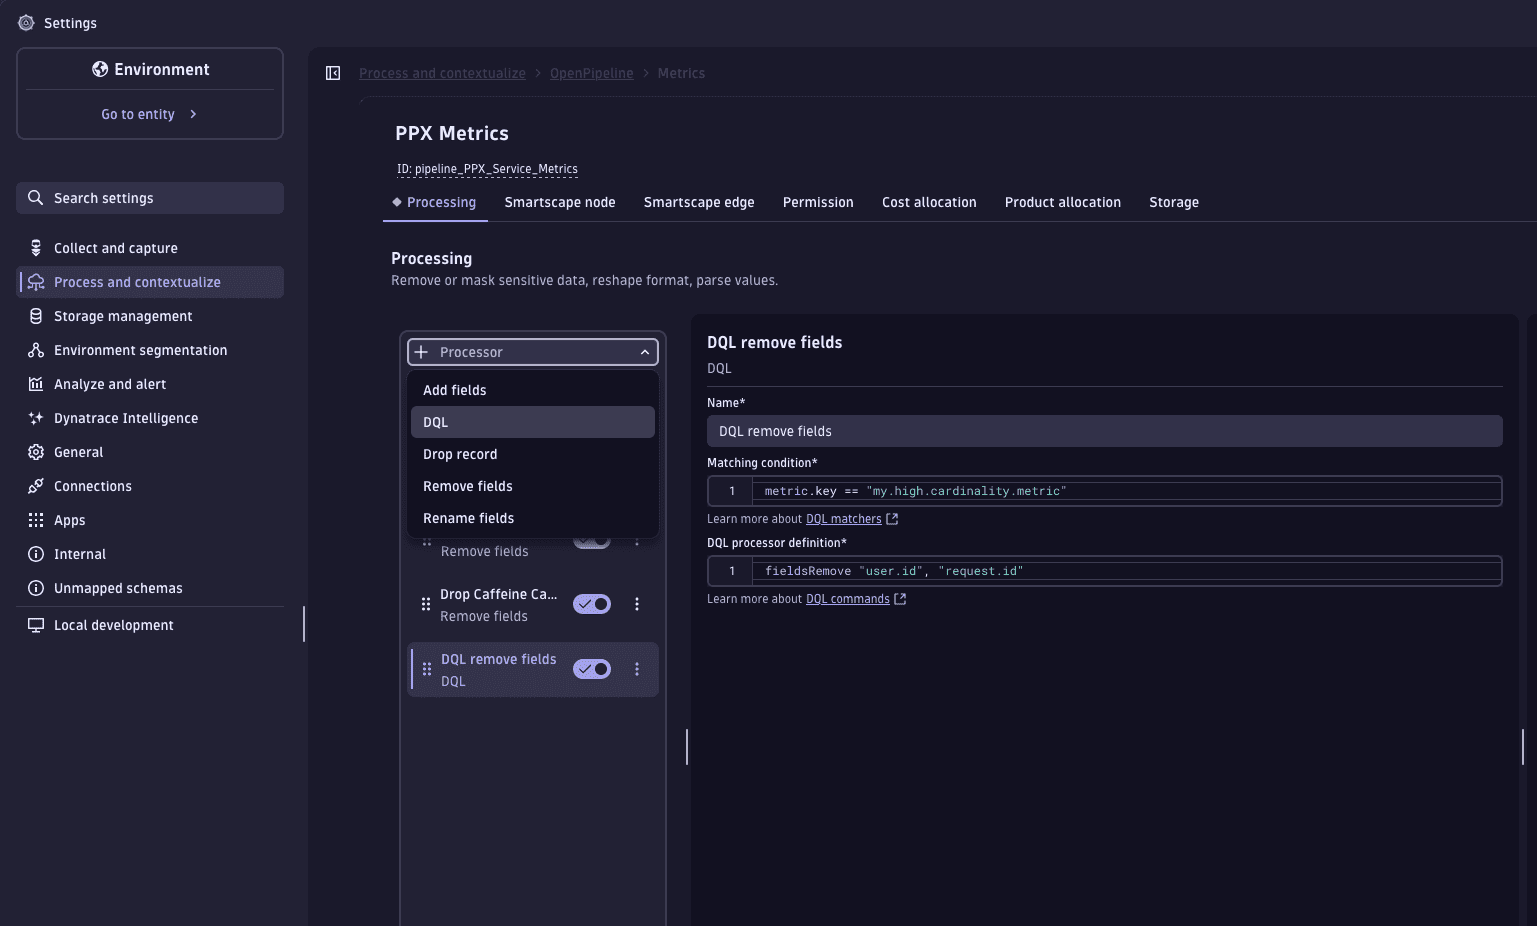
To use a DQL processor:
- Go to Settings > Process and contextualize > OpenPipeline > Metrics.
- Route the target metrics to a pipeline.
- In the Processing stage, add a DQL processor.
- For Matching condition, set the matcher to target the relevant metrics.
metric.key == "my.high.cardinality.metric"
- For DQL processor definition, specify the high-cardinality dimension fields to remove, such as
user.id, orrequest.id.fieldsRemove user.id, request.id
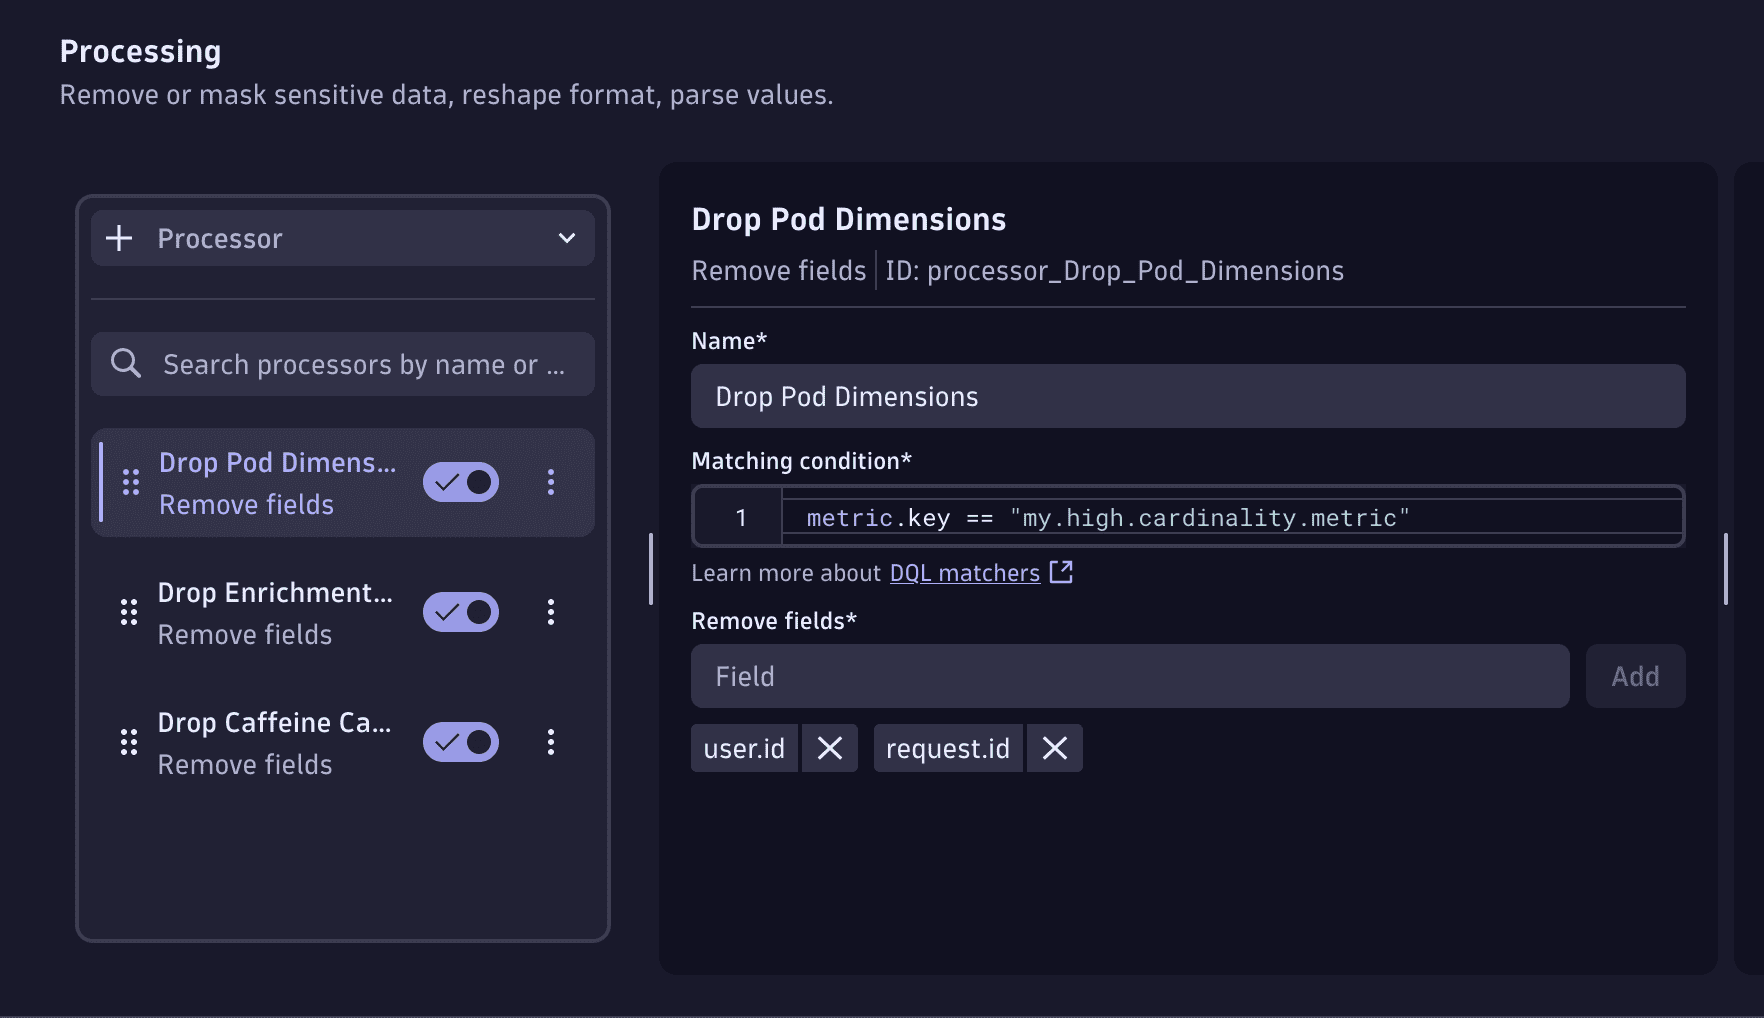
To use a Remove fields processor:
- Go to Settings > Process and contextualize > OpenPipeline > Metrics.
- Route the target metrics to a pipeline.
- In the Processing stage, add a Remove fields processor.
- For Matching condition, set the matcher to target the relevant metrics.
metric.key == "my.high.cardinality.metric"
- For Remove fields, enter the name of a high-cardinality dimension field that you want to remove, such as
user.idorrequest.id. Then, select Add to add the field. You can add multiple fields in one processor.
Reduce cardinality at the source
You can use the OTel Collector to remove unwanted attributes from metrics before ingestion.
To do this, use the transform processor to remove high-cardinality attributes such as user.id and request.id at the data-point level.
You can integrate the following example code into your Collector configuration.
processors:transform:metric_statements:- context: datapointstatements:- delete_key(attributes, "user.id")- delete_key(attributes, "request.id")
3. Set reasonable ingest intervals
To reduce metric resolution and granularity, adjust the collection interval at the source before data reaches Dynatrace.
Select metrics with longer ingest intervals carefully to ensure they still meet monitoring and analysis requirements. The following metrics might be good candidates for reduced ingest intervals.
- Less-critical metrics
- Longer timeframes, such as hours or days
- Metrics that change slowly over time, such as disk usage
If a metric is sent to Dynatrace every five minutes, only one measurement is collected and stored for each five‑minute interval.
For metrics collected at intervals shorter than one minute, Dynatrace aggregates the incoming measurements into fixed one‑minute buckets for efficient storage and querying. Therefore, each timeseries is billed for no more than one data point per minute.
Longer ingest intervals can introduce gaps when you view data at one‑minute resolution. This can impact existing alerting setups.
Manage cost
1. Continuously validate metrics ingest
To ensure reliable, cost‑efficient, and stable observability data, continuously validate the cardinality and ingest intervals as part of your CI/CD (SDLC) processes. Changes in instrumentation or configuration can unintentionally introduce excessive cardinality, overly frequent metric collection, or shifts in data behavior. All of these can increase ingestion costs.
You can use Dynatrace to automate these checks. Validate DQL queries through a Site Reliability Guardian (SRG) integrated into development workflows, which helps detect data anomalies early. SRG evaluations can alert when new code or configuration changes modify cardinality, scraping intervals, or other aspects of the telemetry profile. For more information, see Site Reliability Guardian.
Continuous validation creates a proactive feedback loop: teams can correct instrumentation or adjust their OpenTelemetry configuration before changes progress to production.
2. Ensure metrics costs are allocated
You can allocate metrics ingest costs to specific cost centers or products.
To do this, enrich your metrics ingest with Cost Allocation attributes (dt.cost.costcenter or dt.cost.product) as metadata.
For more information, see Set up Cost Allocation.
3. Validate the business value of metrics ingest
Validate the business value of each metric before ingestion. Keep only metrics that support defined use cases to minimize data point volume and reduce cost.