Dynatrace SaaS release notes version 1.249
- Latest Dynatrace
- Release notes
- Published Aug 12, 2022
Breaking changes
Improved detection of DynamoDB requests
Apps & Microservices | Services
With the new DynamoDB service detection, service requests previously detected as opaque web requests are now detected as DynamoDB requests.
New features and enhancements
Export data to CSV from Distributed traces and Multidimensional analysis pages
Cross solutions | Data Explorer and dashboards Apps & Microservices | Distributed traces
You can now export data in a comma-separated values (CSV) file from the following pages:

Heatmaps can now have thresholds
Cross solutions | Data Explorer and dashboards
You can now set thresholds for a heatmap visualization.
Dashboard subscription workflow and security improved
Cross solutions | Data Explorer and dashboards
When you are subscribed to a dashboard and you open the dashboard link from the scheduled email, you now see the public version of the dashboard, like an anonymous user would see it. To see the dashboard based on your Dynatrace permissions, you need to sign in after opening the dashboard link.
New header and navigation panel for unified analysis pages
Cross solutions | Unified analysis
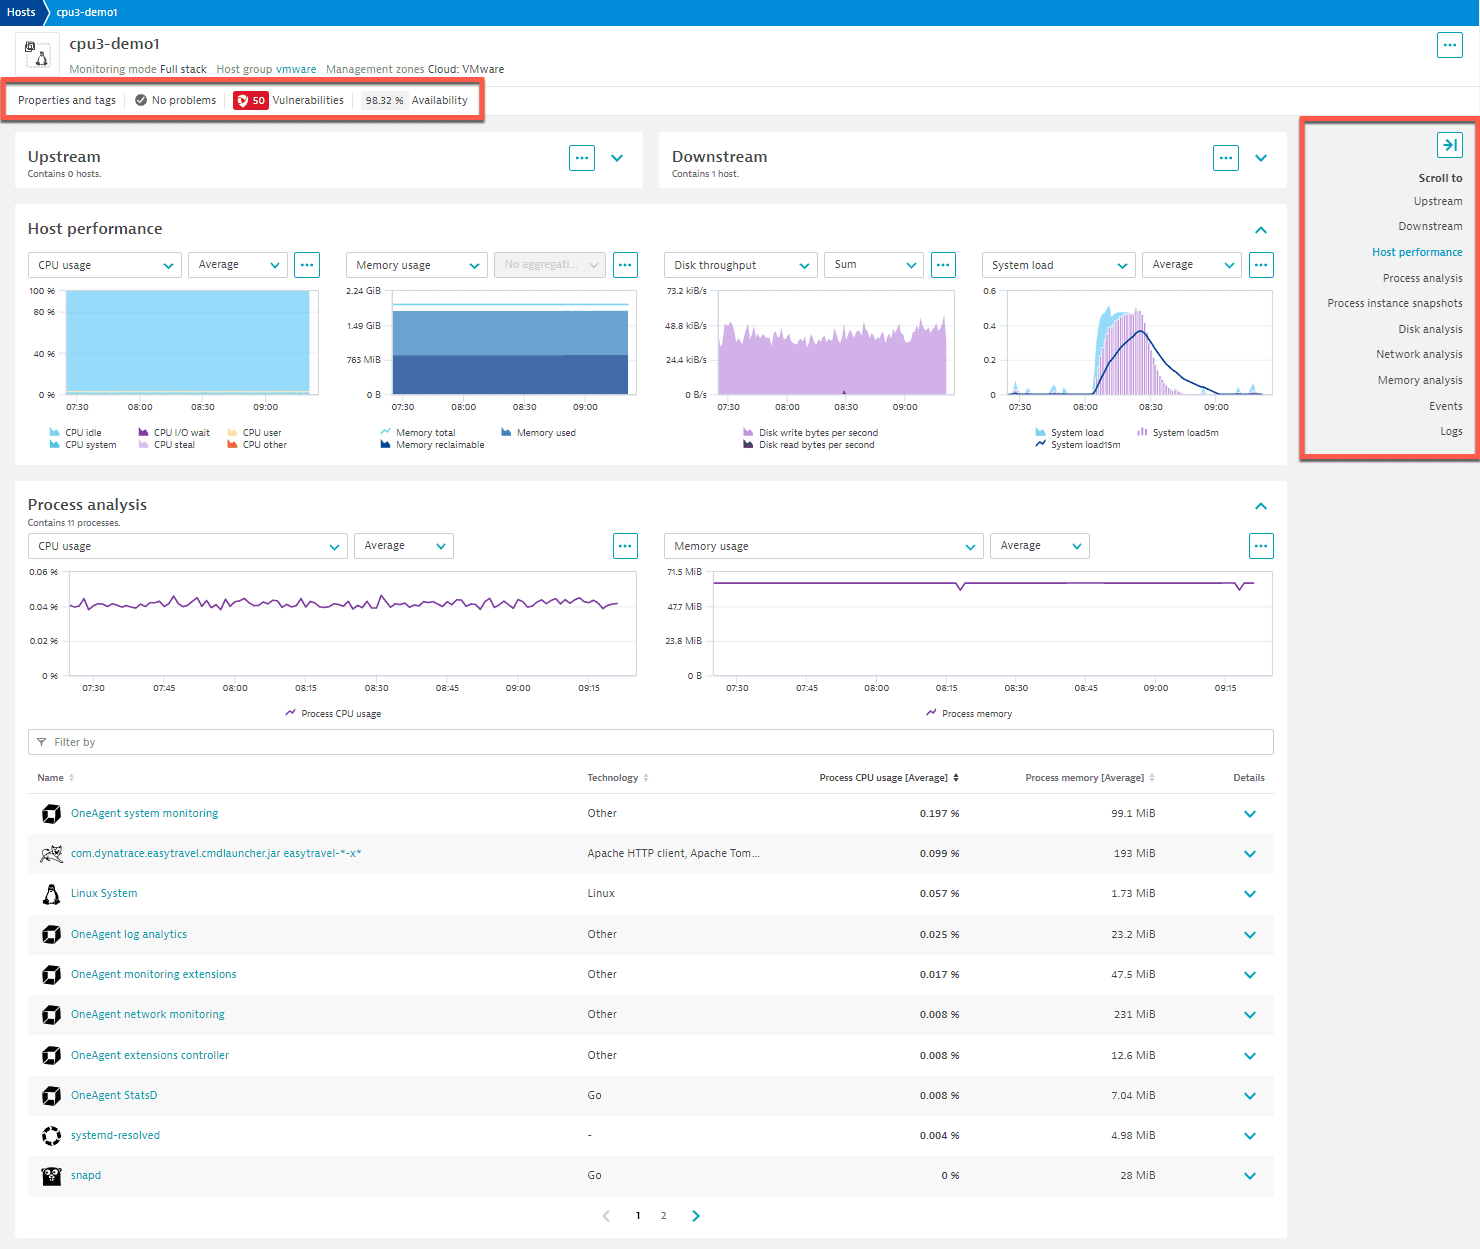
We've significantly decluttered the top of unified analysis pages such as the host overview pages, Kubernetes pages, queue pages, container pages, and domain-specific unified analysis pages.
-
We moved details about properties and tags, problems, vulnerabilities, and availability to a newly introduced notifications bar. This ensures that the top of each unified analysis page is dedicated to viewing the health of an entity at a glance.
-
The anchor buttons that used to function as navigation are now replaced by a dedicated table of contents on the right side of each unified analysis page. This new navigation concept allows you to quickly switch between sections on the page. For smaller screen resolutions, you can toggle display of the navigation panel.

Extended vulnerability tracking
Application Security | Application Protection
On the details page of an entity (process, host, or Kubernetes cluster/workload), besides third-party vulnerabilities, you can now also track the most critical code-level vulnerabilities related to the entity.
On-the-fly validation for SLO timeframes
Cloud Automation | Service-level objectives
When you create or edit a service-level objective, an error message is now displayed for invalid values entered in the timeframe filter.
Feature sets and metrics in Dynatrace Hub
Infrastructure Monitoring | Extensions
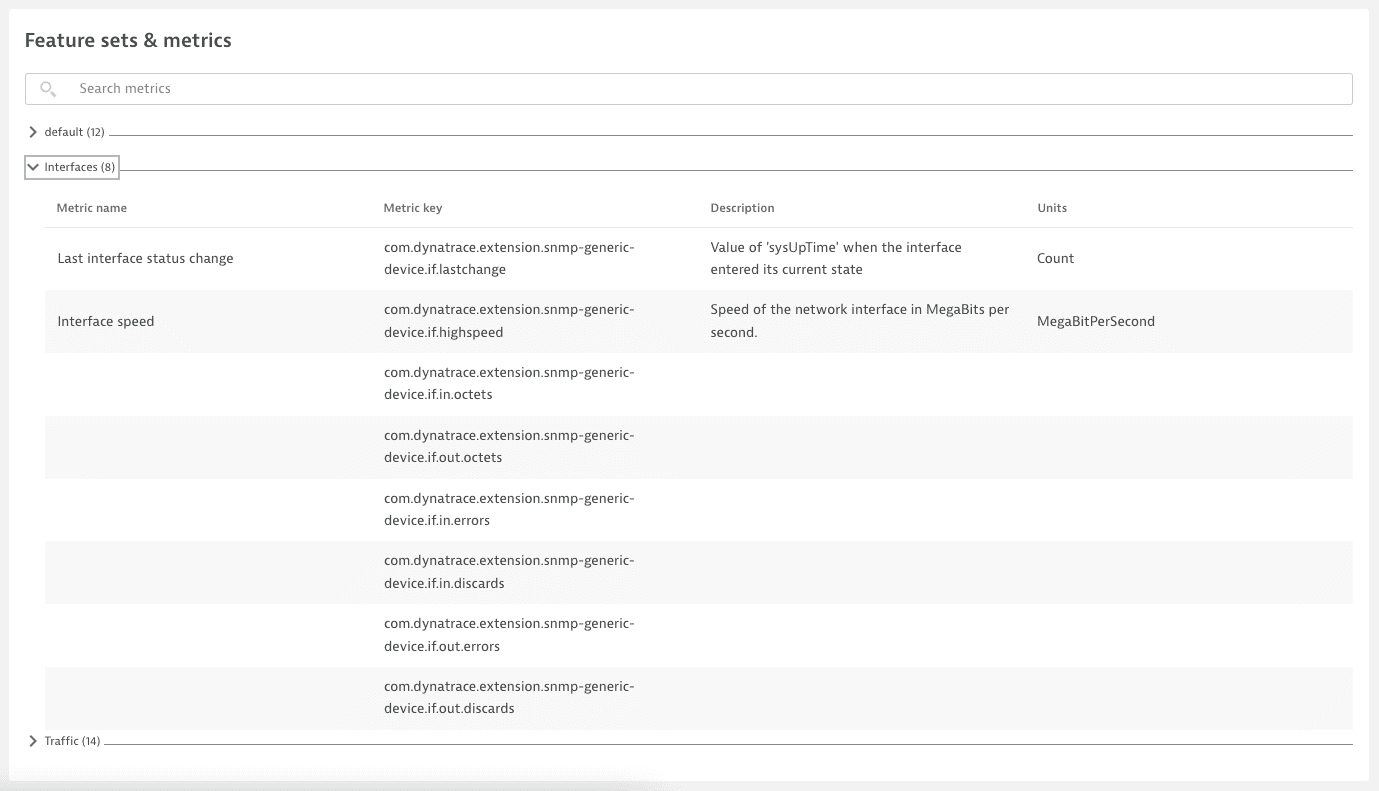
Extensions 2.0 pages in Dynatrace Hub now contain a section with feature sets and metrics defined for an extension. You can also filter the metrics based on the metric name and key.

New host page design is now the default
Infrastructure Monitoring | Hosts
The redesigned host page is now the default.
Dynatrace API
To learn about changes to the Dynatrace API in this release, see Dynatrace API changelog version 1.249.
Resolved issues
General Availability (Build 1.249.120)
The 1.249 GA release contains 9 resolved issues.
Cluster
- Resolved issue causing missing executions for an event filter that matches many events. (APM-381854)
- Resolved issue with incorrect default baselining settings for alerting, which resulted in incorrect baseline calculations and no alerting. (DAVIS-1788)
- Added check for null values to resolve null pointer exception. (APM-382933)
- Links to log viewer are now handled correctly (resolves `Angular Exception...`). (APM-382549)
- It is now possible to mute/unmute a request from the service details page with only IAM permissions. (TI-2540)
- Email address for a remote access request is now displayed correctly in all cases. (APM-383155)
- Fixed a problem where certain remote environments could not be used for the cross environment tracing feature. (TI-2967)
- The log viewer now displays an accurate sampling ratio when available. (APM-377452)
- Key requests are now displayed on the key requests list only if they're currently marked as key requests (deleted key requests no longer listed). (TI-2705)
Update 129 (Build 1.249.129)
This is a cumulative update that contains all previously released updates for the 1.249 release.