Ingest Microsoft Defender for Cloud security events
- Latest Dynatrace
- How-to guide
Prioritize Defender for Cloud findings using runtime application context.
Get started
Overview
Dynatrace integration with Microsoft Defender for Cloud CNAPP platform allows users to unify and contextualize vulnerability findings across DevSecOps tools and products, enabling central prioritization, visualization, and automation of security findings.
In the initial version of this integration, we bring container image vulnerability assessments (part of the Microsoft Defender for Containers plan), powered by Microsoft Defender Vulnerability Management capabilities.
Use cases
-
Visualize and report your current security posture and trends around security findings across environments with
 Dashboards.
 -
Analyze and prioritize security findings across multiple tools and products uniformly with
 Notebooks.
 -
Create notifications and tickets for critical security findings with
 Workflows.
 -
Use security findings as an additional dimension for threat hunting and incident forensics using
 Investigations.
Requirements
See below for the Microsoft Defender for Cloud and Dynatrace requirements.
Microsoft Defender for Cloud requirements
Dynatrace requirements
-
Permissions:
- To query ingested data:
storage:security.events:read.
- To query ingested data:
-
Tokens:
- Generate an access token with the
openpipeline.events_securityscope and save it for later. For details, see Dynatrace API - Tokens and authentication.
- Generate an access token with the
Activation and setup
- In Dynatrace, open Hub.
- Look for Microsoft Defender for Cloud and select Install.
- Select Set up, then select Configure new connection.
- Follow the on-screen instructions to set up the ingestion.
Details
How it works
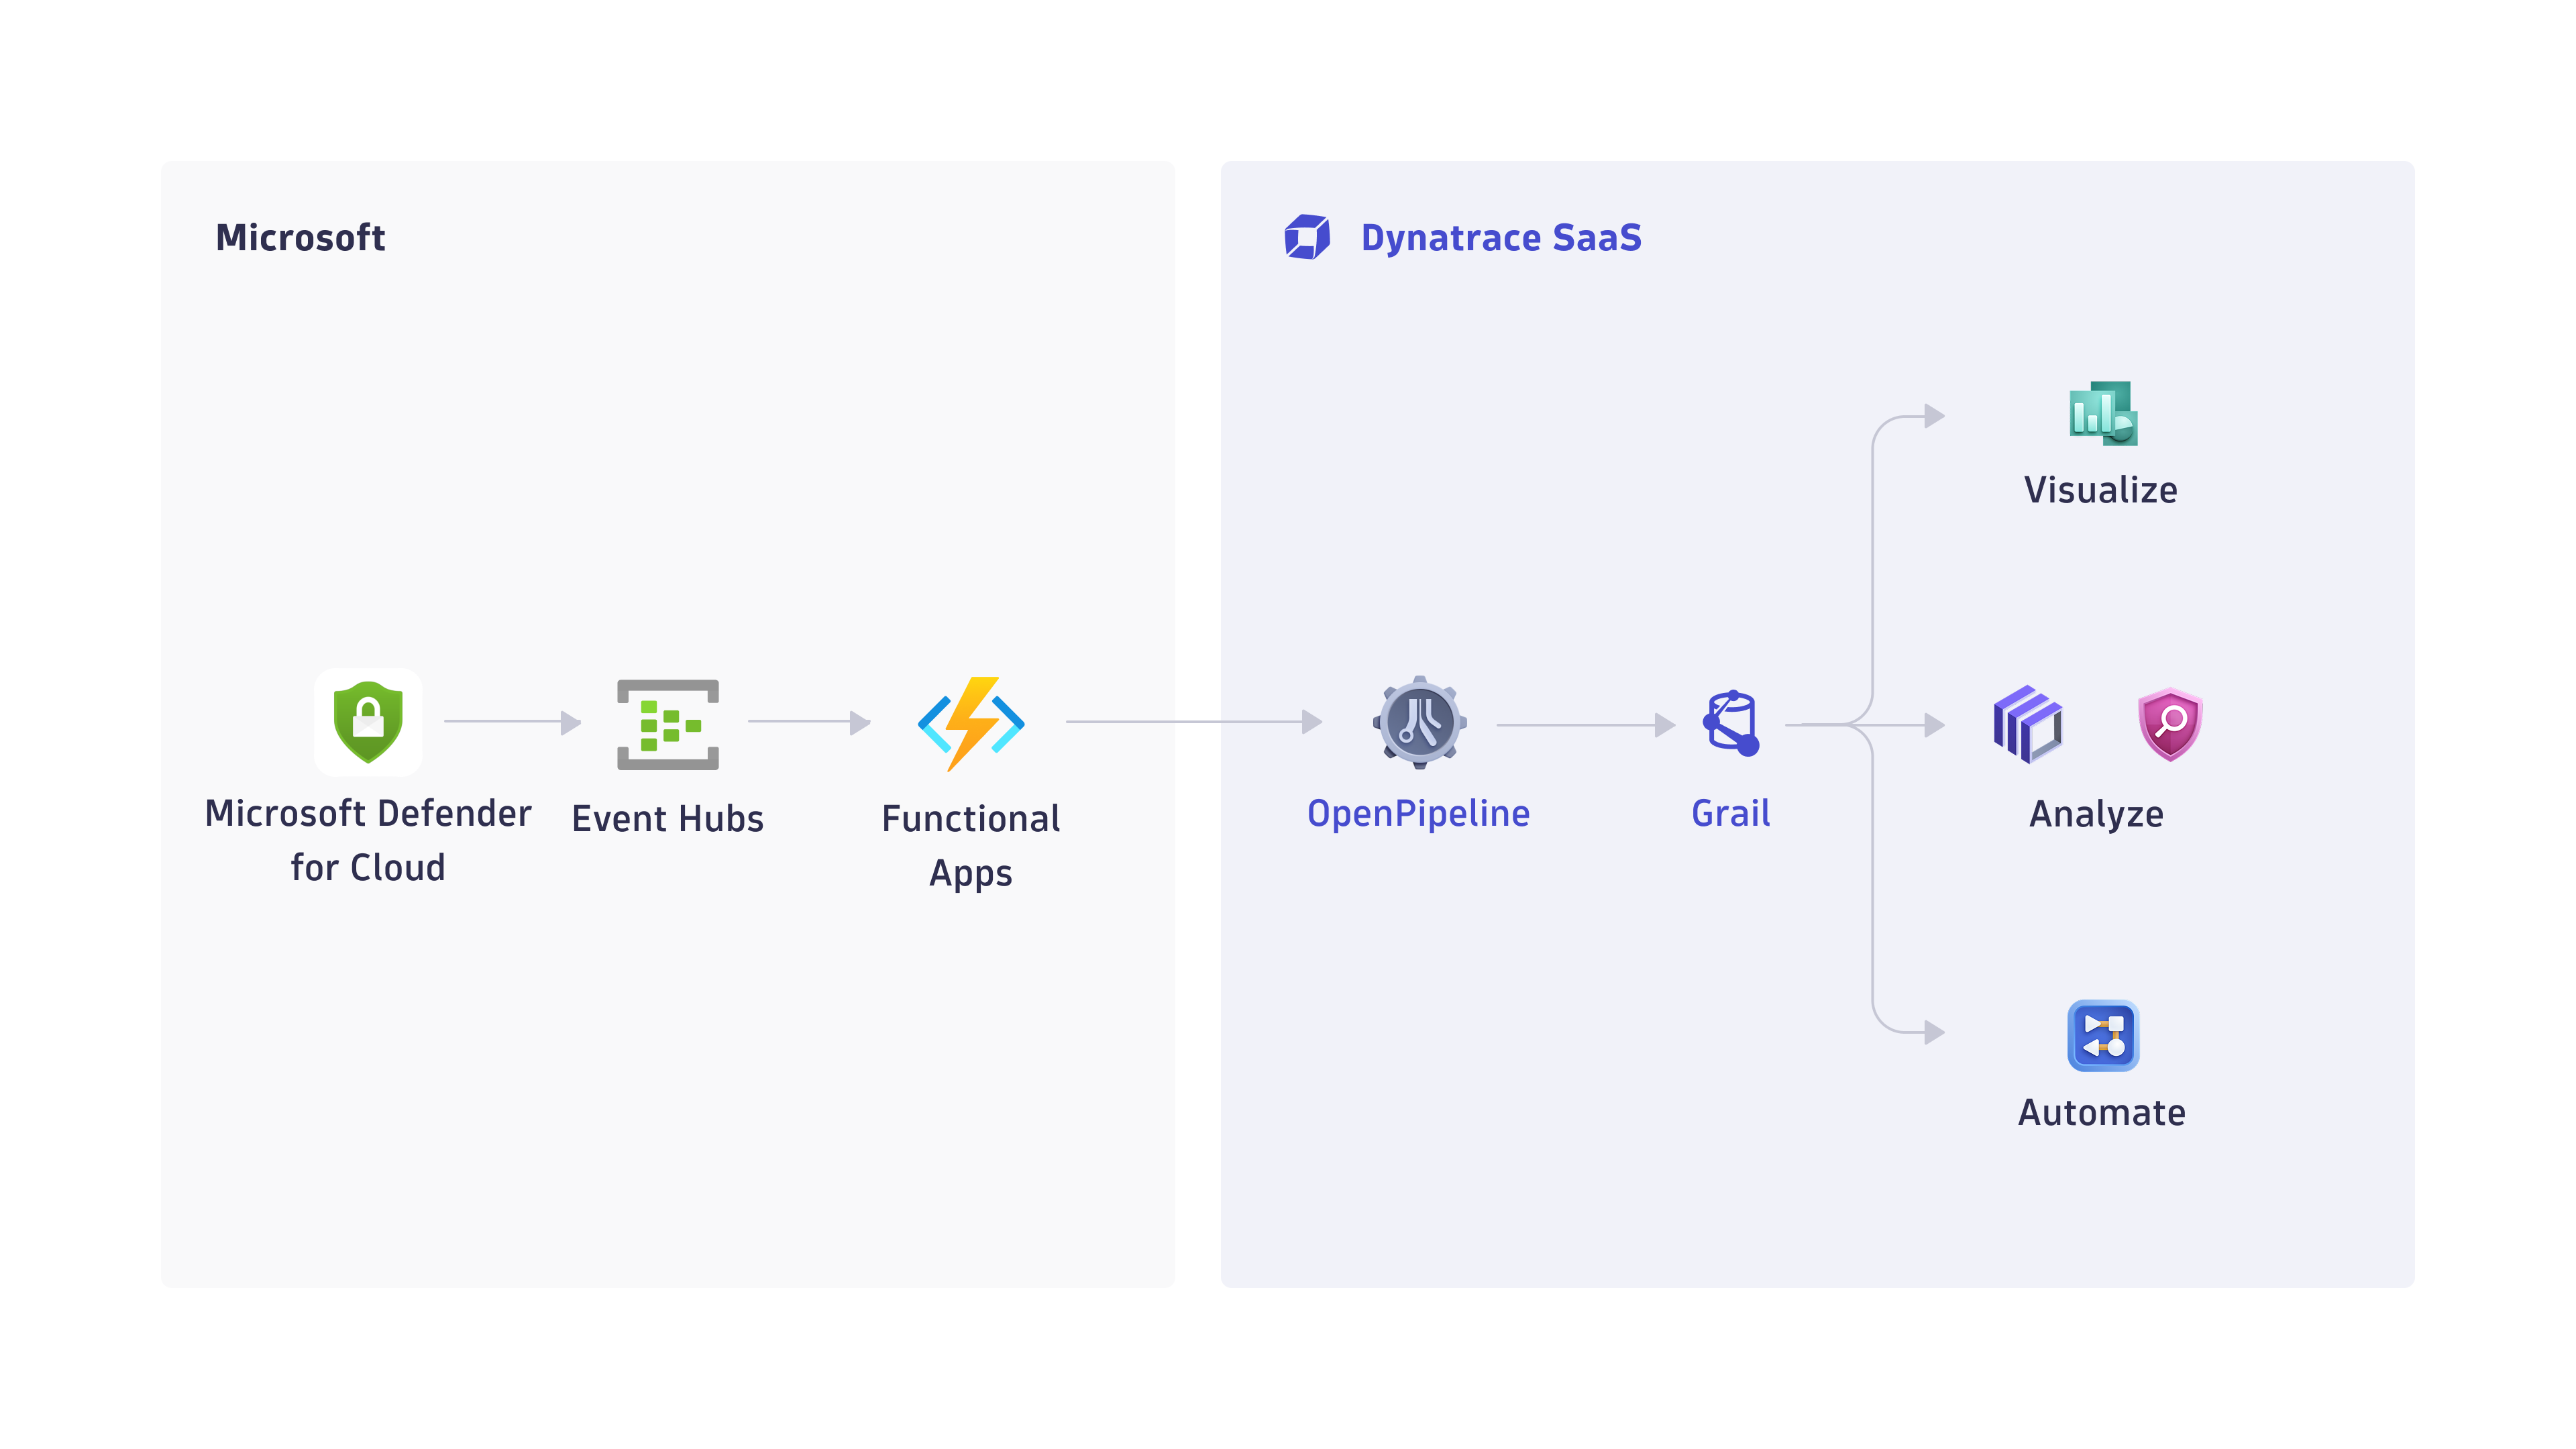
1. Events are ingested into Dynatrace
-
Microsoft Defender for Cloud continuously exports security findings to Azure Event Hubs.
-
An Azure Function app pre-processes the events and sends them to Dynatrace, taking advantage of the OpenPipeline dedicated security events ingest endpoint.
2. Security findings are processed and stored in Grail
-
The fetched data is mapped to the Dynatrace Semantic Dictionary.
-
Data is stored in Grail in a unified format, in a default bucket called
default_securityevents. For details, see Built-in Grail buckets.
Monitor data
Once you ingest your Microsoft Defender for Cloud data into Grail, you can monitor your data in the app (in Dynatrace, go to Settings, then search for and select Microsoft Defender for Cloud).
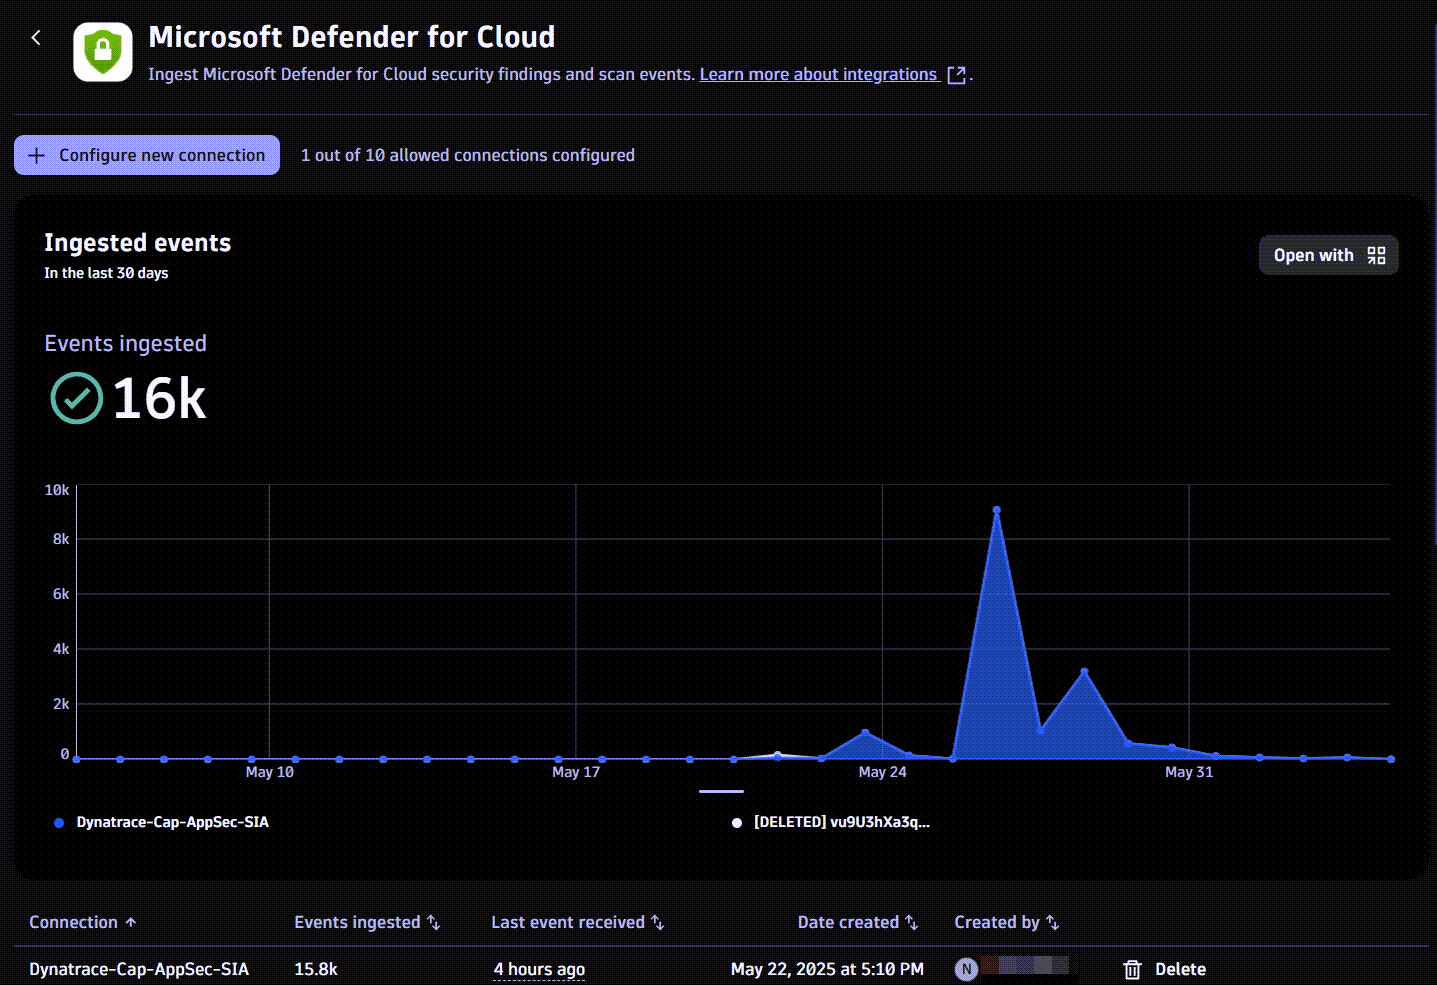
You can view
-
A chart of ingested data from all existing connections over time
- Available actions: Query ingested data
-
A table with information about your connections
- Available actions: Delete connection
Visualize and analyze findings
You can create your own dashboards or use our templates to visualize and analyze container vulnerability findings.
- In Settings, open Microsoft Defender for Cloud.
- In the Try our templates section, select the desired dashboard template.
Automate and orchestrate findings
You can create your own workflows or use our templates to automate and orchestrate container vulnerability findings.
- In Settings, open Microsoft Defender for Cloud.
- In the Try our templates section, select the desired workflow template.
Query ingested data
You can query ingested data in Notebooks or Investigations, using the data format in Semantic Dictionary.
- In Settings, open Microsoft Defender for Cloud.
- Select Open with .
- Select Investigations or Notebooks.
Evaluate, triage, and investigate detection findings
You can evaluate, triage, and investigate detection findings with  Threats & Exploits.
- Open Threats & Exploits.
- Filter for Provider > Microsoft Defender for Cloud.
Delete connections
To stop sending events to Dynatrace
- In Settings, open Microsoft Defender for Cloud.
- For the connection you want to delete, select Delete.
- Follow the on-screen instructions to delete the resources. If you used values different from those specified in the setup dialog, adjust them accordingly.
This removes the Dynatrace resources created for this integration.
Licensing and costs
For billing information, see Events powered by Grail.
FAQ
Which data model is used for the security logs and events coming from Microsoft Defender for Cloud?
-
Vulnerability finding events store the individual vulnerability findings reported by Microsoft Defender for Cloud per container image and component.
-
Vulnerability scan events indicate coverage of scans for individual container images.
Which extension fields are added on the events ingested from Microsoft Defender for Cloud?
The container_image namespace is added to store all the container image-related information with the following fields:
-
container_image.digestrepresents the container image digest; this value can be used to match to the runtime containers -
container_image.repositoryrepresents the container repository name -
container_image.registryrepresents the container registry name -
container_image.tagsrepresents the labeled versions of the container images
What Microsoft Defender for Cloud asset types are supported by Dynatrace for runtime contextualization?
CONTAINER_IMAGE: All the findings from Microsoft Defender for Cloud are generated by vulnerability assessments of container images set with CONTAINER_IMAGE value in the object.type field, and the container_image namespace is added.
How do we normalize the risk score for Microsoft Defender for Cloud findings?
Dynatrace normalizes severity and risk scores for all findings ingested through the current integration. This helps you to prioritize findings consistently, regardless of their source.
For details on how normalization works, see Severity and score normalization.
-
dt.security.risk.levelis mapped directly from the severity level set by Microsoft Defender for Cloud. -
dt.security.risk.scoreis mapped directly from the severity score set by Microsoft Defender for Cloud.
dt.security.risk.level (mapped from finding.severity) | dt.security.risk.score (mapped from finding.score) |
|---|---|
Critical -> CRITICAL | 9.0-10.0 |
High -> HIGH | 7.0-8.9 |
Medium -> MEDIUM | 4.0-6.9 |
Low -> LOW | 0.1-3.9 |
Unknown, None -> NONE | 0.0 |
