Visualize and analyze security findings
- Latest Dynatrace
- Tutorial
Organizations use multiple security products and tools that generate security findings in various data formats. Accessing the data in a siloed approach makes the life of security analysts hard, as they must spend a lot of manual effort generating a combined security posture picture.
In this context, you can
-
Ingest security findings from your security tools (see Security integrations) or vulnerability finding events from Dynatrace-monitored processes (see Third-party library events) and map them to the Dynatrace Semantic Dictionary, which makes events from different tools uniformly accessible with DQL.
-
View and analyze security findings across products and tools with our dashboards, which can also be a good foundation for tailoring further visual customization to meet your organization's posture analysis and reporting requirements.
-
Query ingested data in our dedicated apps.
Target audience
Security analysts and managers responsible for analyzing and reporting the organization's security posture.
Key use cases include:
- Gaining a unified view of all the security findings
- Prioritizing security findings across products
- Identifying top affected assets
Prerequisites
Depending on the ingestion source, follow the appropriate setup:
-
Third-party security products: Set up a supported integration.
-
Dynatrace-monitored environments: Enable third-party vulnerability detection to ingest vulnerability finding events from third-party libraries.
Get started
1. Visualize
-
Open
 Dashboards and go to Ready-made.
Ready-made dashboards are available for third-party tool integrations. Vulnerability finding events from Dynatrace-monitored environments are accessible via DQL but aren't currently included in those dashboards.
-
Search for and select Security findings for the desired integration.
Example result:
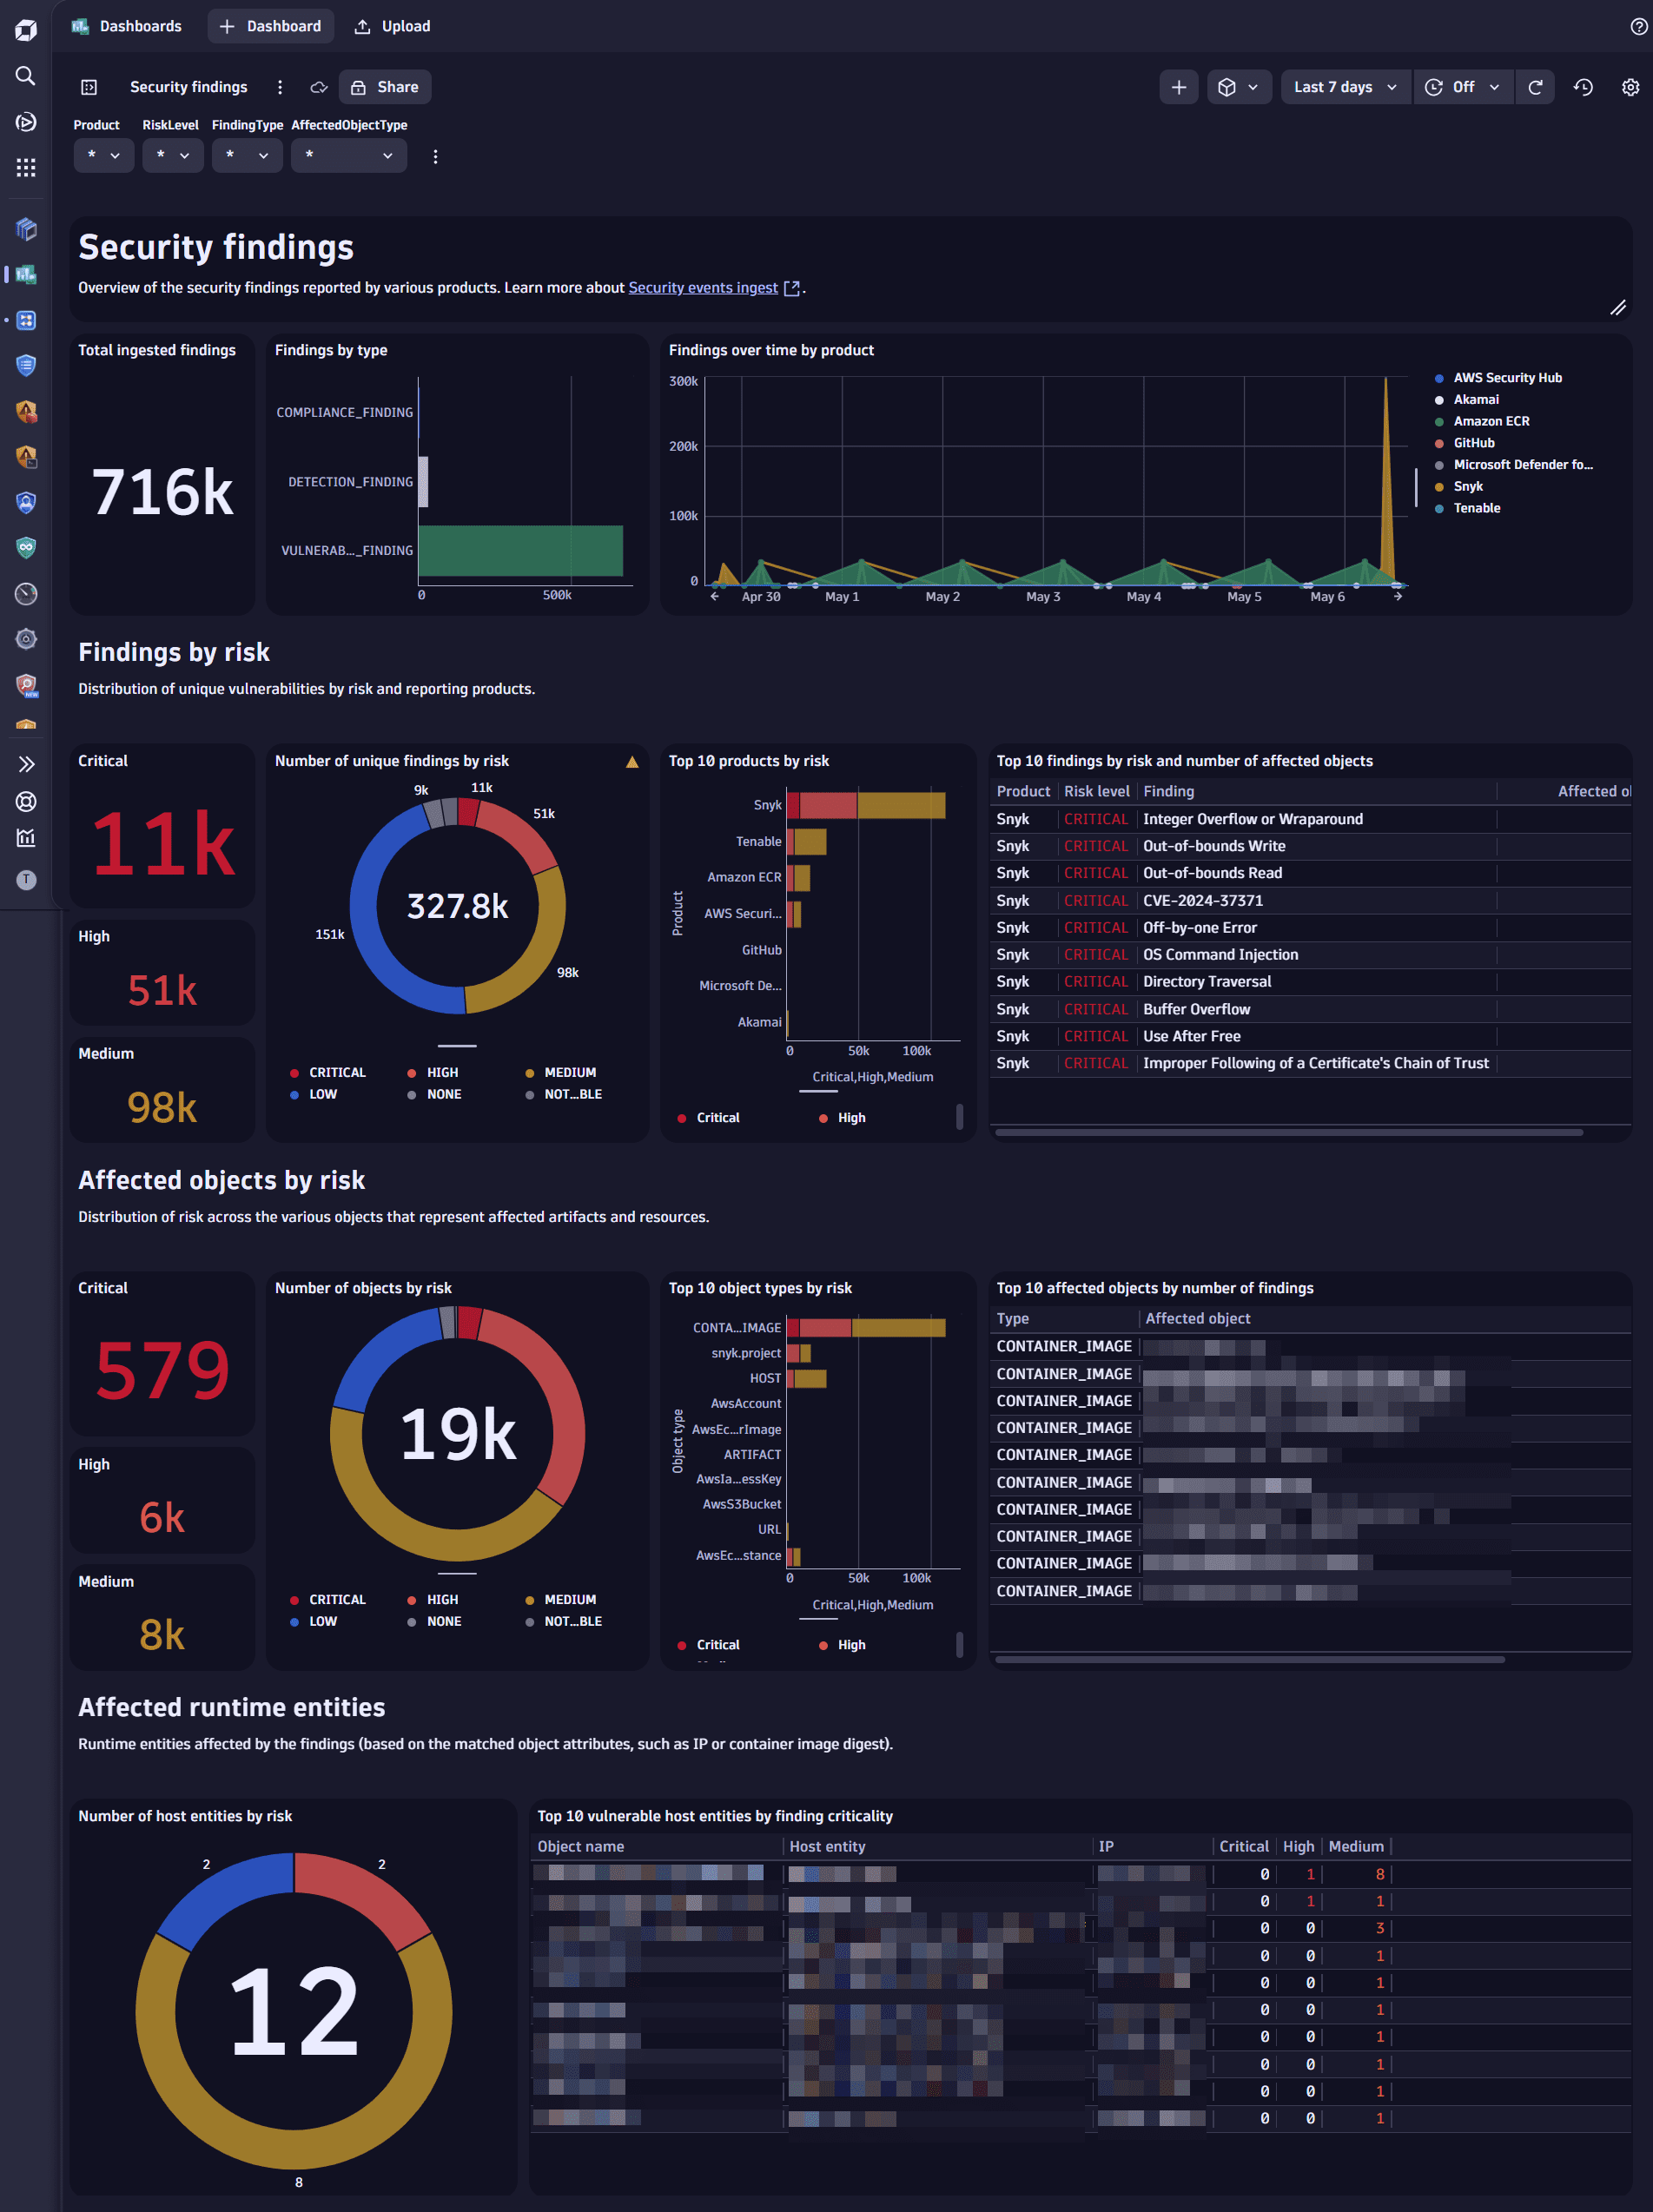
2. Analyze
Open  Notebooks or
  Investigations to query ingested data, using the data format in Semantic Dictionary.
For a better understanding of how to build your queries, see DQL query examples for ingested events.