Ingest Tenable vulnerability findings, scan events, and audit logs
- Latest Dynatrace
- Extension
This page has been updated to align with the new Grail security events table. For the complete list of updates and actions needed to accomplish the migration, follow the steps in the Grail security table migration guide.
Prioritize Tenable vulnerabilities with runtime context from production.
Get started
Overview
Tenable provides robust solutions for identifying, prioritizing, and addressing vulnerabilities, which are crucial for reducing cyber risks and securing digital infrastructure. Integrating Tenable findings into Dynatrace can enhance your overall security posture by ensuring comprehensive visibility and streamlined vulnerability management.
Use cases
With the ingested data, you can accomplish various use cases, such as
Requirements
Supported Tenable products
-
Tenable Vulnerability Management (for vulnerabilities and scan events)
-
Tenable Web App Scanning (for vulnerabilities and scan events)
-
Tenable One (for audit logs)
(more coming soon)
Tenable requirements
-
Generate an API access and secret key with the following roles:
-
Basic for vulnerability management and web app scanning
To get full scan details, ensure that the API key configured has access to read scans and scan history as well. See APIs used to fetch data for details of the APIs required.
-
Administrator or Custom for audit logs
For details, see Tenable-Provided Roles and Privileges.
-
Dynatrace requirements
-
ActiveGate version 1.299+
-
Permissions:
- To run
 Extensions: Go to Hub, select
  Extensions, and display Technical information.
 - To query ingested data:
storage:security.events:read.
- To run
-
Tokens:
- Generate an access token with the
openpipeline.events_securityscope and save it for later. For details, see Dynatrace API - Tokens and authentication.
- Generate an access token with the
Activation and setup
-
In Dynatrace, search for Tenable and select Install.
-
Follow the on-screen instructions to configure the extension.
-
Verify configuration by running the following queries in
 Notebooks:
-
For vulnerabilities and asset scans:
fetch security.events| filter dt.system.bucket=="default_securityevents"| filter event.provider == "Tenable" -
For audit logs:
fetch logs| filter log.source == "Tenable"
-
-
Once the extension is installed and working, you can access and manage it in Dynatrace via
 Extensions. For details, see About Extensions.
Now you can visualize findings, analyze audit logs and automate notifications.
Details
How it works
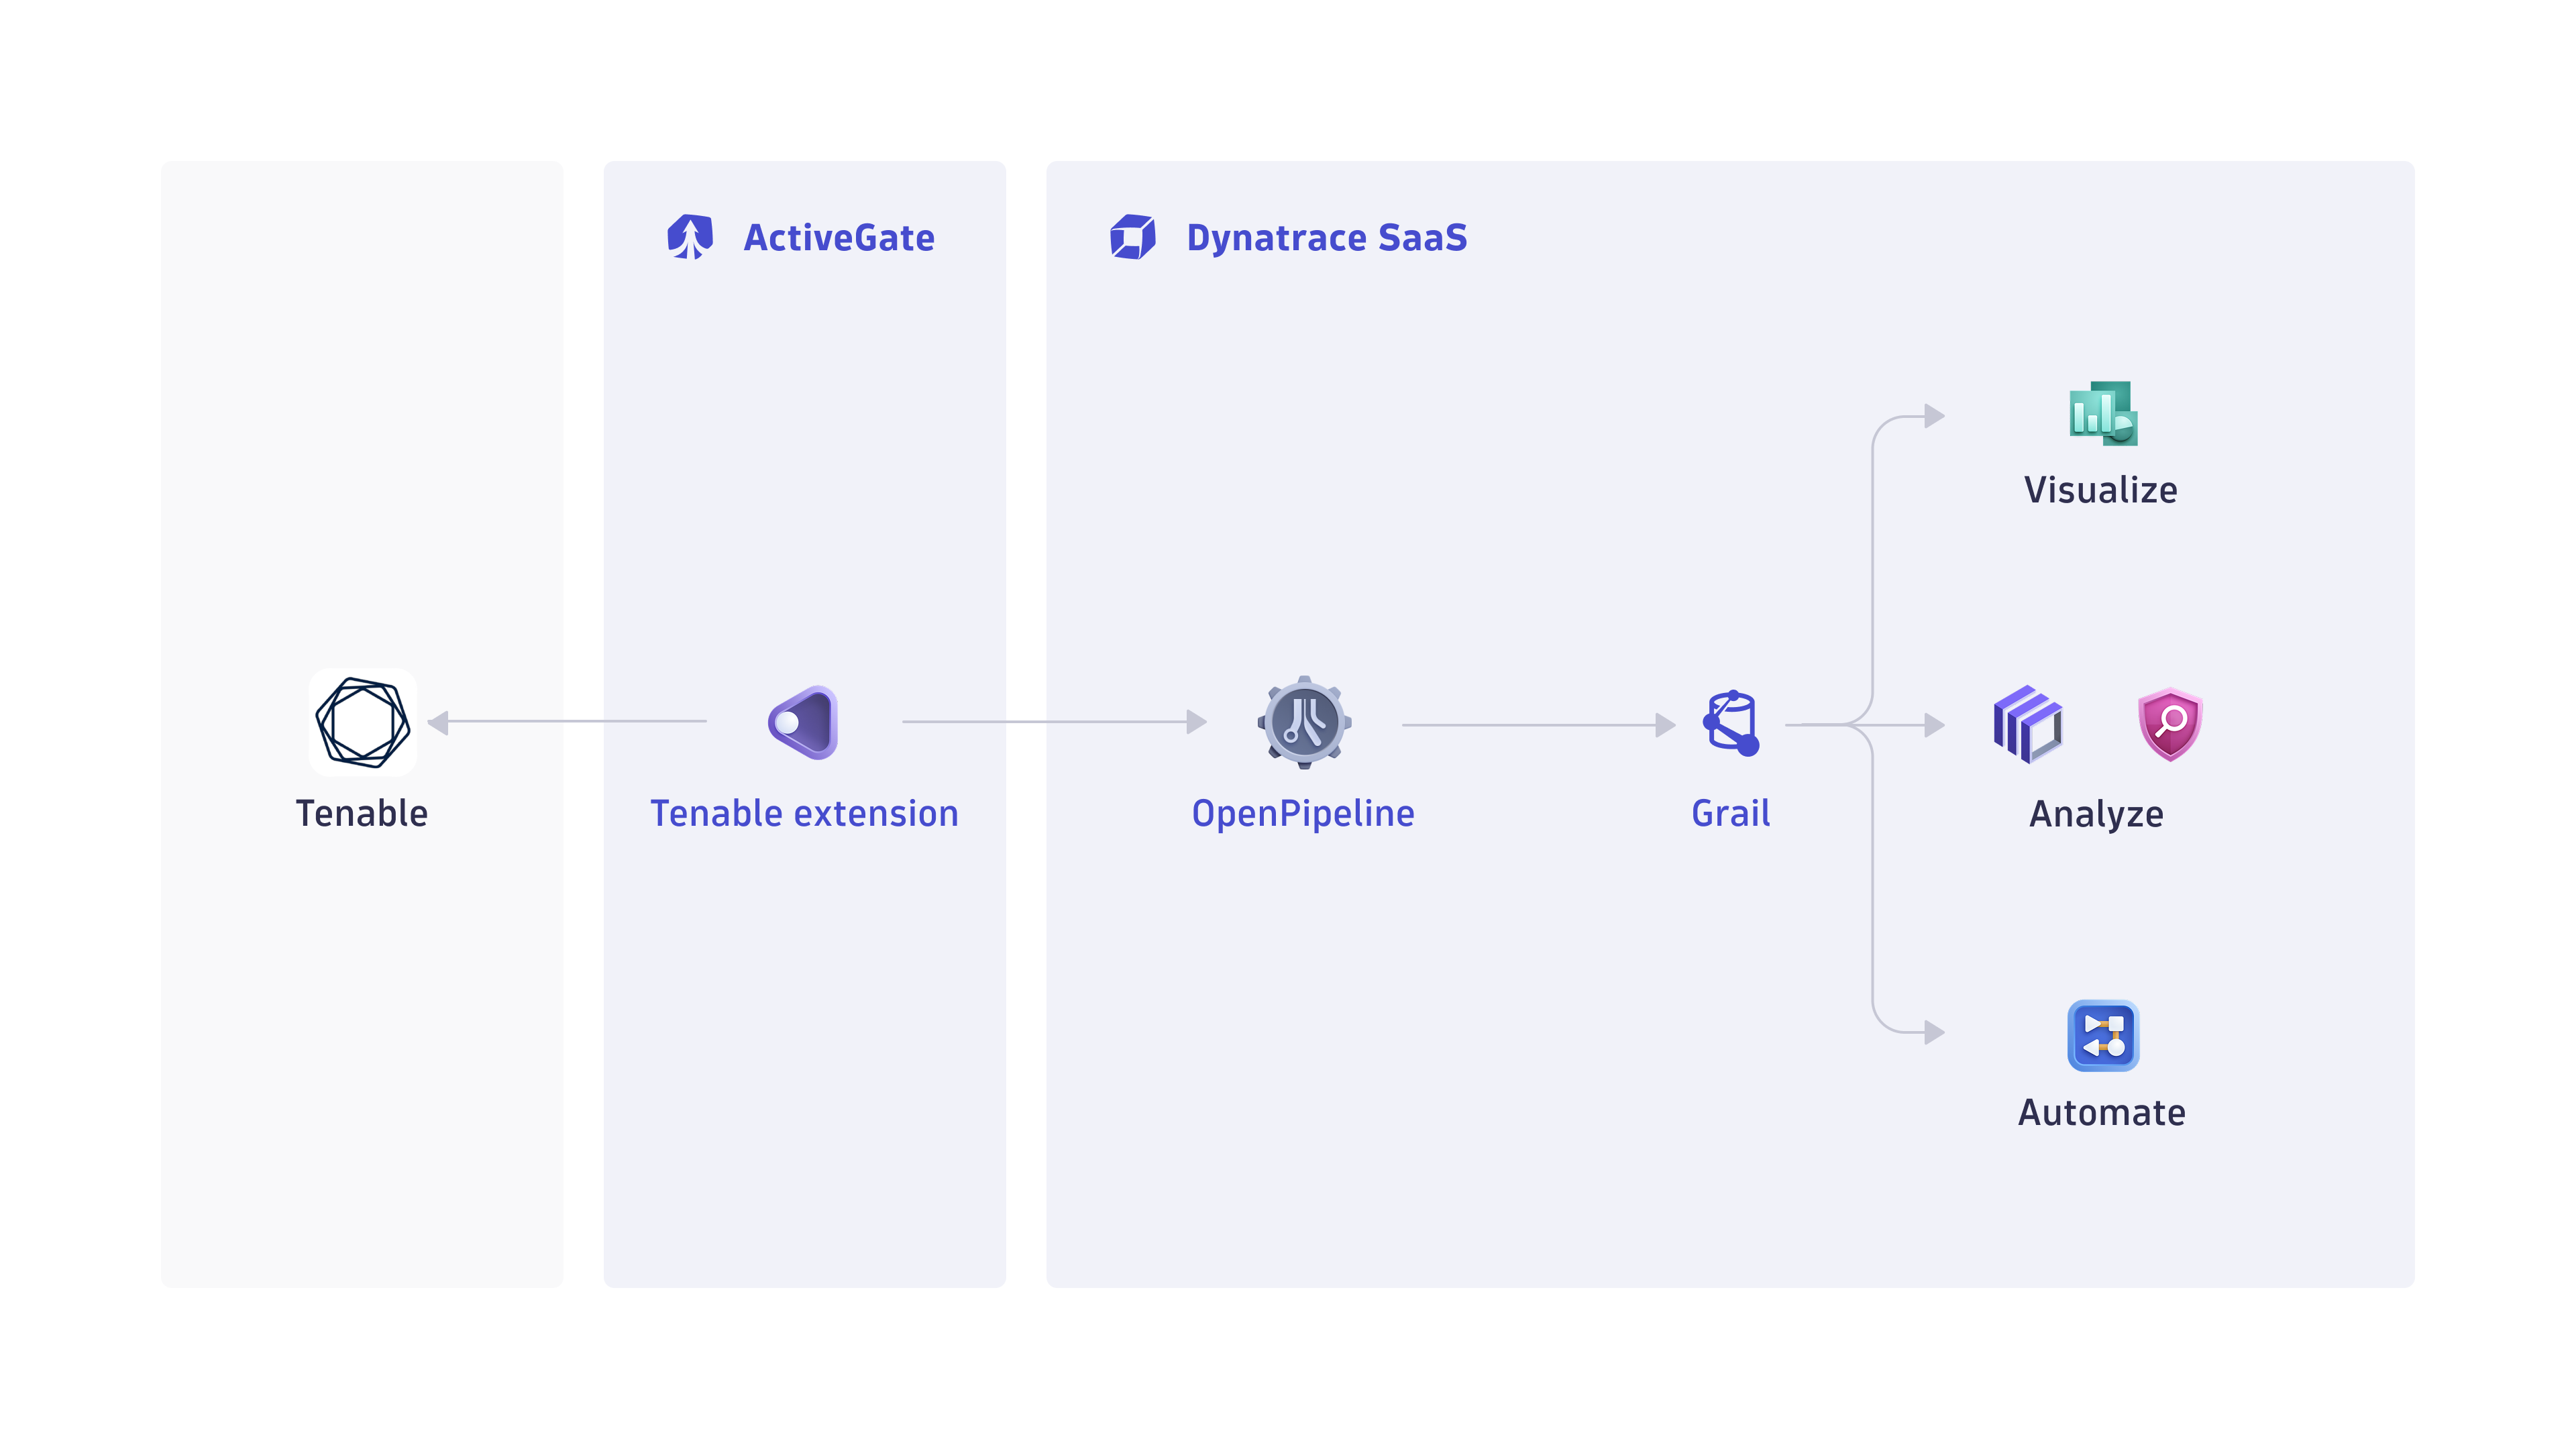
Dynatrace integration with Tenable is an extension running on Dynatrace ActiveGate. Once you enable and configure the Dynatrace Tenable extension
-
It periodically reaches out to Tenable products and fetches the new findings, scans, and audit logs from the Tenable APIs.
APIs used to fetch data
- APIs for vulnerability management:
- API for audit logs:
- API for web app scanning:
-
The fetched data is ingested into Dynatrace and mapped to the Dynatrace Semantic Dictionary.
-
Data is stored in a bucket called
default_securityevents(for details, see: Built-in Grail buckets).
Visualize
-
Open
 Extensions and go to Tenable.
 -
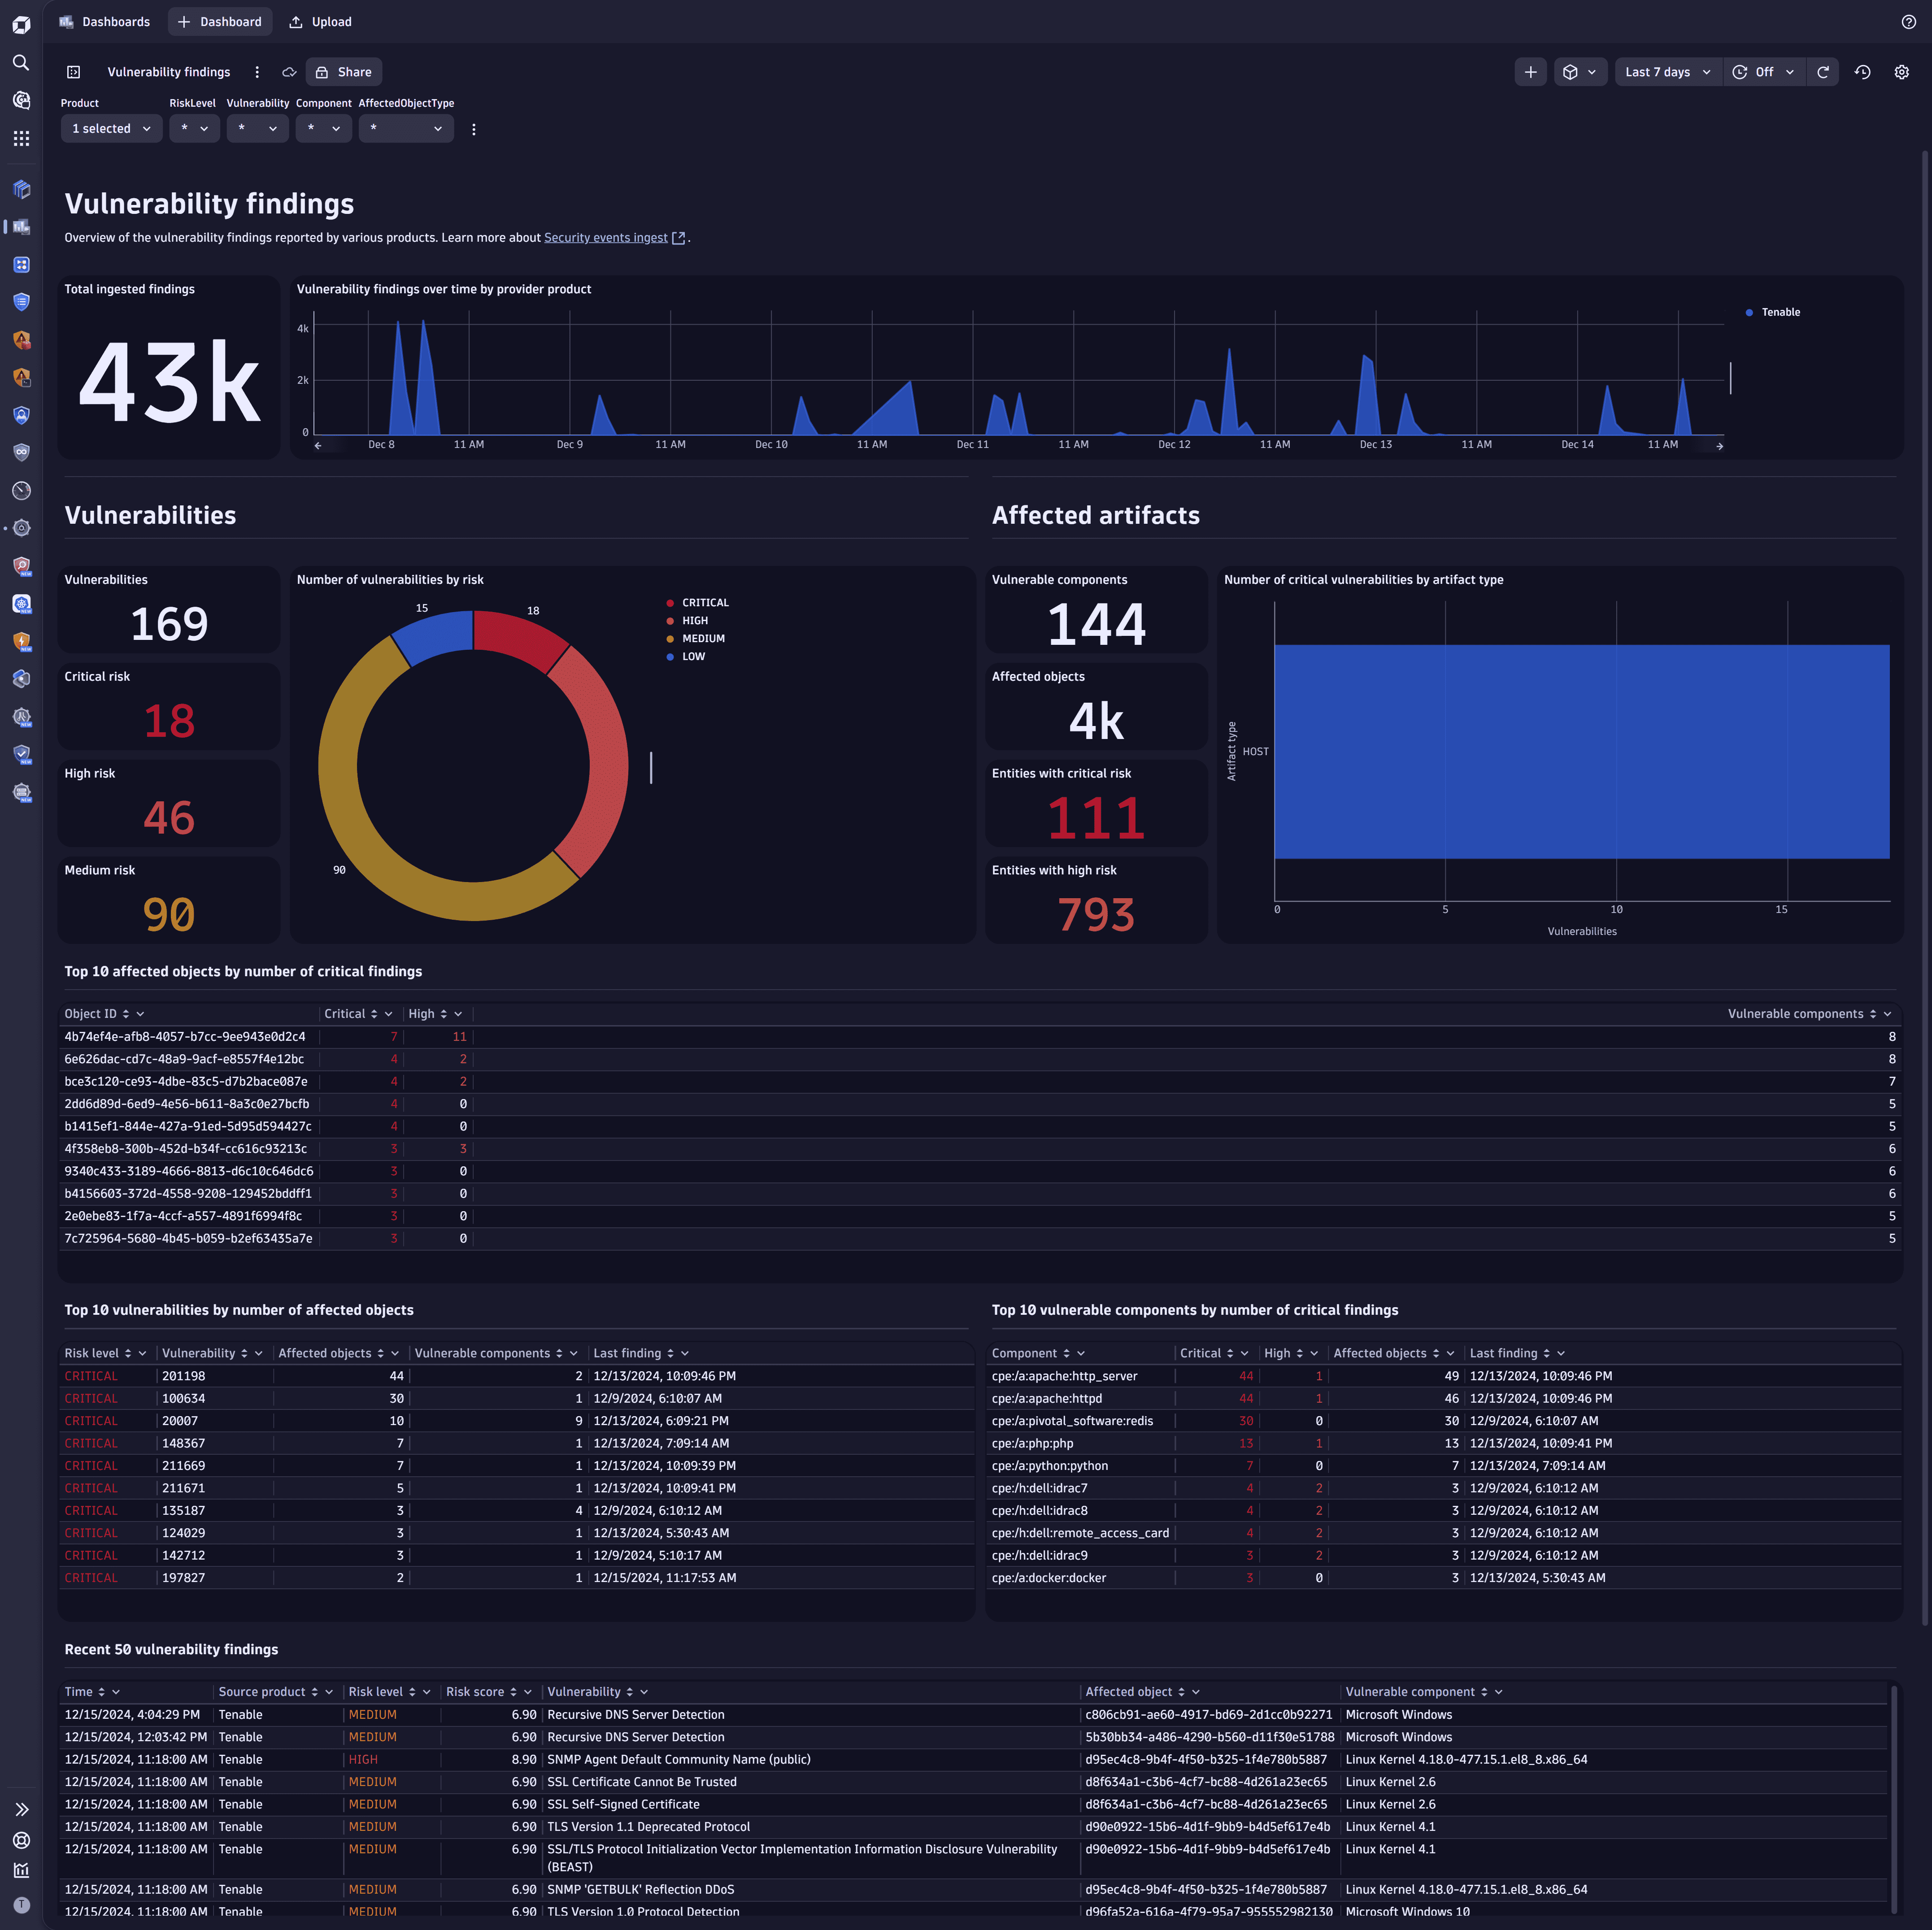
In Extension content, select the desired ready-made dashboard.
-
In the Product filter, select Tenable to view data reported by Tenable, such as critical vulnerabilities and affected objects.
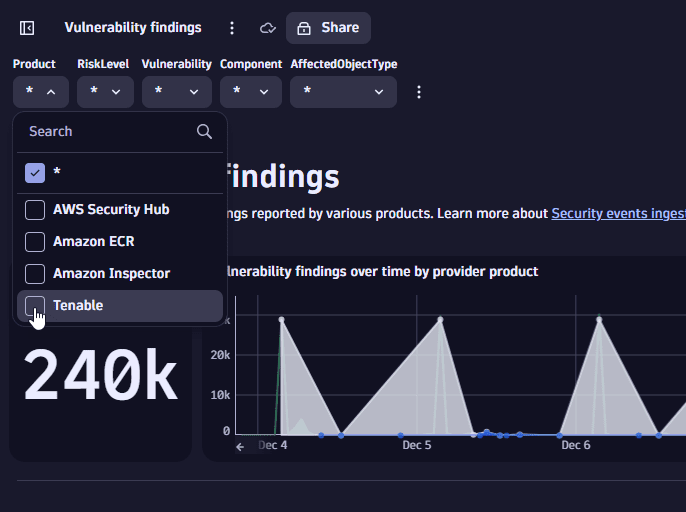 filter for tenable product
Example result:
Analyze
Open  Notebooks or
  Investigations to query ingested data, using the data format in Semantic Dictionary.
For examples of how you can build your queries, see below.
Query for logs over time by action
fetch logs| filter log.source == "Tenable"| makeTimeseries logs=countDistinctExact(id), by:{audit.action}, time:{toTimestamp(received)}, interval:{3h}
Example result:

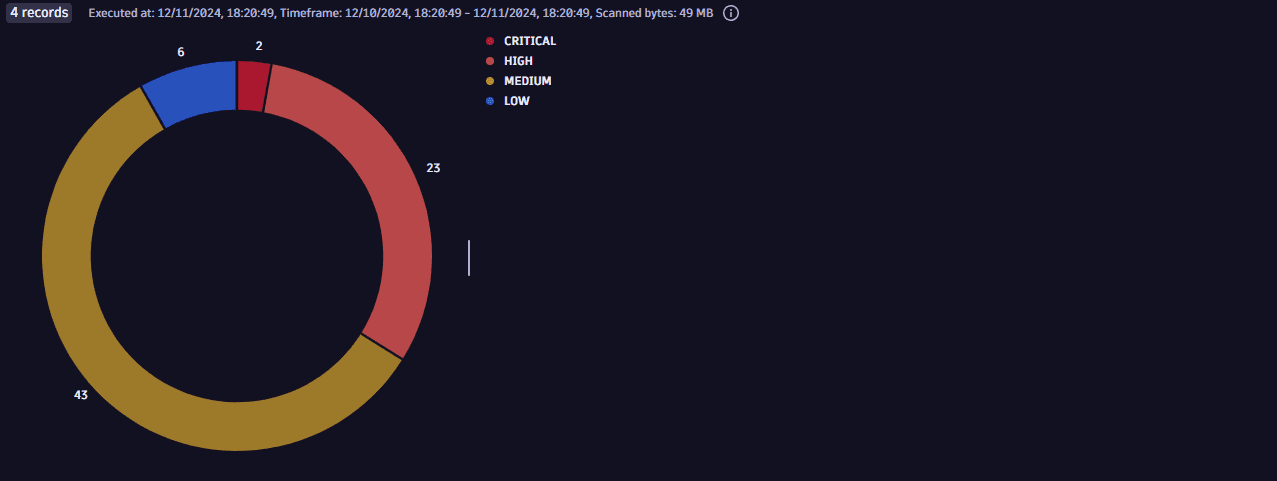
Query for vulnerability distribution by risk level
fetch security.events| filter dt.system.bucket=="default_securityevents"| filter event.type == "VULNERABILITY_FINDING"| filter event.provider == "Tenable"| dedup {object.id, vulnerability.id}, sort:{timestamp}| summarize Vulnerabilities=countDistinctExact(vulnerability.id), by:{dt.security.risk.level}| fieldsAdd order=if(dt.security.risk.level=="CRITICAL", 1, else:if(dt.security.risk.level=="HIGH", 2, else:if(dt.security.risk.level=="MEDIUM", 3, else:if(dt.security.risk.level=="LOW", 4, else:5))))| sort order asc
Example result:
Query for top 10 scans with the most host coverage
fetch security.events| filter dt.system.bucket=="default_securityevents"| filter event.type == "VULNERABILITY_SCAN"| filter event.provider == "Tenable"| dedup {object.id, scan.id}| summarize Hosts=countDistinctExact(object.id), by:{scan.name}| sort Hosts desc| limit 10
Example result:

Automate notifications
- Download our sample workflow for Jira or sample workflow for Slack.
- Open
 Workflows, select
 Upload, then select the downloaded file.
- Adjust the workflow to your needs to create notifications for critical Tenable findings.
Licensing and cost
For billing information, see Events powered by Grail.
Feature sets
When activating your extension using monitoring configuration, you can limit monitoring to one of the feature sets. To work properly, the extension has to collect at least one metric after the activation.
In highly segmented networks, feature sets can reflect the segments of your environment. Then, when you create a monitoring configuration, you can select a feature set and a corresponding ActiveGate group that can connect to this particular segment.
All metrics that aren't categorized into any feature set are considered to be the default and are always reported.
A metric inherits the feature set of a subgroup, which in turn inherits the feature set of a group. Also, the feature set defined on the metric level overrides the feature set defined on the subgroup level, which in turn overrides the feature set defined on the group level.
FAQ
Why does my configuration show an error?
Error message: Failed to assign monitoring configuration to ActiveGate. Reason: Extension com.dynatrace.extension.tenable(<version-number>) not available in cache yet (queued for download)
If your configuration shows the error message above, it simply means that ActiveGate is still downloading the extension for the cluster. The status should change after a few minutes.
Why do I see duplicate events?
Duplicate events in the Tenable extension are likely due to the first ingest running multiple times. When a monitoring configuration is assigned to an ActiveGate, the first execution will run an export for a longer timeframe (configurable in the monitoring configuration settings). Anytime the extension is restarted (due to an update, ActiveGate reset, failover, and so on), the first ingest will run again.
You can run a DQL query and dedup the events using the object.id, scan.id, and finding.id fields.
- For
VULNERABILITY_FINDING, the unique ID is{object.id, finding.id}. - For
VULNERABILITY_SCAN, the unique ID is{object.id, scan.id}.
Example:
fetch security.events| filter dt.system.bucket=="default_securityevents"| filter event.type == "VULNERABILITY_FINDING"| filter event.provider == "Tenable"| dedup {object.id, finding.id}, sort:{timestamp}
Why do some scan events have the same start and end times?
When fetching vulnerabilities, the Tenable extension attempts to match the data with recent scan executions. If the scan mentioned in the Tenable vulnerability can't be found (for example, due to missing permissions), the extension creates a scan event based on this finding. These scan events have the same start and end times as when the vulnerability was found.
Why isn't my data ingested?
If you installed and configured the extension, but data isn’t being ingested, follow the steps below.
-
Open the extension and go to Health to check the status of the monitoring configuration.
-
If the status isn’t
OK, scroll down to Logs and select Run query to see the error information. -
If the error information isn’t enough, or the status shows
OKbut you're still not getting data, extract a support archive from ActiveGate to troubleshoot further.How to extract a support archive
- Find the ActiveGate ID for the ActiveGate running the configuration and extract a support archive. For details, see ActiveGate diagnostics: Collect and review locally.
- Unzip the support archive and find the extension log file at
COLLECTOR/<id>/remotepluginmodule/log/extensions/datasources/com.dynatrace.extension.tenable/python3.log.
-
If the information there is still not sufficient for troubleshooting, enable the
Debug logsflag in the monitoring configuration and contact Dynatrace Support.
Common causes for missed data ingest include:
-
No connectivity between the ActiveGate and Tenable cloud
Suggestion: Attempt to curl the Tenable cloud URL from the ActiveGate to ensure connectivity is working.
-
Wrong access and/or secret key
Suggestion: Double-check the credentials configured on the monitoring configuration.
-
Missing permissions on the API user
Suggestion: Ensure that the API user can call the APIs used to fetch data.
Which extension fields are added on top of the core fields of the events ingested from Tenable?
The tenable namespace is added for extracting several Tenable-specific attributes for user convenience on top of the original issue JSON, which is stored in the event.original_content field.
Examples:
-
tenable.vpr -
tenable.last_found -
tenable.first_found -
tenable.last_fixed
What Tenable asset types are supported by Dynatrace for runtime contextualization?
HOST - all the findings from Tenable Vulnerability Management coming from hosts scans are mapped with the HOST value in the object.type field, and the host namespace is added with the corresponding fields:
-
host.namerepresents the host name as detected by Tenable. -
host.iprepresents the host IP address scanned by Tenable. -
host.fqdnrepresents the host FQDN as resolved by Tenable.
Runtime contextualization can be done from the host.ip field.
How is the risk score for Tenable findings normalized?
Dynatrace normalizes severity and risk scores for all findings ingested through the current integration. This helps you to prioritize findings consistently, regardless of their source.
For details on how normalization works, see Severity and score normalization.
The Dynatrace risk levels and scores are mapped from the original Tenable severity.
Tenable uses the VPR score. However, the severity levels are set from CVSS scores (v2 or v3, depending on the configuration). Therefore, Dynatrace maps the severity to the risk level and then assigns the appropriate risk score based on it.
-
dt.security.risk.levelis taken from the Tenable severity level and mapped from the original values infinding.severity. -
dt.security.risk.scoreis mapped from the mapped risk level to a set of static scores.
dt.security.risk.level (mapped from finding.severity) | dt.security.risk.score (mapped from dt.security.risk.level) |
|---|---|
critical -> CRITICAL | 10.0 |
high -> HIGH | 8.9 |
medium -> MEDIUM | 6.9 |
low -> LOW | 3.9 |
