Ingest Harbor vulnerability findings, scans, and audit logs
- Latest Dynatrace
- Extension
Prioritize Harbor image vulnerabilities with runtime context from production.
Get started
Overview
The Dynatrace integration with Harbor allows you to unify and contextualize vulnerability findings across DevSecOps tools and products, enabling central prioritization, visualization, and automation of security findings.
Harbor is a container registry that allows scanning the stored container images with various tools, such as Trivy. It serves the generated vulnerability findings from container images. The Dynatrace platform observes the corresponding runtime entities (the running containers) associated with those images. Ingesting and mapping vulnerability findings to the runtime entities helps users to better focus on the top risks that affect their production applications.
Use cases
With the ingested data, you can accomplish various use cases, such as
- Visualize and analyze security findings
- Discover coverage gaps in security findings
- Automate and orchestrate security findings
- Analyze and detect anomalous user activity Coming soon
Requirements
See below for the Harbor and Dynatrace requirements.
Harbor requirements
We recommend using a robot account for fine-grained authorization. Make sure to
- Store the generated secret for the robot account, as it won't be recoverable after creation
- Refresh the expiry period in due time
- Edit the robot account to enable the permissions below.
| Permission Type | Resource | Access Level |
|---|---|---|
System permissions | Audit log | List |
Project | List | |
Security Hub | List | |
Project permissions | Artifact | List |
Repository | List |
These permissions must be granted for all projects you want Dynatrace to monitor. They ensure Dynatrace can retrieve scan results, audit events, and metadata necessary for accurate vulnerability mapping.
Dynatrace requirements
-
ActiveGate version 1.300+
-
Permissions:
- To run
 Extensions: Go to Hub, select Extensions, and display Technical information.
 - To query ingested data:
storage:security.events:read.
- To run
-
Tokens:
- Generate an access token with the
openpipeline.events_securityscope and save it for later. For details, see Dynatrace API - Tokens and authentication.
- Generate an access token with the
Activation and setup
-
In Dynatrace, search for Harbor and select Install.
-
Follow the on-screen instructions to configure the extension.
-
Verify configuration by running the following queries in
 Notebooks:
-
For audit logs:
fetch logs| filter log.source=="Harbor" -
For finding events:
fetch security.events| filter dt.system.bucket == "default_securityevents"| filter event.provider=="Harbor"AND event.type=="VULNERABILITY_FINDING" -
For scan events:
fetch security.events| filter dt.system.bucket == "default_securityevents"| filter event.provider=="Harbor"AND event.type=="VULNERABILITY_SCAN"
-
-
Once the extension is installed and working, you can access and manage it in Dynatrace via
Extensions. For details, see About Extensions.
Details
How it works
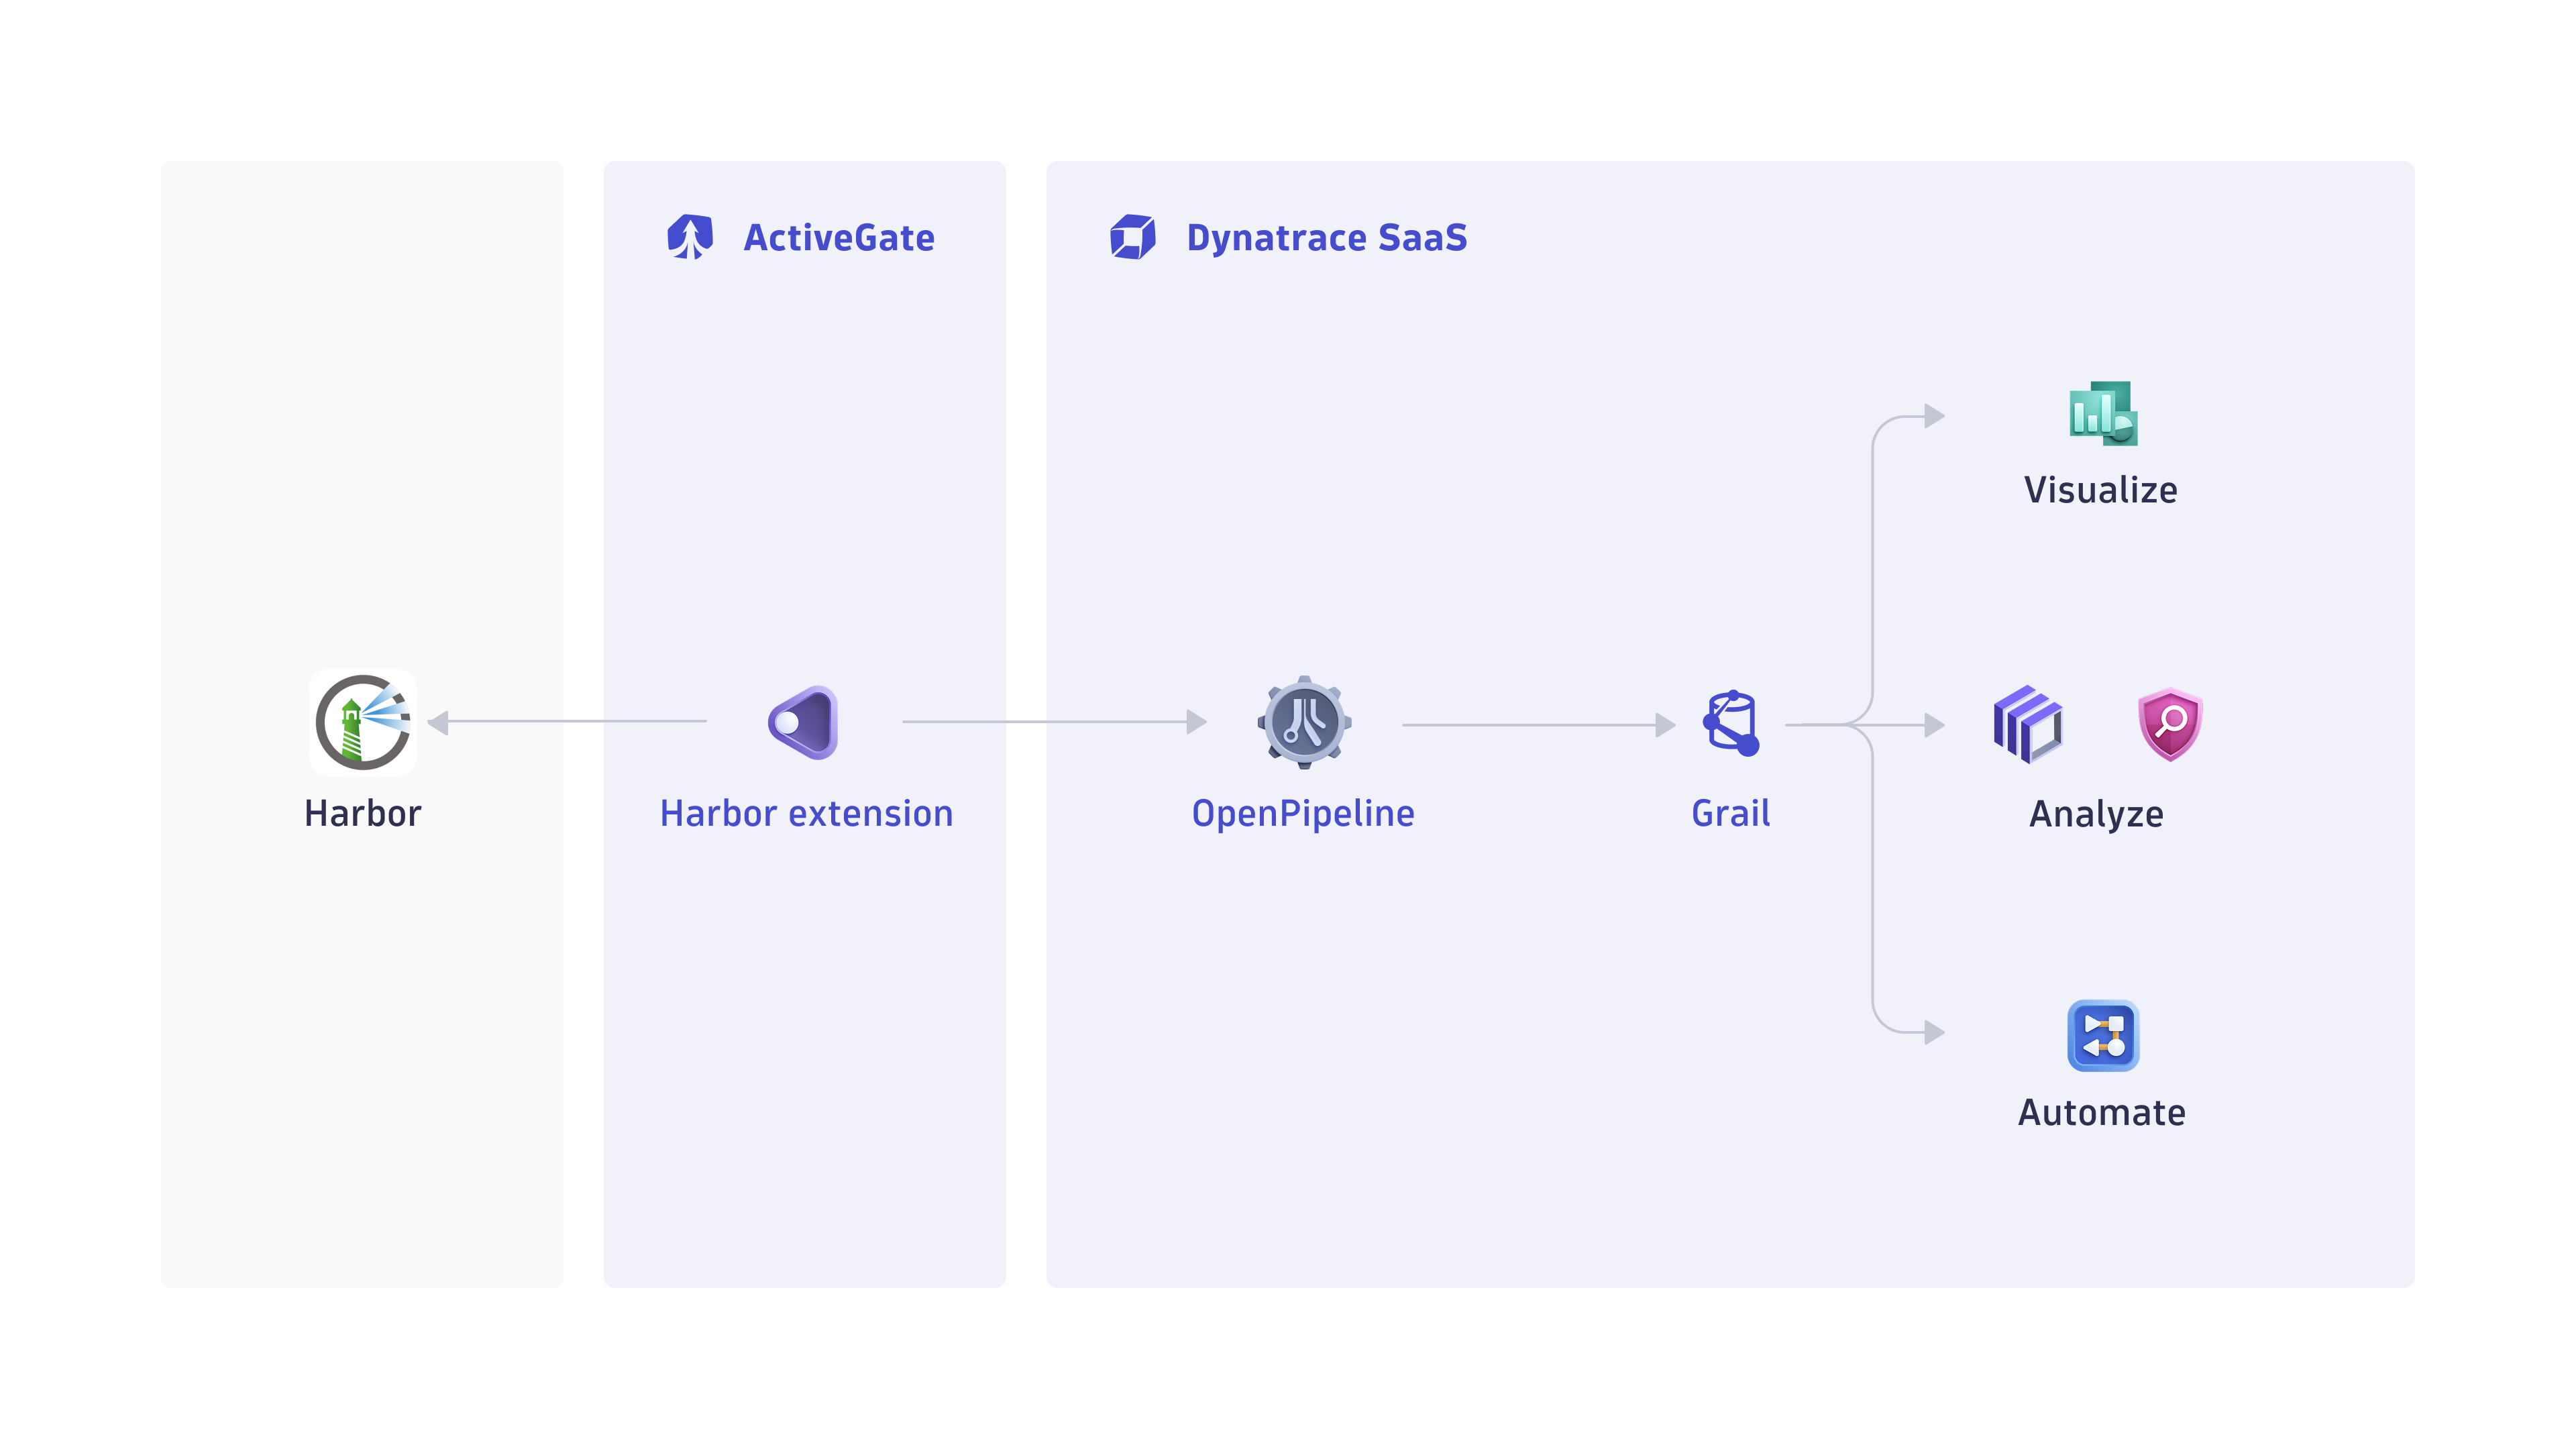
Dynatrace integration with Harbor is an extension running on Dynatrace ActiveGate. Once you enable and configure the Dynatrace Harbor extension
-
It periodically reaches out to Harbor products and fetches the new vulnerability findings, scans, and audit logs.
-
The fetched data is ingested into Dynatrace and mapped to the Dynatrace Semantic Dictionary.
-
Data is stored in a bucket called
default_securityevents(for details, see Built-in Grail buckets).
Licensing and costs
For billing information, see Events powered by Grail.
Feature sets
When activating your extension using a monitoring configuration, you can limit monitoring to one of the feature sets. To work properly, the extension has to collect at least one metric after the activation.
In highly segmented networks, feature sets can reflect the segments of your environment. Then, when you create a monitoring configuration, you can select a feature set and a corresponding ActiveGate group that can connect to this particular segment.
All metrics that aren't categorized into any feature set are considered to be the default and are always reported.
A metric inherits the feature set of a subgroup, which in turn inherits the feature set of a group. Also, the feature set defined on the metric level overrides the feature set defined on the subgroup level, which in turn overrides the feature set defined on the group level.
FAQ
Why are some scans not being reported?
The Harbor APIs only expose the status of the last completed scan for artifacts. This means that when the extension runs, it can only report the most recent scan that occurred (if any) during the last collection interval.
If the extension is set to collect scan and vulnerability data once per hour and two scans occurred in that last hour, only the details of the most recent one will be reported.
Which data model is used for the security logs and events coming from Harbor?
-
Vulnerability finding events store the individual vulnerability findings reported by Harbor per container image and component.
-
Vulnerability scan events indicate coverage of scans for individual container images.
-
Audit logs represent user activity logs in Harbor.
Which extension fields are added on top of the core fields of the events ingested from Harbor?
The container_image namespace is added for container image-related information with the following fields:
-
container_image.digestrepresents the container image digest; this value can be used to match to the runtime containers -
container_image.repositoryrepresents the container repository name -
container_image.registryrepresents the container registry name
The container_image.tags field isn't reported by Harbor, so it's not available.
What Harbor asset types are supported by Dynatrace for runtime contextualization?
CONTAINER_IMAGE: All findings from Harbor are generated by vulnerability assessments of container images set with the CONTAINER_IMAGE value in the object.type field, and the container_image namespace is added.
How do we normalize the risk score for Harbor findings?
Dynatrace normalizes severity and risk scores for all findings ingested through the current integration. This helps you to prioritize findings consistently, regardless of their source.
For details on how normalization works, see Severity and score normalization.
-
dt.security.risk.levelis taken from the severity level set by the configured scanner in Harbor. The values (CRITICAL,HIGH,MEDIUM,LOW, andNONE) are mapped as is, with the exception ofUnknown, which is also mapped toNONE. -
dt.security.risk.scoreis mapped to a set of fixed values based on the risk level determined above.
dt.security.risk.level (mapped from finding.severity) | dt.security.risk.score |
|---|---|
Critical -> CRITICAL | 10.0 |
High -> HIGH | 8.9 |
Medium -> MEDIUM | 6.9 |
Low -> LOW | 3.9 |
Unknown -> NONE | 0.0 |
