Ingest Akamai security logs and events
- Latest Dynatrace
- Extension
Correlate Akamai security telemetry with runtime context to prioritize threats.
Get started
Overview
Dynatrace integration with Akamai allows you to unify and contextualize security findings across tools and products, enabling central prioritization, visualization, and automation.
Akamai products generate security events and detect suspicious network activity. Dynatrace observes the runtime entities protected by those products. Ingesting security events from Akamai products helps users analyze those logs and findings in the context of their runtime production environments.
Use cases
With the ingested data, you can accomplish various use cases, such as
- Visualize and analyze security findings
- Automate and orchestrate security findings
- Evaluate, triage, and investigate detection findings with
 Threats & Exploits
 - Analyze network logs and detections Coming soon
Requirements
See below for the Akamai and Dynatrace requirements.
Akamai requirements
Create authentication credentials with the proper permissions
Dynatrace requirements
-
ActiveGate version 1.300+
-
Permissions:
- To run
 Extensions: Go to Hub, select Extensions, and display Technical information.
 - To query ingested logs:
storage:logs:read. - Optional To query the extracted security events:
storage:security.events:read.
- To run
-
Tokens:
- Generate an access token with the
openpipeline.events_securityscope and save it for later. For details, see Dynatrace API - Tokens and authentication.
- Generate an access token with the
Activation and setup
-
In Dynatrace, search for Akamai and select Install.
-
Follow the on-screen instructions to configure the extension.
-
Verify configuration by running the following queries in
 Notebooks:
-
For security logs:
fetch logs| filter log.source=="Akamai SIEM" -
For finding events (if you configured the extension to extract detection events):
fetch security.events| filter dt.system.bucket == "default_securityevents"| filter event.provider=="Akamai"
-
-
Once the extension is installed and working, you can access and manage it in Dynatrace via
Extensions. For details, see About Extensions.
Details
How it works
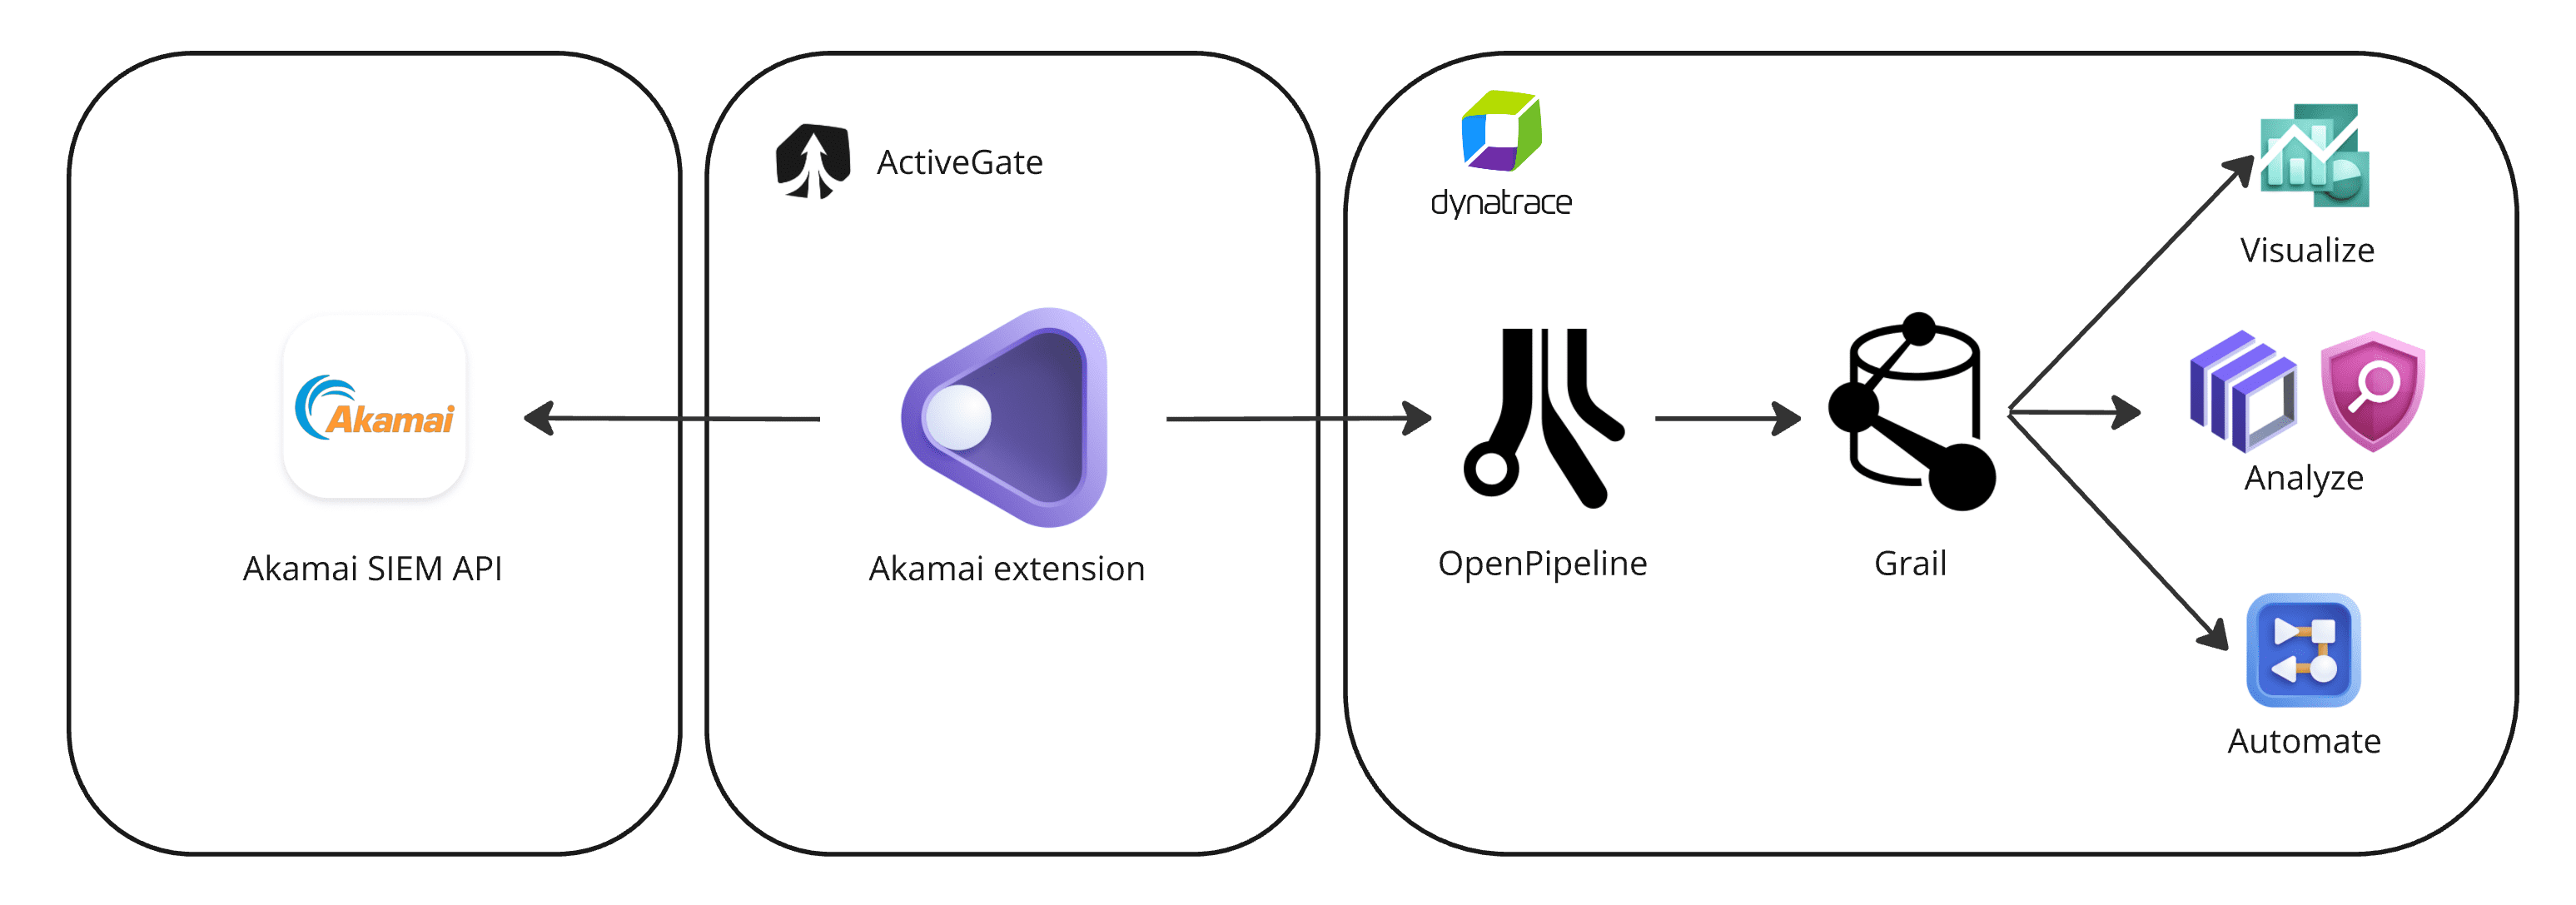
Dynatrace integration with Akamai is an extension running on Dynatrace ActiveGate. Once you enable and configure the Dynatrace Akamai extension
-
It periodically reaches out to Akamai SIEM API and fetches the security events.
-
The raw data is ingested into Dynatrace as logs. If security event extraction is configured, detection events are ingested in addition to the logs mapped to the Dynatrace Semantic Dictionary.
-
Data is stored as follows:
- Logs are stored in the
default_logsbucket - Security events are stored in the
default_securityeventsbucket
For details, see Built-in Grail buckets.
- Logs are stored in the
Additional integrations
In addition to the extension, you have the following integration options:
Licensing and costs
For billing information, see Events powered by Grail.
Feature sets
When activating your extension using a monitoring configuration, you can limit monitoring to one of the feature sets. To work properly, the extension has to collect at least one metric after the activation.
In highly segmented networks, feature sets can reflect the segments of your environment. Then, when you create a monitoring configuration, you can select a feature set and a corresponding ActiveGate group that can connect to this particular segment.
All metrics that aren't categorized into any feature set are considered to be the default and are always reported.
A metric inherits the feature set of a subgroup, which in turn inherits the feature set of a group. Also, the feature set defined on the metric level overrides the feature set defined on the subgroup level, which in turn overrides the feature set defined on the group level.
self-monitoring
| Metric name | Metric key | Description |
|---|---|---|
| Ingested logs | sfm.akamai-siem.ingested.logs | The number of log records ingested by the extension. |
| Ingested logs bytes | sfm.akamai-siem.ingested.logs_bytes | The volume of bytes ingested by the extension as logs. |
| Ingested security events | sfm.akamai-siem.ingested.security_events | The number of security events ingested by the extension. |
| Ingested security events bytes | sfm.akamai-siem.ingested.security_events_bytes | The volume of bytes ingested by the extension as security events. |
FAQ
Which data model is used for the security logs and events coming from Akamai SIEM integration?
Which extension fields are added on top of the core fields of the events ingested from Akamai?
-
The
geonamespace maps the corresponding geolocation information of the actor detected in the log. -
The
httpnamespace maps the corresponding HTTP request fields from the monitored transaction. -
The
urlnamespace maps the corresponding web application/URL accessed as the target of the monitored transaction. -
The
akamainamespace extracts several Akamai-specific fields for user convenience on top of the original JSON content, which is stored in thelog.contentfield.
Some extracted fields from which you can benefit include:
-
akamai.config.id -
akamai.attackdata.*
Which metrics are extracted automatically with the Akamai extension?
| Metric key | Description |
|---|---|
| The count of events matching volume-based activity, such as request rates exceeded or DoS attacks. |
| The count of events where the rule action is to block the request (deny). |
| The count of events where the rule action is to allow the request and log a warning (alert). |
| The count of events with monitor rule action type. |
| The total number of events processed from Akamai SIEM, regardless of attack type or severity. |
| The count of events matching a slow POST attack, which tries to tie up the site using extremely slow requests and responses. |
| The count of events matching specialized web app attacks such as SQL, PHP, command injections, and cross-site scripting. |
| The count of events matching generic web app attacks. These include keywords such as |
