About Extensions
- Latest Dynatrace
- Explanation
- 2-min read
Extension Execution Controller (EEC)
The Extension Execution Controller (EEC) is the Dynatrace component running your extensions. EEC queries either your local data sources when run on OneAgent, or remote data sources when run from an ActiveGate. EEC is automatically installed and managed with each OneAgent and ActiveGate configuration. EEC also translates all the ingested data for Dynatrace Intelligence causation analysis. For more information, see Metric ingestion.
To run local extensions, make sure EEC is enabled at the environment, host, or host group level.
Enable at the environment level
- Go to Settings and select Preferences > Extension Execution Controller.
- Turn on Enable Extension Execution Controller.
- Turn on Enable local HTTP Metric, Log and Event Ingest API.
Enable for a single host
- Go to
 Hosts Classic.
 - Find and select your host to display the host overview page.
- In the upper-right corner of the host overview page, select More (…) > Settings.
- In the host settings, select Extension Execution Controller.
- Turn on Enable Extension Execution Controller.
Enable for a host group
-
Go to
 Deployment Status > OneAgents.
 -
On the OneAgent deployment page, turn off Show new OneAgent deployments.
-
In the Filter by field, enter Host group, and then select the host group you want to configure from the dropdown list.
The host list is now filtered by the selected host group. Each listed host has a Host group:
<group name>link, where<group name>is the name of the host group that you want to configure.The Host group property is not displayed when the selected host doesn't belong to any host group.
-
Select the host group name in any row.
As you have filtered by host group, all displayed hosts go to the same host group.
- In the host group settings, select Extension Execution Controller.
- Turn on Enable Extension Execution Controller.
ActiveGate group
Dynatrace uses ActiveGate groups to determine where extensions should run. Every ActiveGate that runs an extension must be part of a group. If you plan to use a single ActiveGate, assign it to a dedicated group. For more information, see ActiveGate group.
You can run extensions using an Environment ActiveGate installed to route OneAgent traffic to Dynatrace, and to monitor cloud environments and remote technologies using extensions.
Cluster ActiveGates and multi-environment ActiveGates aren't supported for the Extensions framework.
Performance profile
OneAgent version 1.243+ You can set your limit for resource consumption in the Performance profile option. By default, one data source process takes up to 2% CPU and 100 MB RAM in OneAgent and 5% CPU and 500 MB RAM in ActiveGate.
CPU and RAM limits are applied to the sum of the resources consumed by the EEC and all data source processes. There are two stages:
- Soft limit—Every incoming test is rejected if consumption exceeds the limit. This stage applies to ActiveGate only.
- Hard limit—The most recently started task is the first to be stopped and rejected.
- For OneAgent, tasks are stopped and restarted with a delay. The delay time increases as the process restarts.
- For ActiveGate, tasks are stopped and rejected until consumption is below the limit.
Change the performance profile at the environment level
- Go to Settings > Preferences > Extension Execution Controller.
- Set Performance profile to
DefaultorHigh limits.
Change the performance profile at the host level
- Go to Hosts Classic.
- Find and select your host to display the host overview page.
- In the upper-right corner of the host overview page, select More (…) > Settings.
- In the host settings, select Extension Execution Controller.
- Set Performance profile to
DefaultorHigh limits.
Change the performance profile of an ActiveGate
-
Go to Deployment Status and select ActiveGates.
-
Expand
 the Details of the ActiveGate you want to configure and select Settings.
 -
On the Settings page, go to Extension Execution Controller.
-
Set Performance profile to
Default,High limits, orDedicated limits.You can enable
Dedicated limitsonly after you have configured the ActiveGate as described on Dedicated performance profile configuration.
Environment configuration
An environment configuration is a universal set of monitoring definitions tailored to the specifics of your data source, such as SNMP. The environment configuration is stored as the extension.yaml file uploaded to Dynatrace as a part of the extension ZIP package. An environment configuration defines:
- The scope of collected data: which metrics are ingested and which dimensions they are to be assigned to.
- The source from where the measurements and dimension values are extracted.
- The data categorization into feature sets that you can select when defining the monitoring configuration.
- How the metrics are constructed in the context of the metric ingestion protocol.
- How the data collected by the extension is processed and presented by Dynatrace.
Your environment can store up to 10 configurations per extension. One configuration can be active at any given time. To activate a specific configuration, activate the Enabled toggle.
Without an environment configuration, an extension is invisible to the Dynatrace platform.
Monitoring configuration
A monitoring configuration is specific to the data source type you want to monitor. It defines:
- From where the extension runs.
- For remote extensions, the endpoints that the extension calls to collect data, as well as credentials to access them.
- Connectivity properties, such as the timeout and number of retries in case of unsuccessful connection.
- The values of variables that will be passed to the environment configuration when it's necessary to customize the extension for the specifics of your data source instance.
You can create up to 100 monitoring configurations based on a single environment configuration and each of them runs in parallel.
To start monitoring using the extension, you must use an API call to add a monitoring configuration that will instruct Dynatrace on how to collect data from your data source.
Without a monitoring configuration, an extension is visible in the Dynatrace platform, but it doesn't collect any data.
-
See Oracle Database monitoring configuration to learn how to create an Oracle Database–specific monitoring configuration.
-
See Microsoft SQL Server monitoring configuration to learn how to create a Microsoft Database–specific monitoring configuration.
-
See IBM Database monitoring configuration to learn how to create an IBM Database–specific monitoring configuration.
-
See MySQL monitoring configuration to learn how to create a MySQL Database–specific monitoring configuration.
-
See PostgreSQL monitoring configuration to learn how to create a PostgreSQL Database–specific monitoring configuration.
-
See SAP Hana Database monitoring configuration to learn how to create a SAP Hana Database–specific monitoring configuration.
-
See Snowflake Database monitoring configuration to learn how to create a Snowflake Database–specific monitoring configuration.
-
See JDBC monitoring configuration to learn how to create a JDBC Database–specific monitoring configuration.
Extension package
Extensions are provided as a ZIP package containing only:
| File | Description |
|---|---|
| An archive containing the actual extension definition with all its assets. |
| A signature file: a digital signature for a ZIP archive. It ensures the integrity and authenticity of the ZIP file contents by verifying that it hasn't been altered and was signed by a trusted source. For details, see Sign extensions. |
| A signature timestamp file used to ensure the signature's validity over time (processed only for official extensions). |
Extension packages with different contents are not accepted for upload. The maximum size of an extension package is 25 MB.
bundle.zip│ extension.zip│ extension.zip.sig│ extension.zip.sig.tsr
Dynatrace CLI
The Dynatrace CLI (dt-cli) is a command-line utility that assists you in developing, signing, and building extensions for the Dynatrace Extensions framework.
With Dynatrace CLI you can:
- Build and sign extensions from source
- Generate development certificates for extension signing
- Generate CA certificates for development
For details, see Sign extension and the dt-cli project on GitHub.
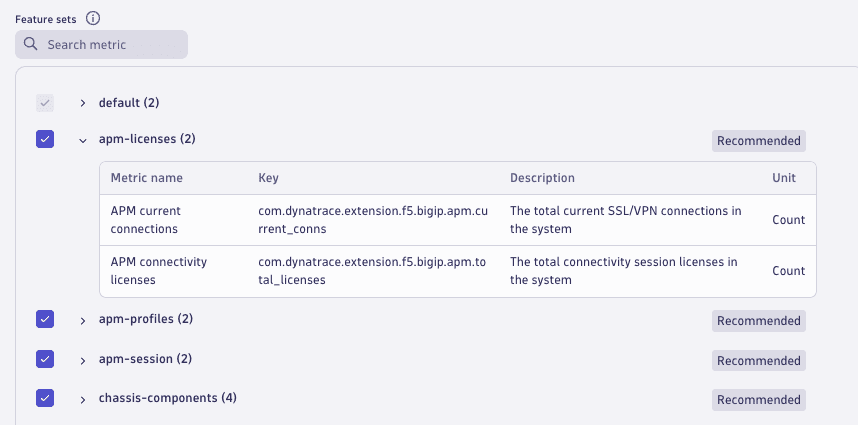
Feature sets
A feature set is a group of metric keys, which are defined in the extension's configuration. You can activate or deactivate feature groups in the UI or in the JSON file. When a feature set is activated, all metrics in that feature set are reported. If a metric is not in a feature set it is always reported. Imagine an SNMP extension that monitors your network devices and collects metrics related to NIC status, the transport layer, and SNMP traps. You can use feature sets to customize your monitoring, for example, by activating only the feature sets that relate to specific devices or ActiveGates. The extension will still monitor other non-related devices, but will not report those metrics.
Configurations and limitations
Before deploying extensions, be aware of current limitations to ensure you can meet your monitoring goals effectively.
Access control and required permissions
Working with Extensions requires specific permissions to manage extensions lifecycle, configure monitoring, and secure sensitive data.
- If you use Dynatrace Hub, you need the classic Manage monitoring settings permission in your group to modify the monitoring configuration.
- If you authenticate the API with the tenant token, your token needs
extensions.readandextensions.writepermissions.

 Extensions