Dynatrace SaaS release notes version 1.260
- Latest Dynatrace
- Release notes
- Published Jan 31, 2020
Rollout start: Feb 13, 2023
Product news
- Find vulnerabilities in your code—don’t wait for someone to exploit them
All-new Dynatrace code-level vulnerability detection evaluates all requests passing through your applications.
Announcements
New Documentation structure
We've improved the structure of Dynatrace Documentation.
The most important changes are:
- The Platform modules section organizes the articles to facilitate an understanding of Dynatrace end-to-end observability with AIOps and application security.
- The Observe and explore section groups articles focusing on the platform observability.
- The Manage section groups articles targeted at a platform administrator.
Stay tuned for more updates to Dynatrace Documentation!
Davis Assistant end of life
Dynatrace Davis Assistant has reached end of life on January 31, 2023. For options and best practices on managing the push of problem notifications to your preferred third-party incident management or ChatOps service, see problem notifications documentation.
New features and enhancements
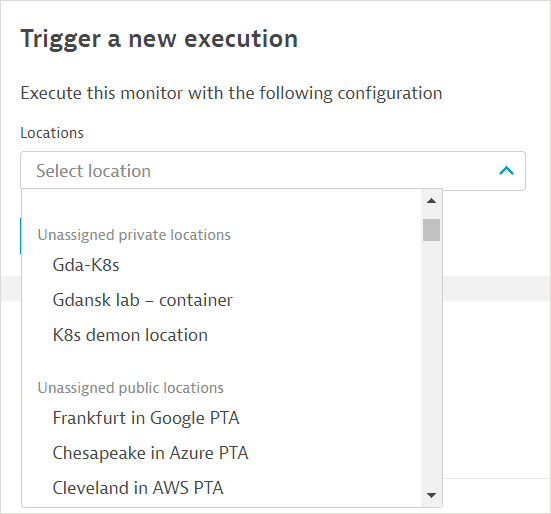
On-demand synthetic monitor executions from any location via the UI
Digital Experience | Synthetic Monitoring
In addition to executing browser and HTTP monitors on demand from assigned locations via the Dynatrace web UI, you can now execute these monitors from any unassigned private or public location as well.

View any user action for mobile and custom applications
Digital Experience | RUM Mobile
Before this release, you could only view the top 100 user actions on the User action analysis page. Now you can analyze any user action. Under Top 100 user actions, select All user actions in the Search mode dropdown list, and then start entering a keyword in the search box.

Workload conditions on the notification bar
Infrastructure Monitoring | Kubernetes
A new Conditions section is displayed on the notifications bar on the Kubernetes workload details page when API monitoring is enabled. It indicates whether there are potential problems with the Kubernetes workload deployment status. For example, a Progressing=False status indicates that the workload is stuck.

Select it for additional information.

If there are no Kubernetes workload conditions, the Conditions section is not displayed on the notification bar.
Mute or unmute third-party vulnerabilities in bulk
Application Security | Vulnerabilities
You can now select multiple entries and do bulk operations, such as muting and unmuting, on the following Application Security pages:
- Third-party vulnerabilities
- Code-level vulnerabilities
- Process group overview related to a vulnerability
New placeholders available for vulnerability notifications
Application Security | Vulnerabilities
On the Security notifications settings page, three additional placeholders are available in the custom payload for vulnerability alerts for the webhook, Jira, and email integrations:
{ManagementZones}{Tags}{Tags[key]}
For more information on security notifications, see Security notifications for vulnerabilities.
Persisting organization name when API monitoring is disabled
Infrastructure Monitoring | Cloud Foundry
The Cloud Foundry organization name is still displayed on the process group details page, in Properties and tags, even when API monitoring is disabled (requires OneAgent version 1.258+).
Data Explorer - query operator set expanded
Cross Solutions | Data Explorer
The Data Explorer query builder now offers the following transformations/operators in regular build mode:
- Default
- Filter By
- Limit
- Rate
- Sort By
- Split By
- Timeshift
For details, see Data Explorer.
Dashboards - smart resolutions
Cross Solutions | Dashboards
To prevent performance issues on dashboard tiles created with Data Explorer, the maximum number of data points for a query on a dashboard tile is 4,000. Based on the selected timeframe and the applied custom resolution, Dynatrace projects the number of data points for the query result. If the projected number of data points exceeds 4,000, Dynatrace automatically switches to a resolution high enough to keep the number of data points below 4,000.
Note that this does not apply to visualizations in Data Explorer itself, where you can have more than 4,000 data points. It applies only to dashboard tiles created with Data Explorer where the resolution/timeframe combination selected on the dashboard results in more than 4,000 data points.
Application Security API
The following endpoints of the Application Security API are now available in GA:
- Environment API Davis Security Advisor API
- Environment API Security problems API - GET problem events
The following endpoints of the Application Security API are now available in Early Adopter release:
- Environment API
POST/securityProblems/mute - Environment API
POST/securityProblems/unmute - Environment API
POST/securityProblems/{id}/remediationItems/mute - Environment API
POST/securityProblems/{id}/remediationItems/unmute
Dynatrace API
To learn about changes to the Dynatrace API in this release, see Dynatrace API changelog version 1.260.
Resolved issues
General Availability (Build 1.260.133)
The 1.260 GA release contains 8 resolved issues.
| Component | Resolved issues |
|---|---|
| Application Security | 1 |
| Cluster | 5 |
| Synthetic monitoring | 1 |
| metric query | 1 |
Application Security
- The comment field is no longer mandatory in the following endpoints: `/securityProblems/\{id}/mute`, `/securityProblems/\{id}/unmute`. (RSA-7819)
Cluster
- Fixed an issue in which metric events created or modified via Metric events API starting from version 1.257 had incorrect audit information. This bug neither impacts the authentication of API calls nor reveals secret parts of the API tokens to other Dynatrace users. (DAVIS-3420)
- The "Services" table now correctly lists all appropriate metrics (now also includes data with a `span.kind` of `consumer`). (TI-4794)
- Closing the problem timeframe works again after navigating to Kubernetes settings and back via the breadcrumb bar. (DAVIS-3159)
- Fixed a performance issue on Kubernetes list pages. (TI-5150)
- Fixed an infrequent problem on the provider details page for mobile and custom applications. (RUM-8981)
Synthetic monitoring
- Fixed issue causing `Cannot read properties of null (reading 'hasMonitors')` Angular exception. (SYNTH-3691)
metric query
- Fixed host and PGI connectivity metrics holding a value of 100% even when no traffic is reported. (CLUSTER-4147)