What's new in Dynatrace SaaS version 1.314
- Release notes
- 10-min read
- Rollout start on May 6, 2025
This page showcases new features, changes, and bug fixes in Dynatrace SaaS version 1.314. It contains:
Platform | Workflows
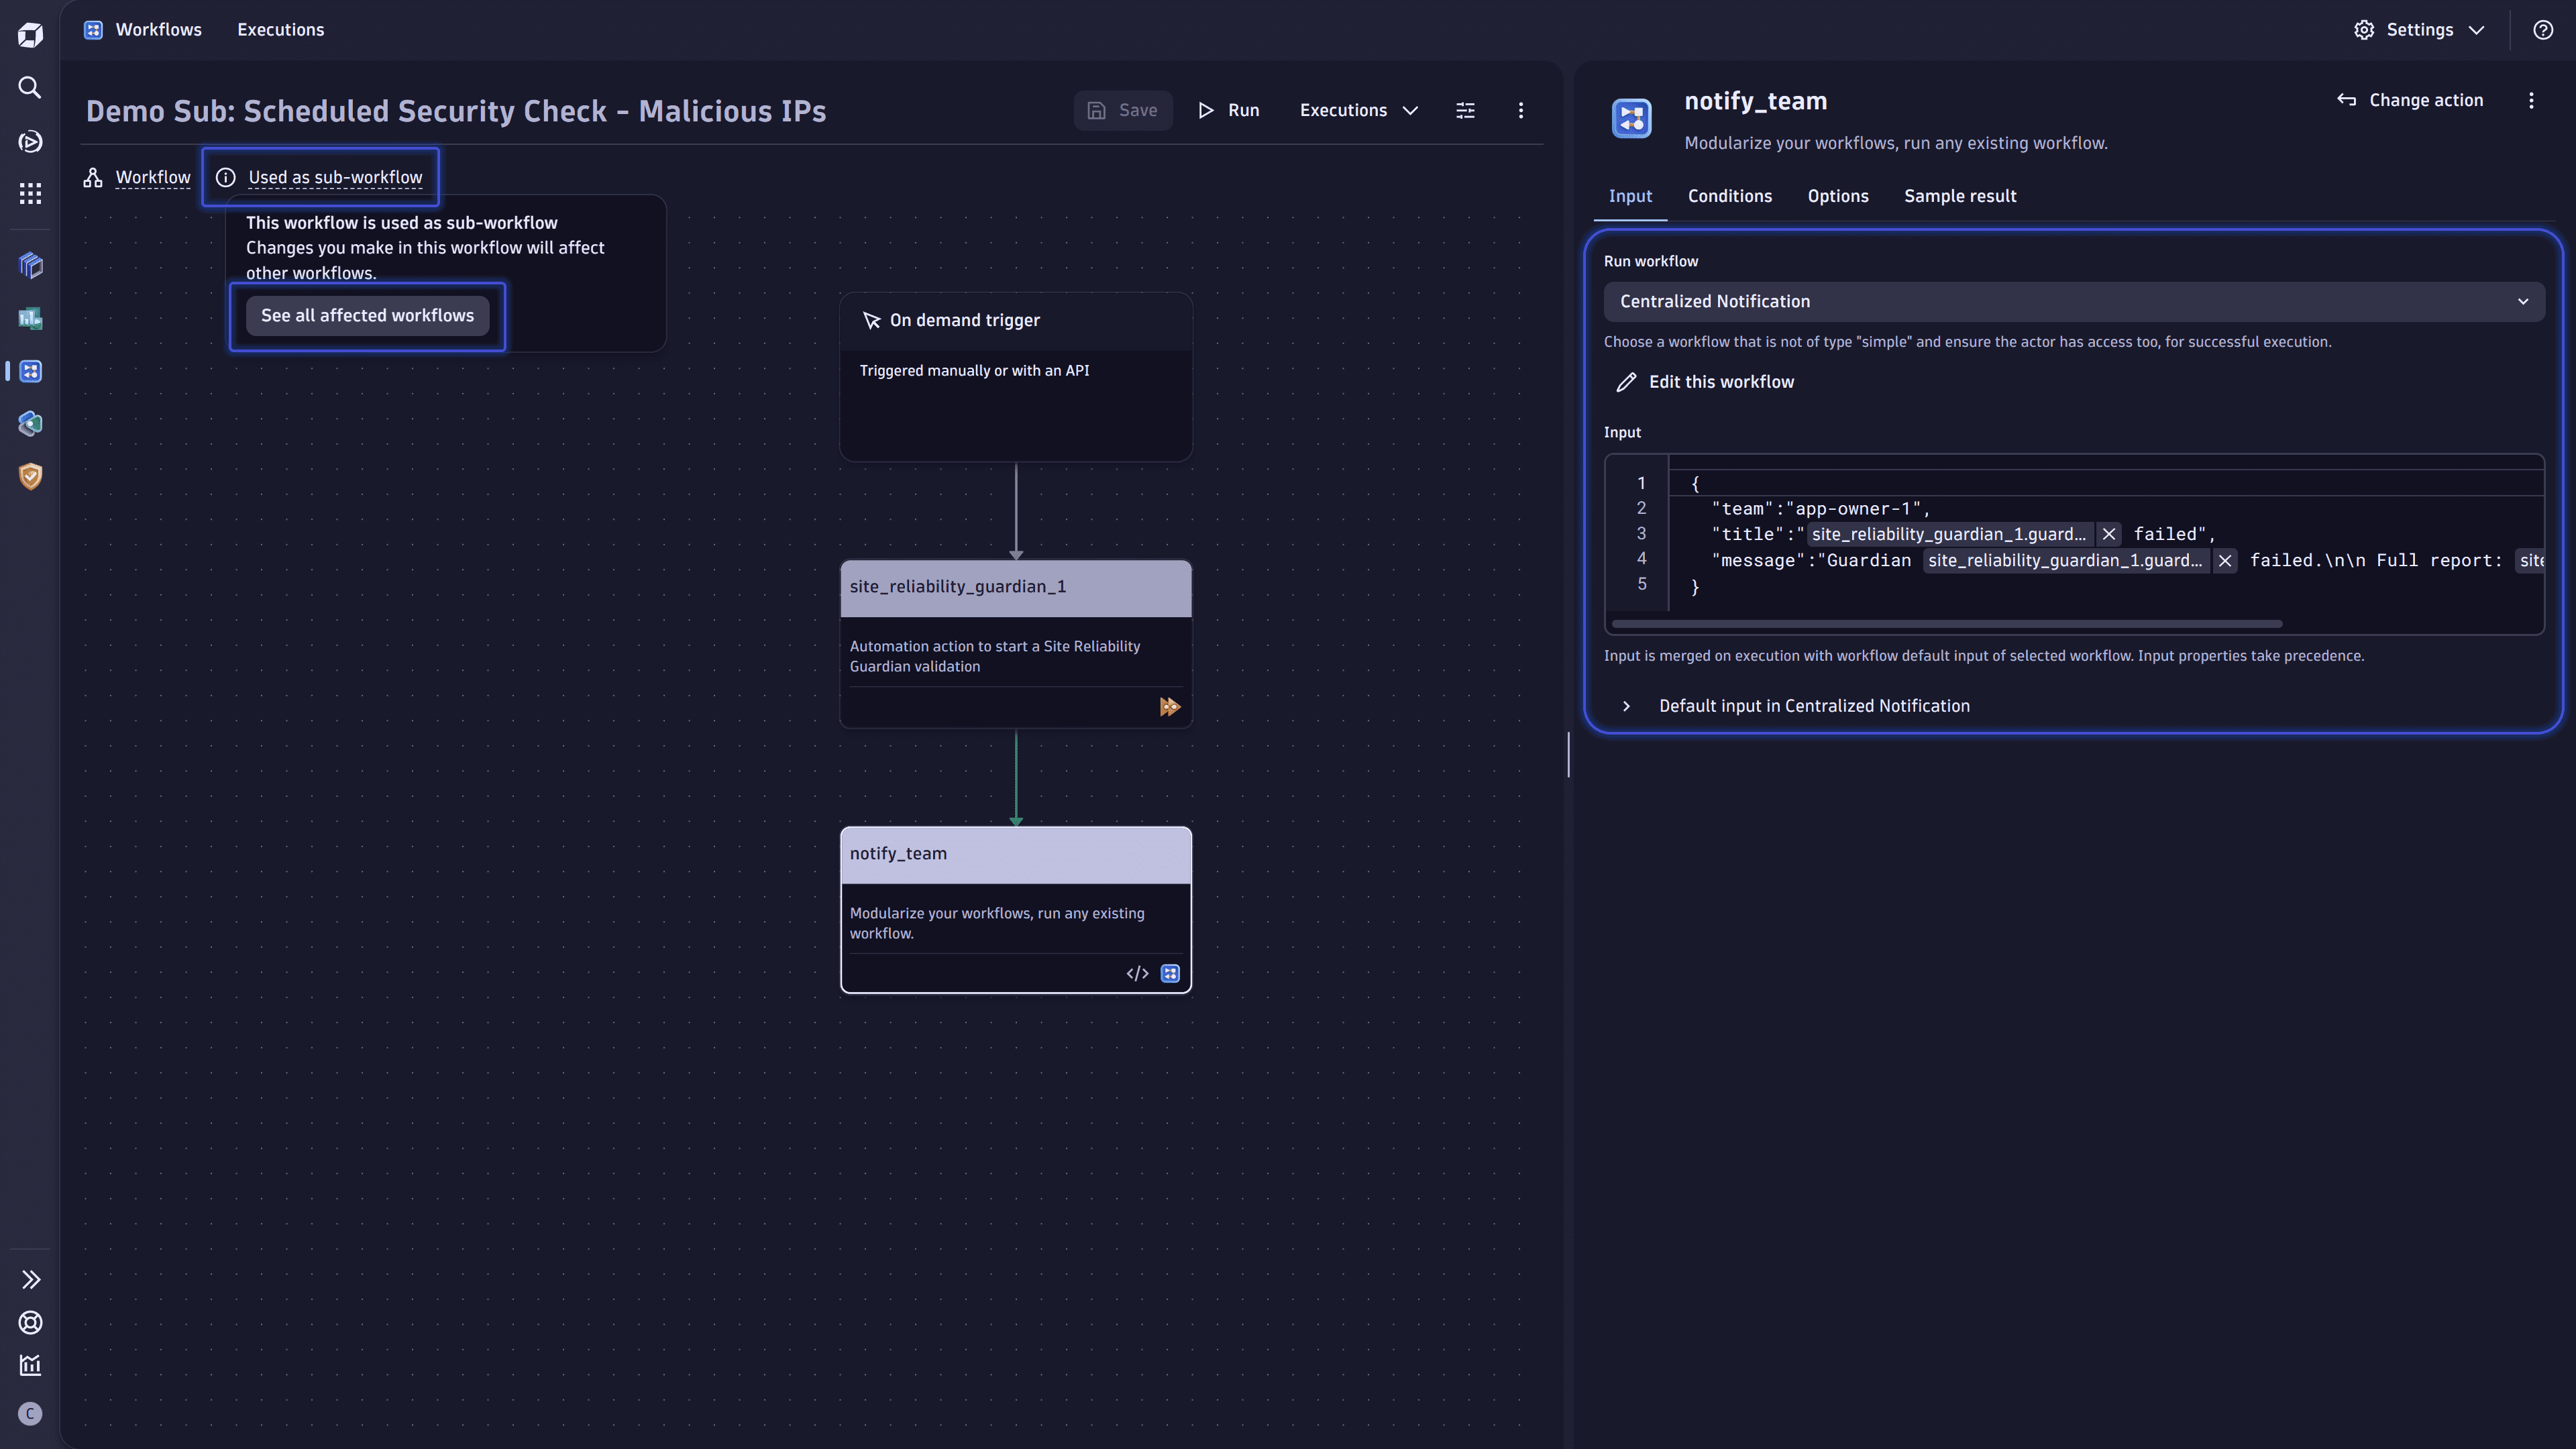
Improved flexibility for automating manual tasks: less complexity and time needed by using subworkflows
Create a library of (sub)workflows, dealing with recurring tasks to reduce maintenance efforts for configuring and managing automations, improve the quality of your workflows, and reduce the time needed for automating tasks.
Within Workflows, running a complete existing workflow as a single task in another workflow is now possible. Extract parts of existing workflows, such as data enrichment or lookup tasks, and reuse them in other workflows.
Use workflow inputs and results to pass data, add conditions, and define options such as wait, looping, retry on error, or adding timeouts to ensure smooth operations of your workflows.
Feature updates
Notebooks and Dashboards
New Notebooks and Dashboards heatmap visualization
We have added a new heatmap visualization for  Notebooks and
  Dashboards.
The heatmap visualization offers a compact and flexible matrix visualization for visualizing aggregated datasets.
- When you want to identify patterns and outliers across metrics in large aggregated datasets
- When you want to correlate and compare time, numerical, and categorical-based metrics with one another
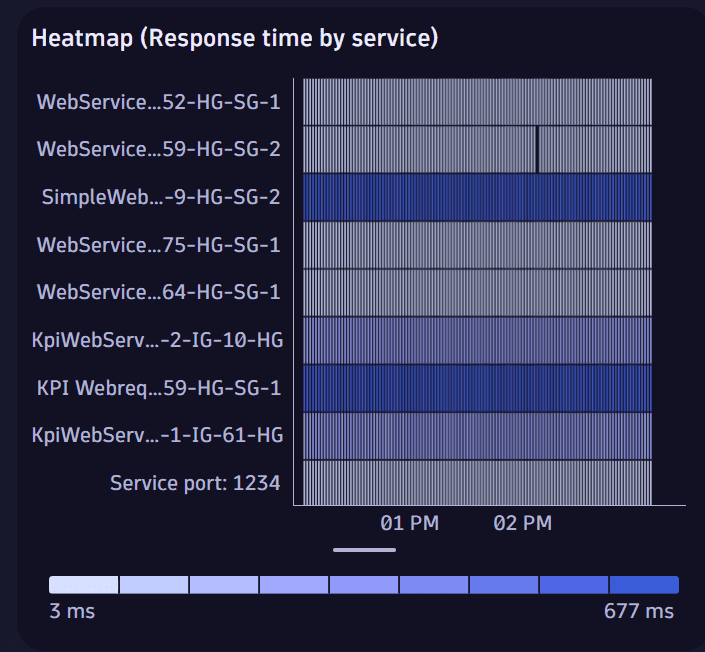
For more about heatmaps in Notebooks and Dashboards, see Heatmap visualization.
Notebooks and Dashboards
Improved Notebooks and Dashboards table visualization
We have updated Notebooks and Dashboards to the latest data table. The highlights of the new table visualization are:
- Better performance for large data sets
- New, unified interaction pattern: right-click to open cell and column actions
- Nested records are now directly displayed as table sub-columns (up to two levels)
- Possibility to reorder table columns
- Improved menu to show/hide table columns
For more about tables in Notebooks and Dashboards, see Table visualization.
OpenPipeline
Ease your transition to OpenPipelines with enhanced LQL support
If you have been using log processing classic rules and writing your LQL rules (pre-processors), you can now easily transition to OpenPipeline without disrupting or rewriting your existing rules.
Automatically convert queries to enjoy the enhanced scalability, performance benefits, and improved functionalities of OpenPipeline.
Account Management
New Billing Usage Events for host Monitoring DPS capabilities
Billing Usage Events (BUEs) on the host level have been introduced for the following DPS capabilities:
- Full-Stack Monitoring
- Infrastructure Monitoring
- Foundation & Discovery
- Runtime Vulnerability Analytics
- Runtime Application Protection
These events provide usage insights on 15-minute intervals split by monitored hosts. You can find example notebooks showing how to analyze these events on the subscription overview of the Account Management portal.
Platform
Get full flexibility in naming metrics, with unified metric creation across data types now possible
We've made it easier to name your metrics according to your own practices by removing mandatory prefixes from metric keys. This also lets you create metrics from various configuration scopes, enabling unified metrics based on different data types, like logs and spans.
Infrastructure Observability | Log Monitoring
Added LQL support for OpenPipeline
You can now start using OpenPipeline for existing classic log processing rules.
By adding LQL support to OpenPipeline, we removed the necessity to manually convert LQL matchers to DQL to make use of the improved scalability and processing capabilities of OpenPipeline.
Infrastructure Observability | Azure
Migration to Microsoft Authentication Library (MSAL)
The Infrastructure monitoring of Azure cloud services via Azure Monitor doesn’t depend on the deprecated Azure Active Directory Authentication Library (ADAL) as we have fully migrated to Microsoft Authentication Library (MSAL). This update improves security and aligns with Microsoft’s recommended authentication approach.
Account Management | Subscriptions and Licensing
Try out new Dynatrace functionalities without incurring costs
Customers running on DPS (Dynatrace Platform Subscription) can now safely try out new Dynatrace capabilities on their existing environments without incurring any usage costs.
If you're interested in exploring more, talk to your Dynatrace contact.
Application Observability | Services
Added problem details to Services app
We have added problem details to  Services, giving you more insights in the context of a service view without leaving the app.
When you're investigating the health and performance of services using Services, you now get the full root cause and problem details presented within the app, offering all the insights necessary to investigate issues and speed up troubleshooting.
When you open Services, detected issues are surfaced by a red health alert in the health overview. Select it to show all the details of the identified Davis problems, whether it’s a single problem or multiple problems.
Platform | Segments
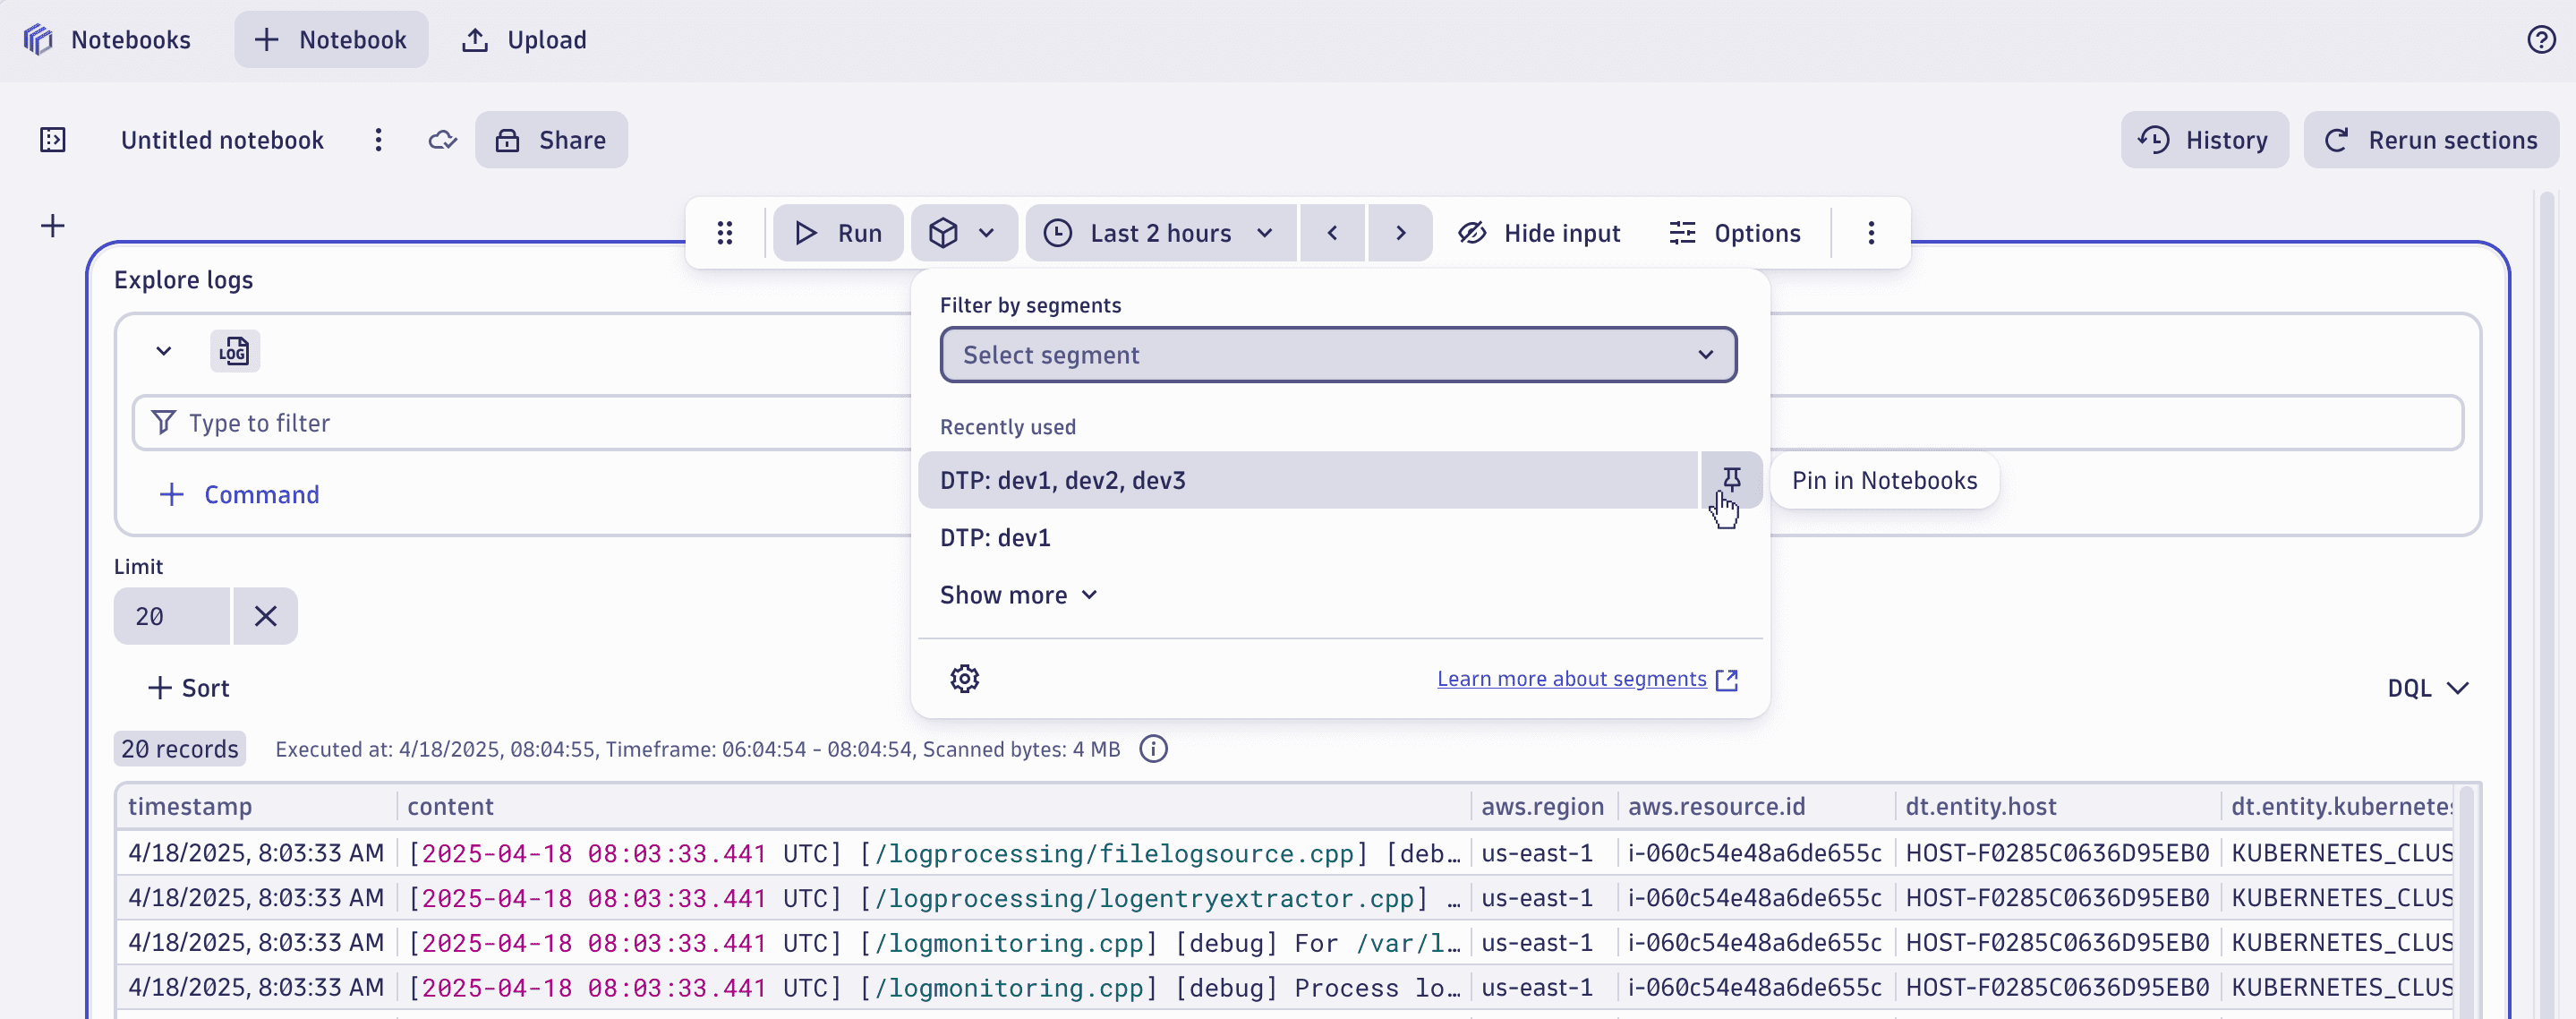
Pin recently used segments to your segment filter list
You can now pin recently used segments to ensure they always stay on top of the segment selector. This avoids the need to browse long lists of segments, boosting the efficiency of data analysis.
This new functionality is available for all apps supporting the use of Segments.
For an example use in the Notebooks app, see Pin recent selections for quick access.
Dynatrace Hub
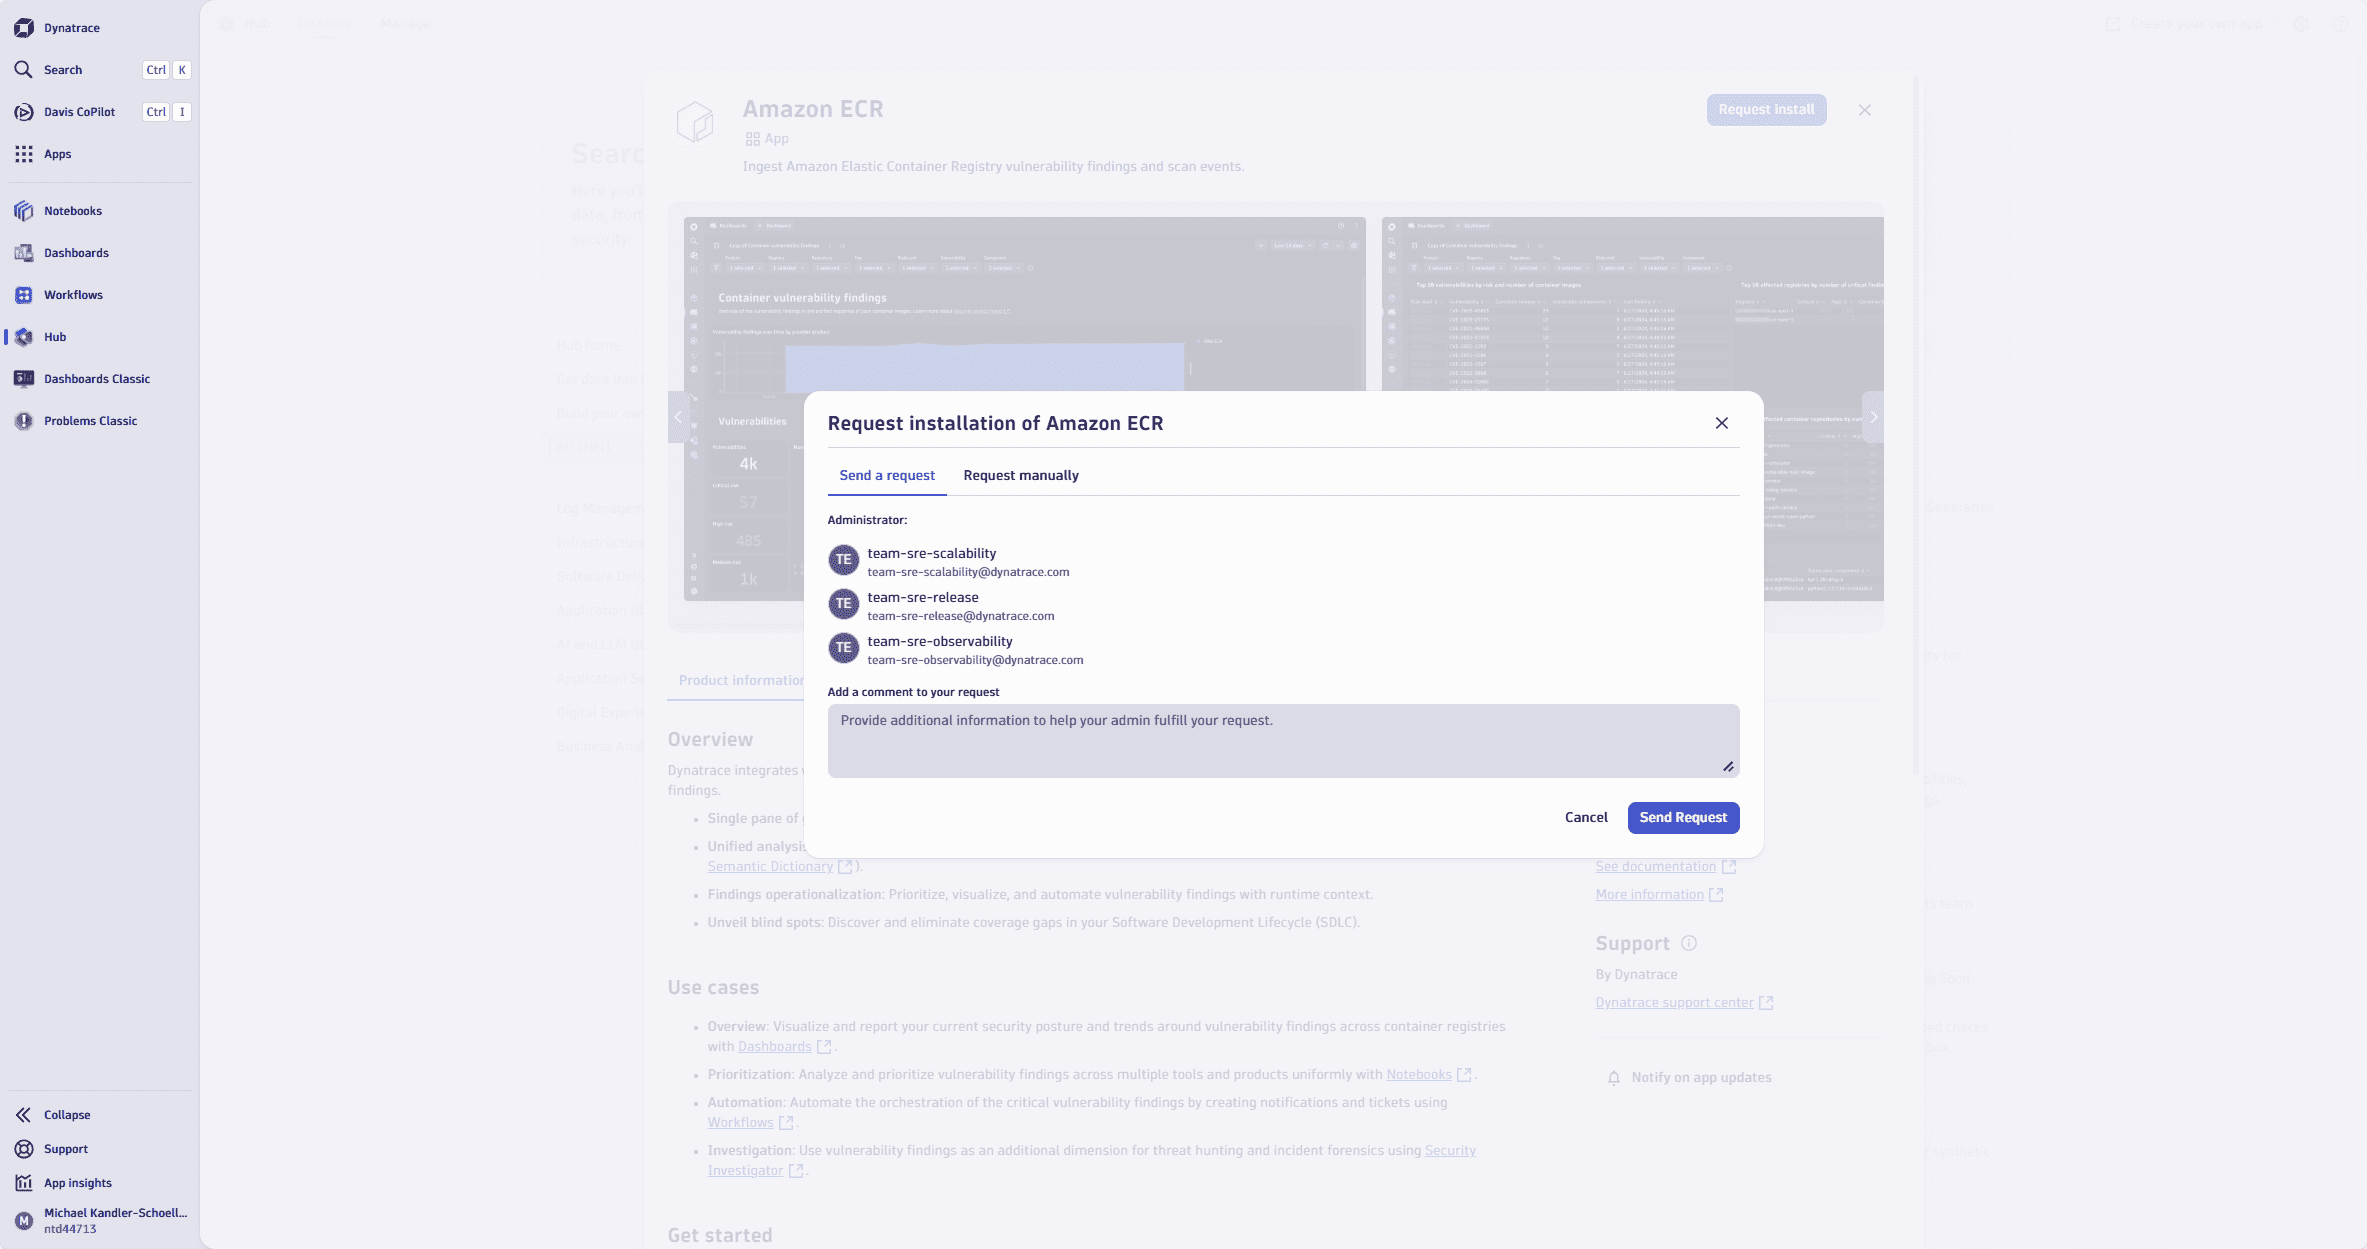
Request installation of a Dynatrace extension via Hub
To make it easier to onboard new technologies and data sources for monitoring with Dynatrace, your users can now request, via Dynatrace Hub, that your Dynatrace admins install an extension.
When a new extension is requested, admins are automatically notified.
To offer your users this new functionality, you first have to configure responsible admins.
Automations | SLOs
SLOs now support segments
The SLO definition now supports segments to either search for relevant entities or tailor the data considered for the SLI calculation.
- Defining segments as part of an SLO allows you to tailor generic SLI definitions to the relevant data based on the segment definition.
- When visualized in a dashboard, the SLO takes a segment on the dashboard into account. Considering dashboard segments allows for a dynamic adjustment of the relevant data points when evaluating an SLO.
Platform | DQL
Explore data easily with the new search command in DQL
The new search command in the Dynatrace Query Language (DQL) empowers you to locate specific data in Grail easily, enhancing your ability to perform efficient troubleshooting, monitoring, and in-depth analysis.
The search command simplifies your data exploration process, making it faster and more intuitive to find exactly what you need when you need it.
Instead of adding filter statements for each attribute, you can use a simple query:
fetch spans| search "exception"
To learn more, see DQL filter and search commands.
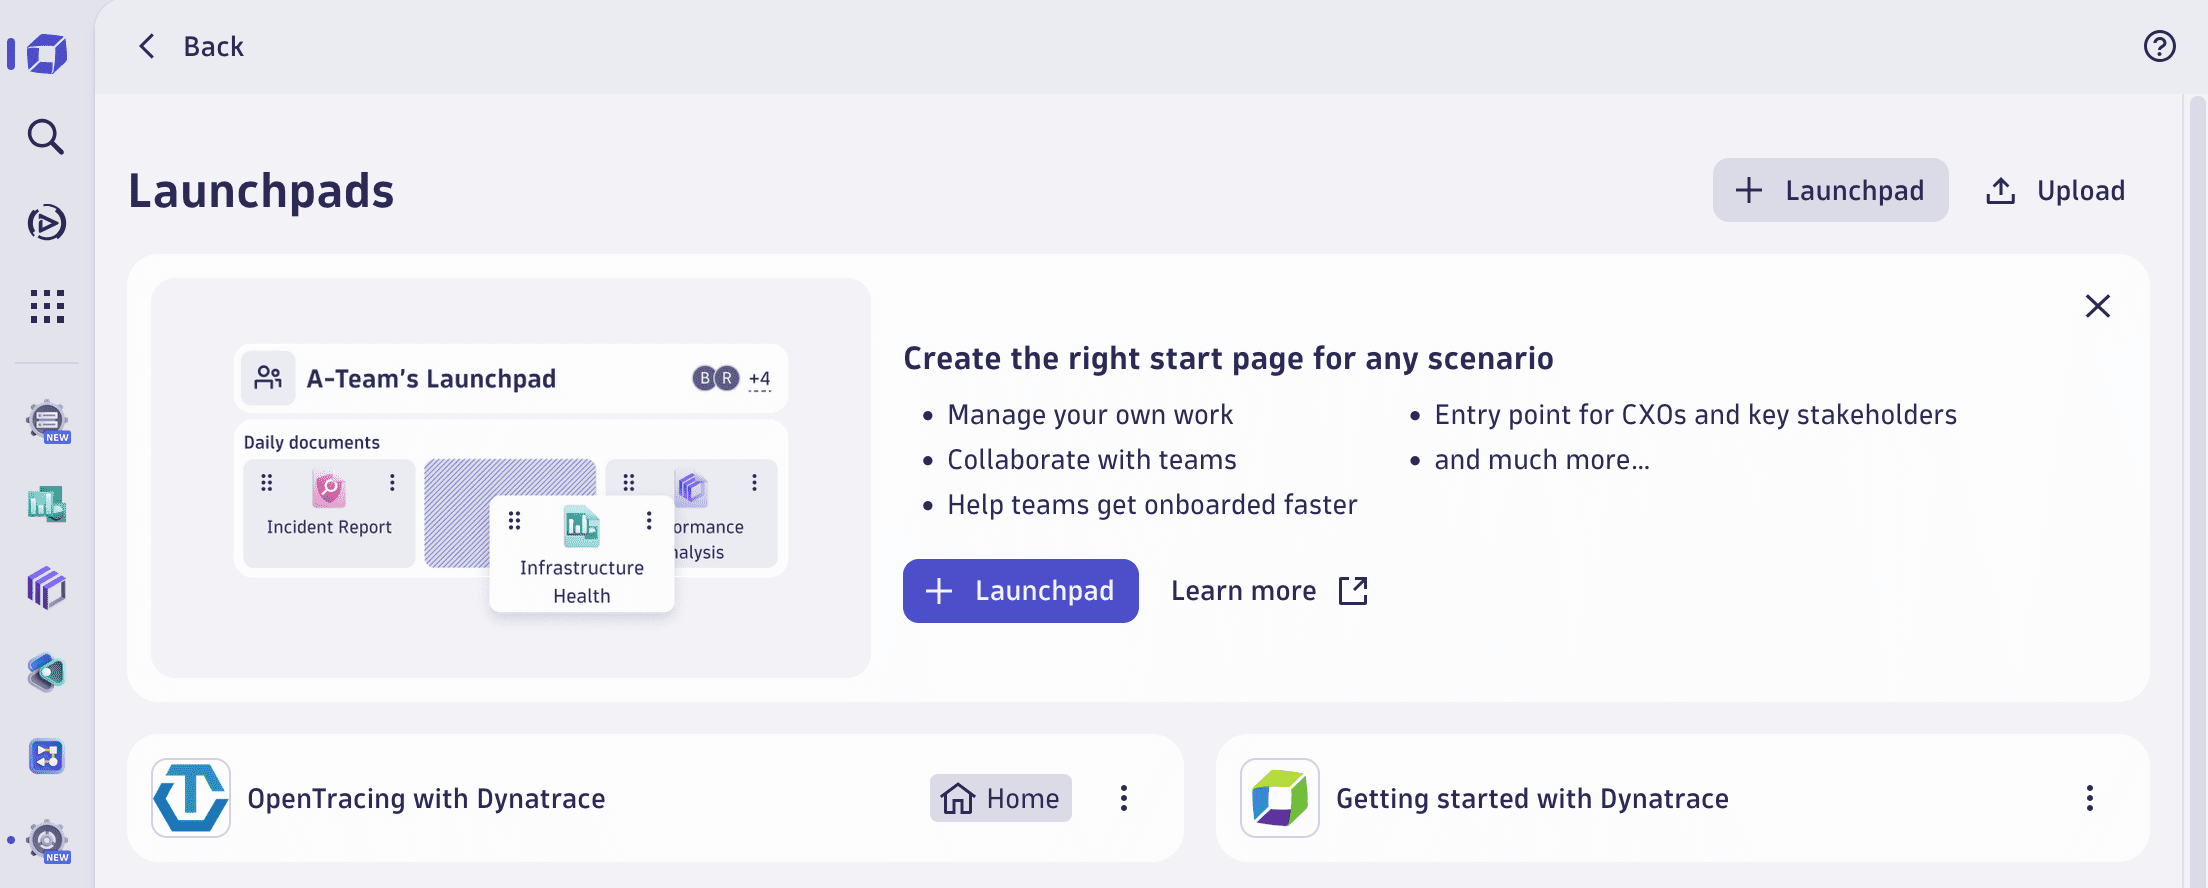
Platform | Launchpads
Take control of your user start page with home launchpads
With the introduction of Home launchpads you can now centrally define individual start pages tailored for selected teams or user groups.
Start rolling out Home launchpads in your organization to offer your users a customized experience and improve their daily Dynatrace experience.
Software Delivery | SLOs
 Service-Level Objectives supports latest data tables
As part of unifying interaction with data tables in Dynatrace, Service-Level Objectives and management views now support the new data tables and interaction experience for an improved user experience and smooth data table interactions.
For app details, see Service-Level Objectives.
Platform | Davis
Change in delay for root cause analysis
Events that don't trigger a full root cause analysis will no longer wait 3 minutes before notifying. The main cases for this are custom triggered events, such as an AVAILABILITY_EVENT via the REST API.
In addition, the dt.davis.analysis_trigger_delay is now preferred over the internally defined three-minute default for some availability-type events. If dt.davis.analysis_trigger_delay is set, it is the only delay considered for root cause analysis.
Digital Experience
Browserless private Synthetic locations reduce hardware requirements to execute NAM and HTTP synthetic monitors
In general, we recommend the deployment of complete synthetic private locations to support the execution of all types synthetic monitors (HTTP, browser, NAM).
If you don't need to run browser monitors, consider deploying your location in browserless mode. This mode deploys the location (or ActiveGate belonging to it) without a browser, reducing hardware requirements. However, browser monitors can't run on a browserless location.
Consider browserless locations as an alternative to standard synthetic private locations when you’re focused purely on:
- Network and infrastructure use cases (using NAM monitors)
- API monitoring (using HTTP monitors)
Account Management | Identity Access Management
Added new permissions for ingest scopes in OpenPipeline
With the introduction of new permissions for the Ingest API, admins are now able to set permissions for each individual endpoint. OpenPipeline ingest endpoints now accept OAuth tokens with the following permissions:
openpipeline:security.events:ingestopenpipeline:events:ingestopenpipeline:events.sdlc:ingestopenpipeline:security.events.custom:ingestopenpipeline:events.custom:ingestopenpipeline:events.sdlc.custom:ingest
Use the Account Management web UI to create OAuth clients using these newly introduced scopes.
Platform | Grail
Improved context for failed DQL queries
Admins use query execution events (dt.system.query_executions) to get insights into what’s happening during the execution of each query sent to Grail.
We have added more context and details (such as query load) to events documenting failed queries. Use sample queries such as the following to perform detailed analysis, simplifying troubleshooting tasks.
fetch dt.system.query_executions| filter status == "FAILED"| filter client.application_context == "dynatrace.dashboards"| filter failure_reason == "INSUFFICIENT_PERMISSIONS"
For more information, see Query Execution Events in the Semantic Dictionary.
Digital Experience | Synthetic
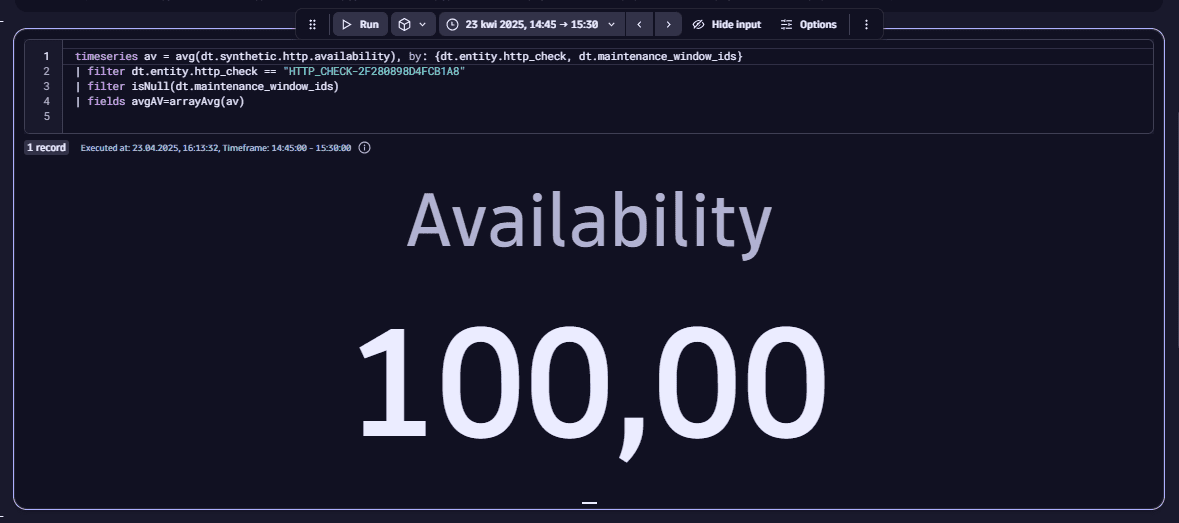
Maintenance Windows dimension for Synthetic Availability metric in Grail
We have introduced the maintenance windows dimension (dt.maintenance_window_ids) to the Synthetic Availability metric in Grail. This enhancement allows you to manage and exclude maintenance windows from availability calculations, providing a more accurate metric value.
Advantages:
- Ensures consistency with the Availability metric values on the embedded classic charts and the "Availability rate - excluding maintenance windows" metric in classic Dynatrace.
- Improves distinction between planned maintenance and unexpected downtime in the monitoring results.
Breaking changes
Digital Experience | Synthetic
Browser monitor Grail metric changes
The following changes have been made to browser monitor Grail metrics.
Metric key changes
| Old key | New key |
|---|---|
dt.synthetic.browser.event.duration | dt.synthetic.browser.step.duration |
dt.synthetic.browser.event.executions | dt.synthetic.browser.step.executions |
The event metrics will be deprecated.
Renamed metrics
The former browser monitor Total duration metrics have been renamed to Duration (user-friendly name only; the metric key remains the same).
| Metric key | Old name | New name |
|---|---|---|
dt.synthetic.browser.duration | Total duration [Browser monitor] | Duration [Browser monitor] |
dt.synthetic.browser.step.duration (formerly dt.synthetic.browser.event.duration) | Total duration (step) [Browser monitor] | Duration (step) [Browser monitor] |
New metrics
| New metric key | New metric name |
|---|---|
dt.synthetic.browser.classic.total_duration | Total duration (classic) [Browser monitor] |
dt.synthetic.browser.classic.step.total_duration | Total duration (classic) (step) [Browser monitor] |
Fixes and maintenance
Resolved issues in this release
- Heatmap datapoints now reflect the start of the bucket instead of its end. (PAPA-24449)
- Problems Classic: Fixed a case where the problem details page didn't show a duplicate problem as a duplicate. This could happen when problem A linked to problem B, which linked to problem C, and the web UI was opened for problem A. (DI-19998)
- Dashboards Classic: Fixed position of "Clone to" pop-up for small dashboard tiles in the first row of the dashboard. (PAPA-24813)
- Updating a synthetic location with an offline ActiveGate is now possible. (DEM-7194)
- The built-in processors that extract the trace/span context from the raw log content now scan up to 16 MB instead of 4 KB. Thanks to this fix, larger JSON logs can have a proper trace context. (PPX-5206)
- Fixed issue with inability to disable technology bundle processor in the OpenPipeline. (PPX-5073)
- Updated IBAN masking regex for Log Analytics. Dynatrace Entity ID should no longer be masked. (OA-43816)
- It's now possible to delete tenant-specific network zones if they're in use and a corresponding global network zone (same name) exists. (MGD-3293)
- Fixed location status handling for multi-node synthetic private locations. (DEM-7415)
Dynatrace API
To learn about changes to the Dynatrace API in this release, see Dynatrace API changelog version 1.314.