Analyze monitoring data with segments
- Latest Dynatrace
- Tutorial
- 3-min read
- Published Mar 29, 2023
Learn how to analyze monitoring data more efficiently by using segments in Dashboards.
Who this is for
This article is intended for all users aiming to efficiently analyze monitoring data in different apps on the Dynatrace platform.
What you will learn
In this article, you'll learn how to use segments to make analyzing monitoring data more efficient.
Before you begin
Prior knowledge
Dynatrace apps supporting segments:
- Dashboards

- Notebooks

- Problems

- Workflows

- Distributed Tracing
- Discovery & Coverage
Support for segments in further apps will follow. Watch for updates.
Prerequisites
- Dynatrace SaaS environment powered by Grail and AppEngine.
- You have
storage:filter-segments:readpermission. To learn how to set up the permissions, see Permissions in Grail.
Steps

Apply a segment to filter data on your dashboard

Select multiple values for more flexible filtering

Pin recent selections for quick access
 Apply a segment to filter data on your dashboard
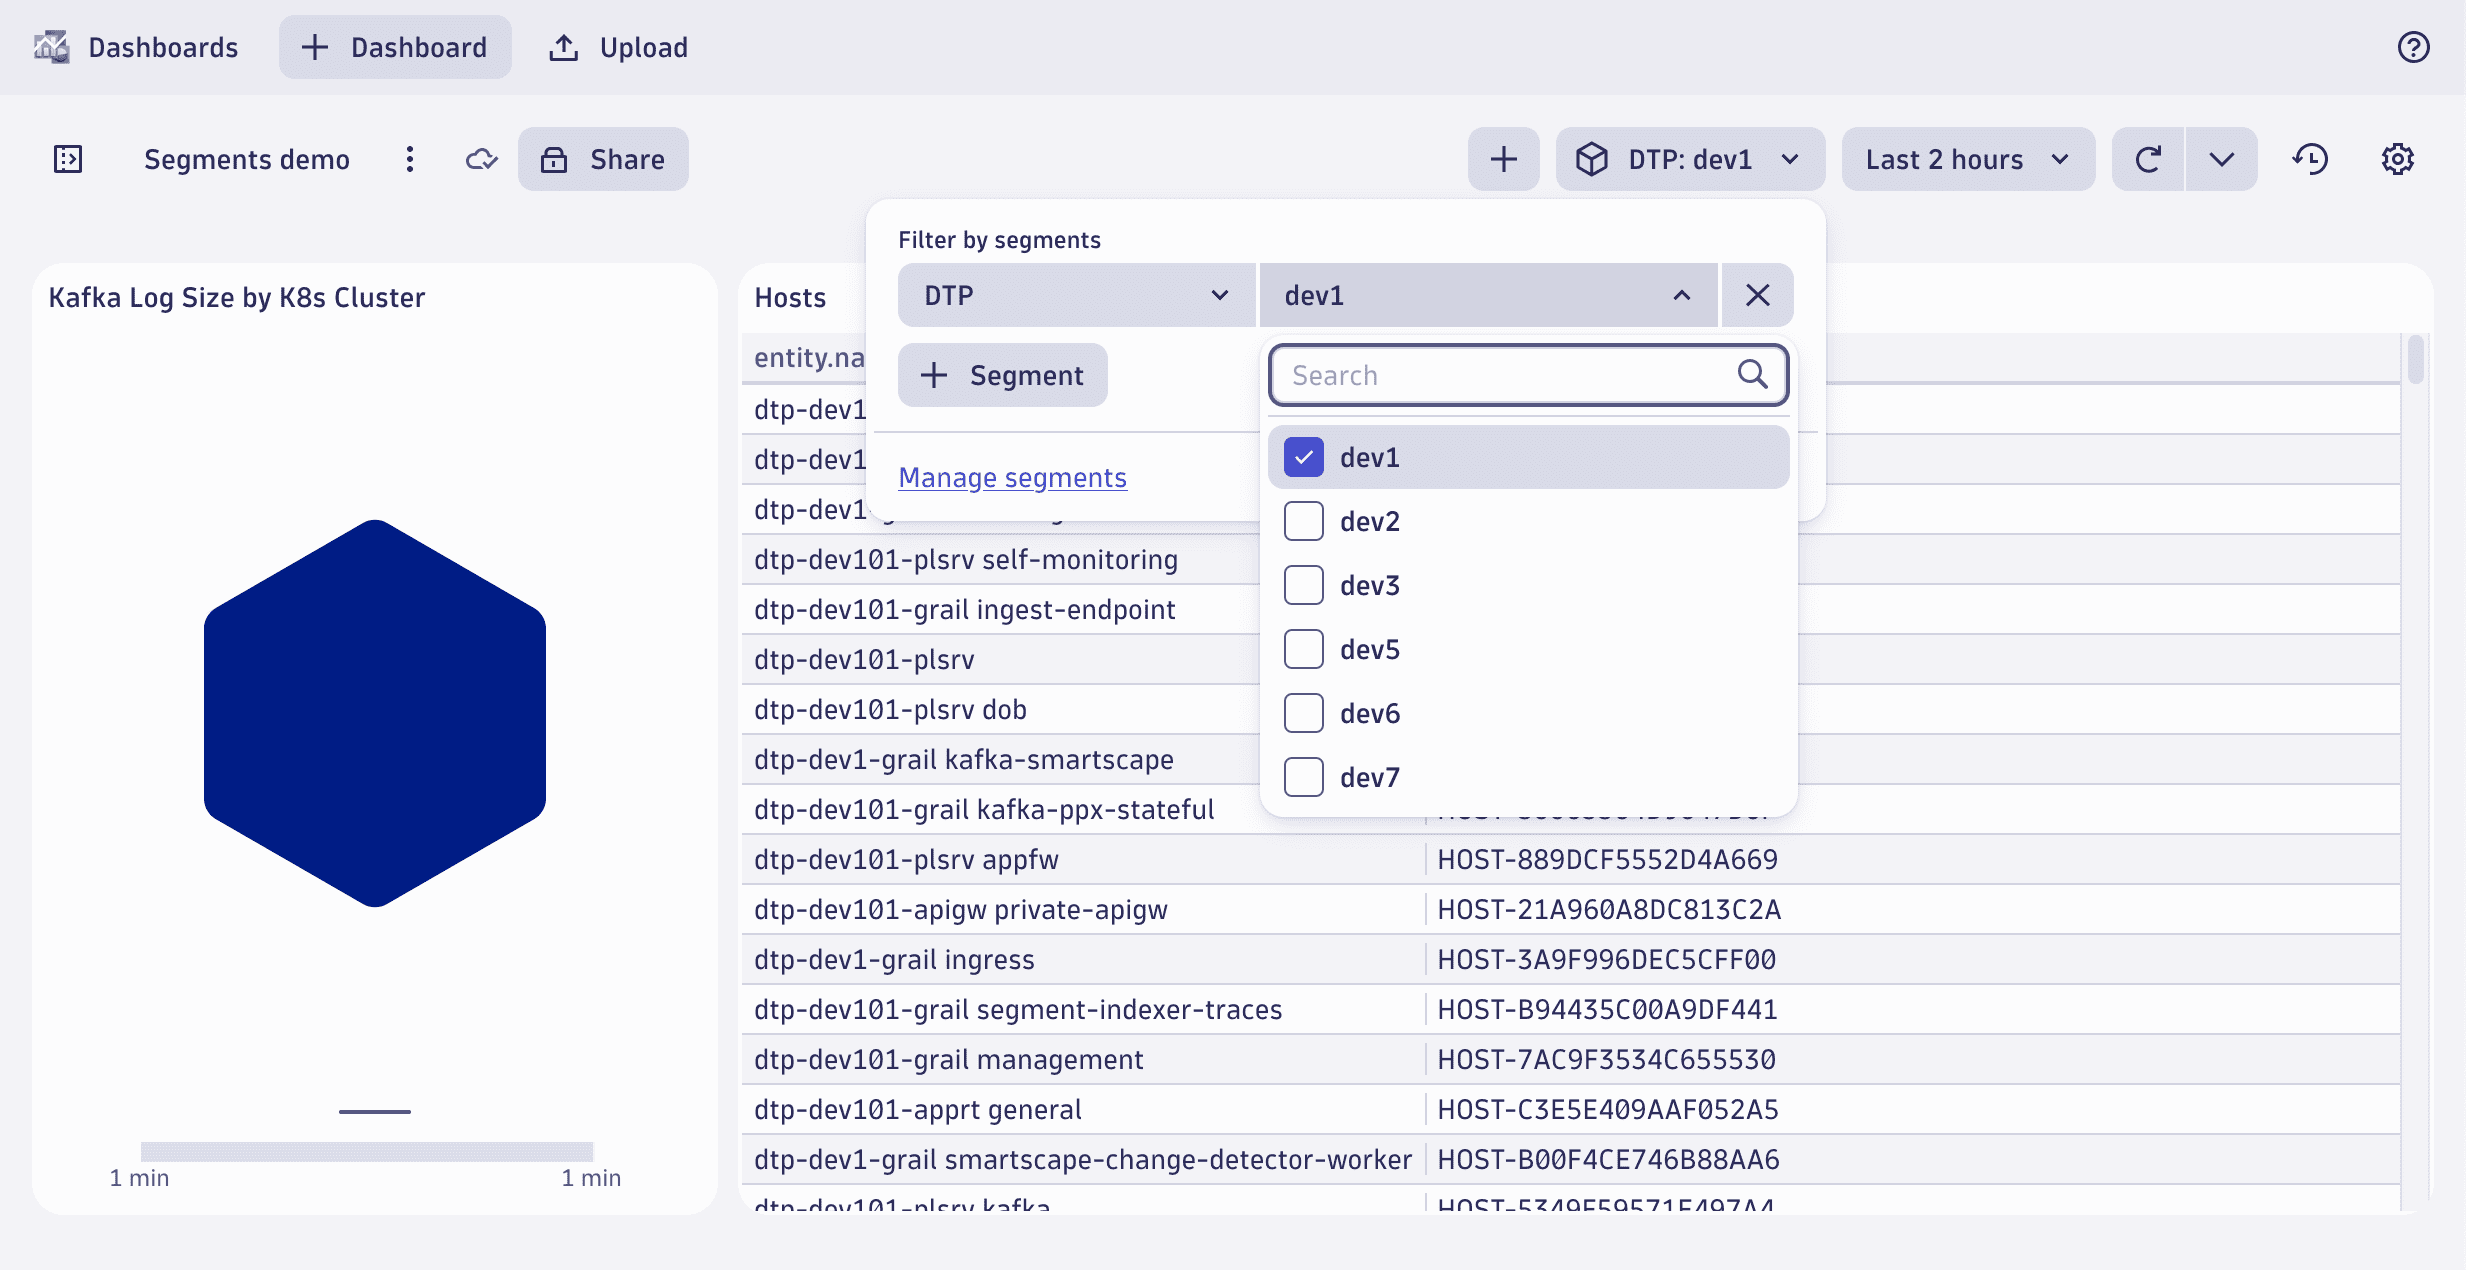
Segments provide quick access to predefined logical filters. Like Dashboards, many applications in Dynatrace feature a segment selector, giving access to the list of available segments. You can search by name the segments in the segment selector.

- Go to Dashboards and select a dashboard
- Open the segment selector and, in Filter by segments, select the segment by name
- Select one or more values for the variable in the selected segment
- Select Apply to apply the selection and filter data on the dashboard
After segments are selected, apps will either automatically update data to match selected segments or require user interaction to update.
 Select multiple values for more flexible filtering
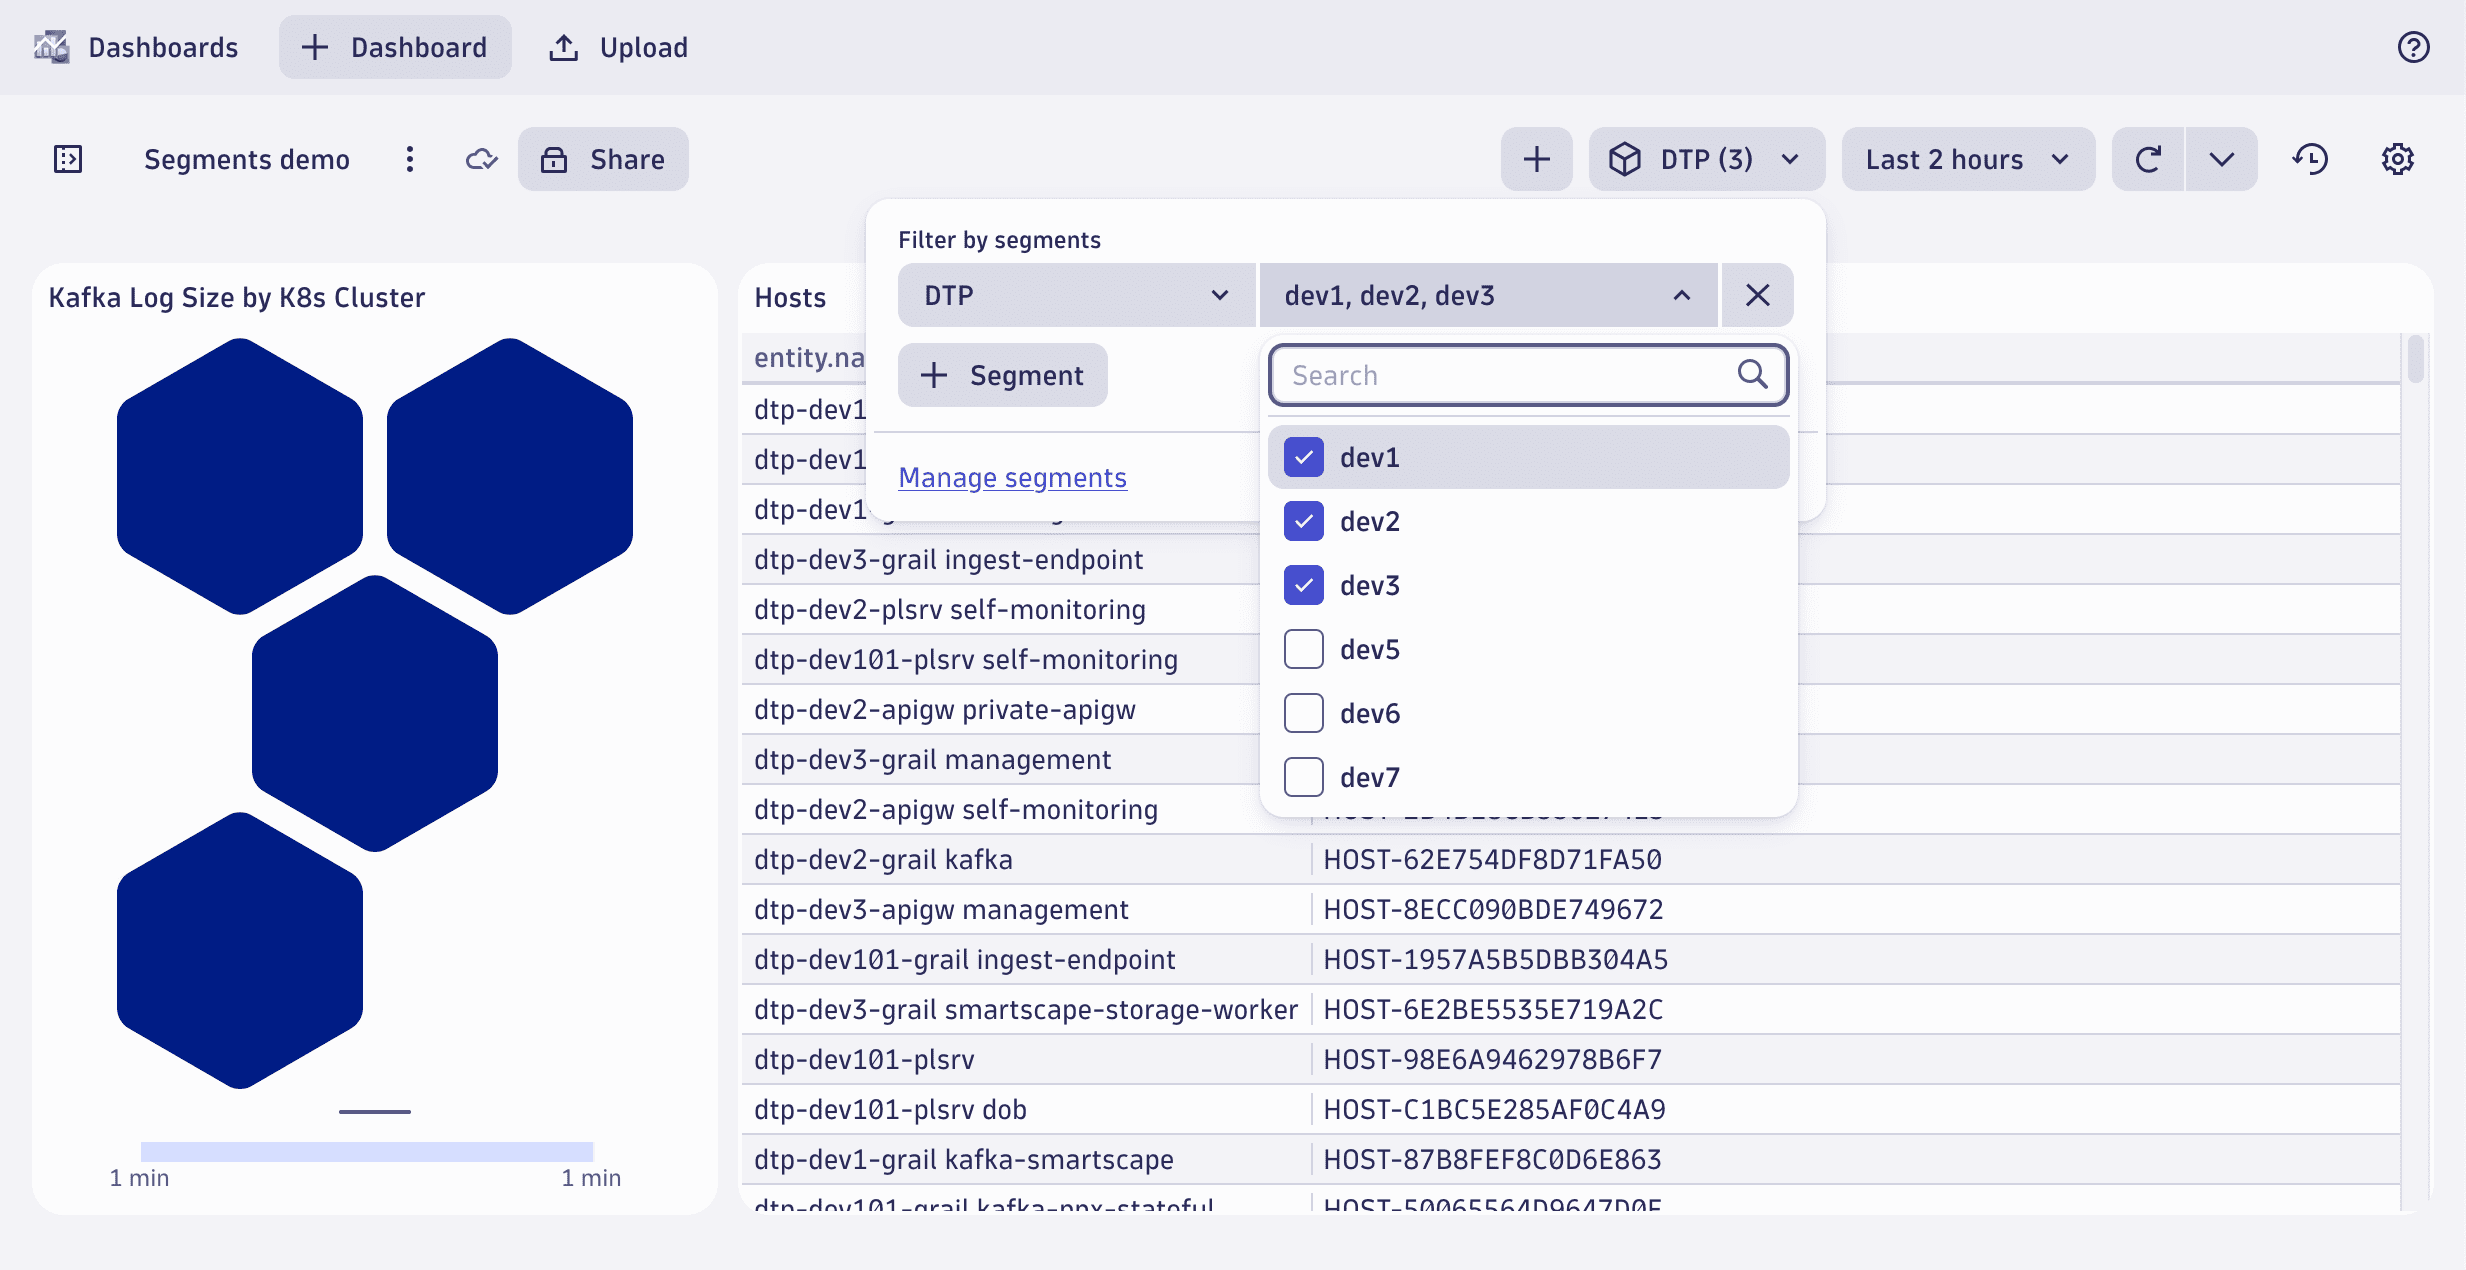
While one-off segments can be selected with a single click, more advanced segments will offer a secondary selection of a dimension value, like in this example, selecting from a dynamic list of individual deployments. This secondary selection of dynamic segment values also supports multi-select.

- Open the segment selector
- Open the list of values to change your selection
- Select multiple values to look at data matching either of those values
- Select Apply to apply the selection and filter data on the dashboard
If the selected segments or a combination with other aspects (like timeframe, filters, or permissions) lead to empty query results, the app won’t show any data for that selected context.
 Pin recent selections for quick access
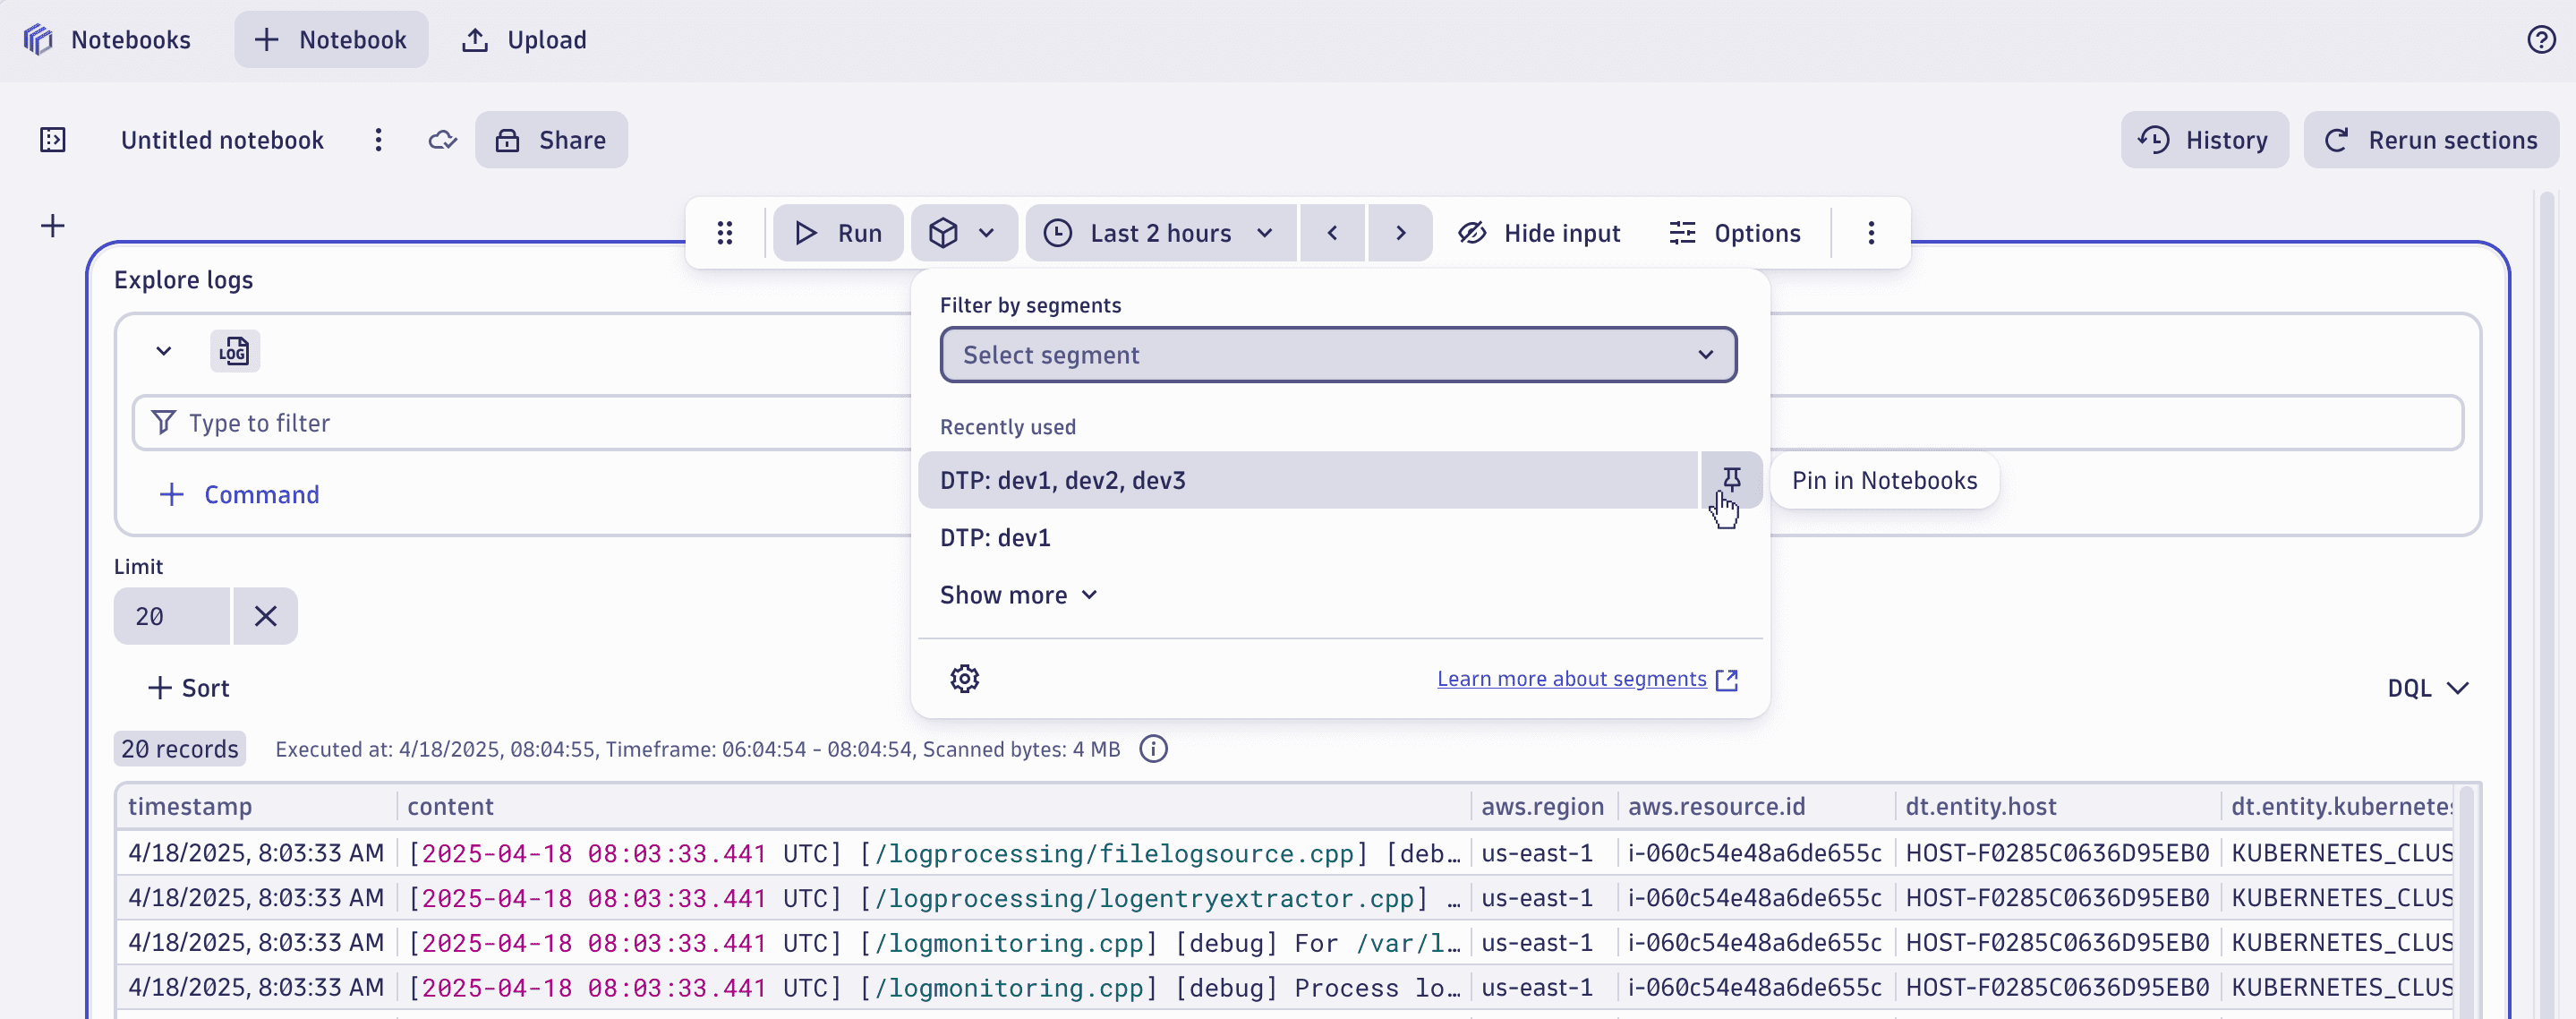
The segment selector shows the two most recent selections, and shows up to 10 if you select Show more. This lets you quickly apply recent selections without having to browse the full list of available segments.
- Go to
 Notebooks and select Notebook
 - Select Logs
- Open the segment selector and find recently used segments from previous steps
- Select Pin in Notebooks to pin a specific selection for quick access
- Select to apply the pinned entry

Pinned segment selections are unique per app to ensure full control, as most segments won't be universally applicable.
Conclusion
You've managed to filter data on a dashboard using segments and learned to quickly apply recent and pinned selections, increasing efficiency. Try to do the same in other apps to learn how apps choose to utilize segments for their specific use cases.
