Dynatrace SaaS release notes version 1.251
- Latest Dynatrace
- Release notes
- Published Sep 09, 2022
New features and enhancements
Kubernetes services
Infrastructure Monitoring | Kubernetes
- The Kubernetes services overview and details pages are now available in Dynatrace and accessible from other Kubernetes pages, such as the Kubernetes workload or pod details page.
- We've added a new Kubernetes services column to the Kubernetes namespace and cluster list page. The column shows the number of Kubernetes services in the namespace/cluster.
-
The Monitor workloads, pods, and namespaces setting on the Kubernetes settings page has been renamed to Monitor Kubernetes namespaces, services, workloads, and pods.
-
The permission for listing services is now mandatory instead of optional; missing permission results in an error message when you select Test connection in Kubernetes settings.
- You can now create rules for Kubernetes services as Monitored entity in management zones. However, note that existing management zones need to be updated to cover Kubernetes services.
Kubernetes dashboard presets
Infrastructure Monitoring | Kubernetes
-
The following dashboard presets were reworked and improved:
- Kubernetes cluster overview
- Kubernetes workload overview
- Kubernetes namespace resource quotas
- Tiles in Kubernetes dashboard presets have been updated to Data Explorer tiles.
Service detection settings
Cross solutions | Settings
We've improved and unified our existing service detection settings. With this improvement:
-
To access web request and web service detection settings, go to Settings > Service detection.
-
You can use the corresponding schemas to manage configuration via the Settings API, and also in security policies.
-
Merged service monitoring settings are deprecated. You can still edit and delete your existing configurations. To carry out the equivalent task of creating a merged service via the new settings, see Merged services.
Distributed traces global list
Apps & Microservices | Distributed traces
The Distributed traces page highlights the most important node for the trace depending on the timeframe. It is now either the server-side entry point, the root node of the trace, or the node with the earliest start time.
Data Explorer now has templates
Cross solutions | Data Explorer and dashboards
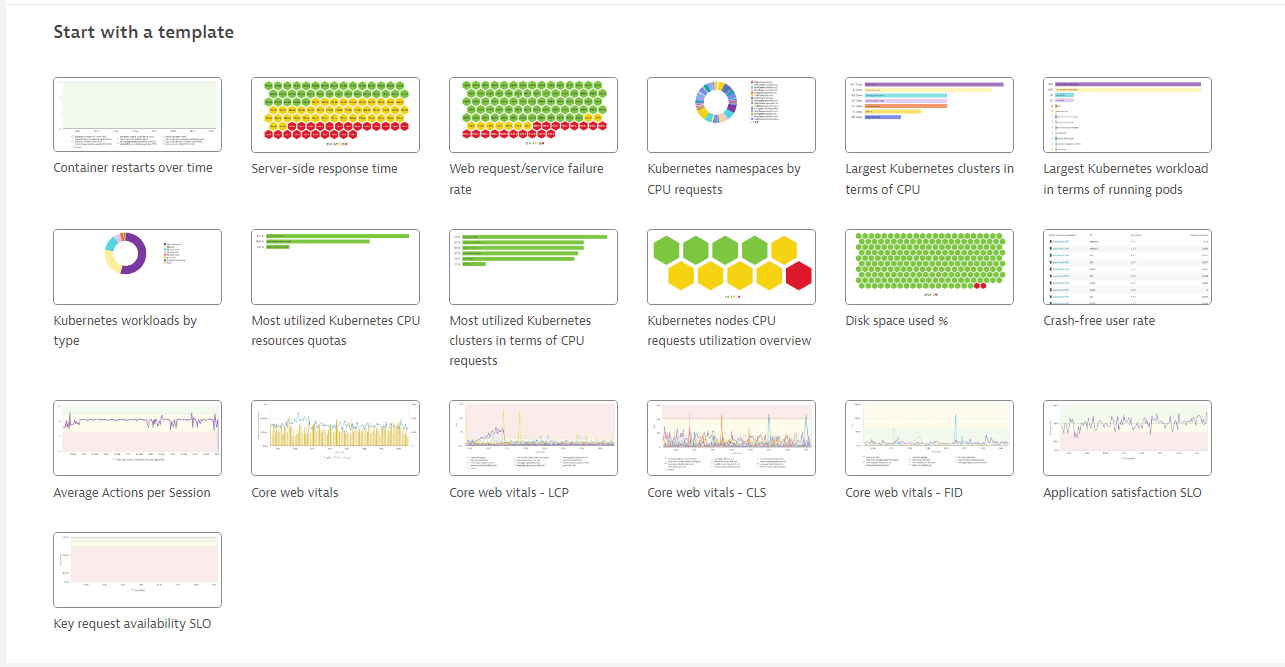
Data Explorer now opens with a Start with a template section that offers various query templates. When you select a template, Dynatrace automatically fills in the query definition, configures the visualization settings, and runs the query. This is the fastest way to get up and running with Data Explorer.
For more information, see Data Explorer quick start.

Show data retention on Distributed traces and Multidimensional analysis charts
Apps & Microservices | Distributed traces
You can now enable Show data retention to segment chart data according to data retention periods on the following pages:
Dynatrace API
To learn about changes to the Dynatrace API in this release, see Dynatrace API changelog version 1.251.
Resolved issues
General Availability (Build 1.251.129)
The 1.251 GA release contains 14 resolved issues.
| Component | Resolved issues |
|---|---|
| ActiveGate | 2 |
| Cluster | 10 |
| User interface | 1 |
| angular components | 1 |
ActiveGate
- Fixed an issue with ActiveGate installer incorrectly adding proxyOff to http.client.internal section. (APM-387045)
- OOM kills are now also processed if there is a significant time difference between the Kubernetes cluster and the Dynatrace cluster. (K8S-3418)
Cluster
- * If several code editor components exist on a page, lint errors won't be shared, but every instance will have its own. * The "Run query" is no longer enabled if another code editor component exists. (APM-385306)
- Fixed an issue with the generic root cause engine feature where unrelated problems got merged. (APM-385700)
- Session and useraction properties can now be captured for query string parameters containing a colon. (RUM-7306)
- Fixed an issue in which the REPLACE_PATTERN function was called multiple times within a single batch of log events, and the pattern contained LineData (LD/LDATA) matcher. (APM-385929)
- Sorting the pods column in the Kubernetes workloads page now works properly. (K8S-3315)
- Show correct suggestions for generic entity types in dashboard filters. (APM-386232)
- With Kubernetes 1.25 the beta apis cronjobs endpoint, which was previously used by the Kubernetes API monitoring on ActiveGate was removed. https://kubernetes.io/docs/reference/using-api/deprecation-guide/#cronjob-v125. (K8S-3414)
- * Charts now available in full width * No data truncation, panning added (drag left or right to see all data) * Fixing/centering loading for Log viewer and Logs and Events. (APM-385558)
- * Changed title to "Logs and Events" to its respective page * Visualization button group disabled on log records loading * Fixed loading centering without text-align: center (causing code editor to center text). (APM-385515)
- Removed code-mirror error logging as it was creating duplicated bugs unrelated with code-mirror. (APM-387225)
User interface
- Removed duplicate "Packets" metric from "Host performance" charts on the new Windows host page. (APM-386499)
angular components
- Now all table rows are exported when using "export table data". (TI-3155)