Clouds app
- Latest Dynatrace
- App
- 4-min read
The new cloud experience is optimized for Cloud (Platform) Operation teams and Site Reliability Engineers (SREs) and focuses on health, troubleshooting, and performance optimization use cases of (multi-)cloud environments.
The centerpiece of this experience is  Clouds.
- Onboard your cloud accounts and start to analyze your full cloud inventory within minutes.
- Analyze metrics, events, logs, traces, metadata and topology from virtual machines, serverless functions, databases, queues, storage, networking, and many more—in one view.
- Use health alerts to ensure optimal health and performance. Reduce troubleshooting and remediation time with AI-powered alerting.
- Leverage your (existing) cloud tags to route notifications, define ownership, or allocate costs.
- Take advantage of ready-made dashboards to save time and get instant insights.
The underlying observability data is all powered by Grail, which supports flexible analytics through the Dynatrace Query Language in  Notebooks,
  Dashboards, and
  Workflows.
Prerequisites
Clouds is automatically installed as a core app managed by Dynatrace.
Connections
- Dynatrace SaaS environment powered by Grail and AppEngine hosted in any AWS region or an eligible Azure region
- DPS license is required with the following capabilities:
See concepts for the comparison between classic and new cloud connections.
Permissions
The following table describes the required permissions.
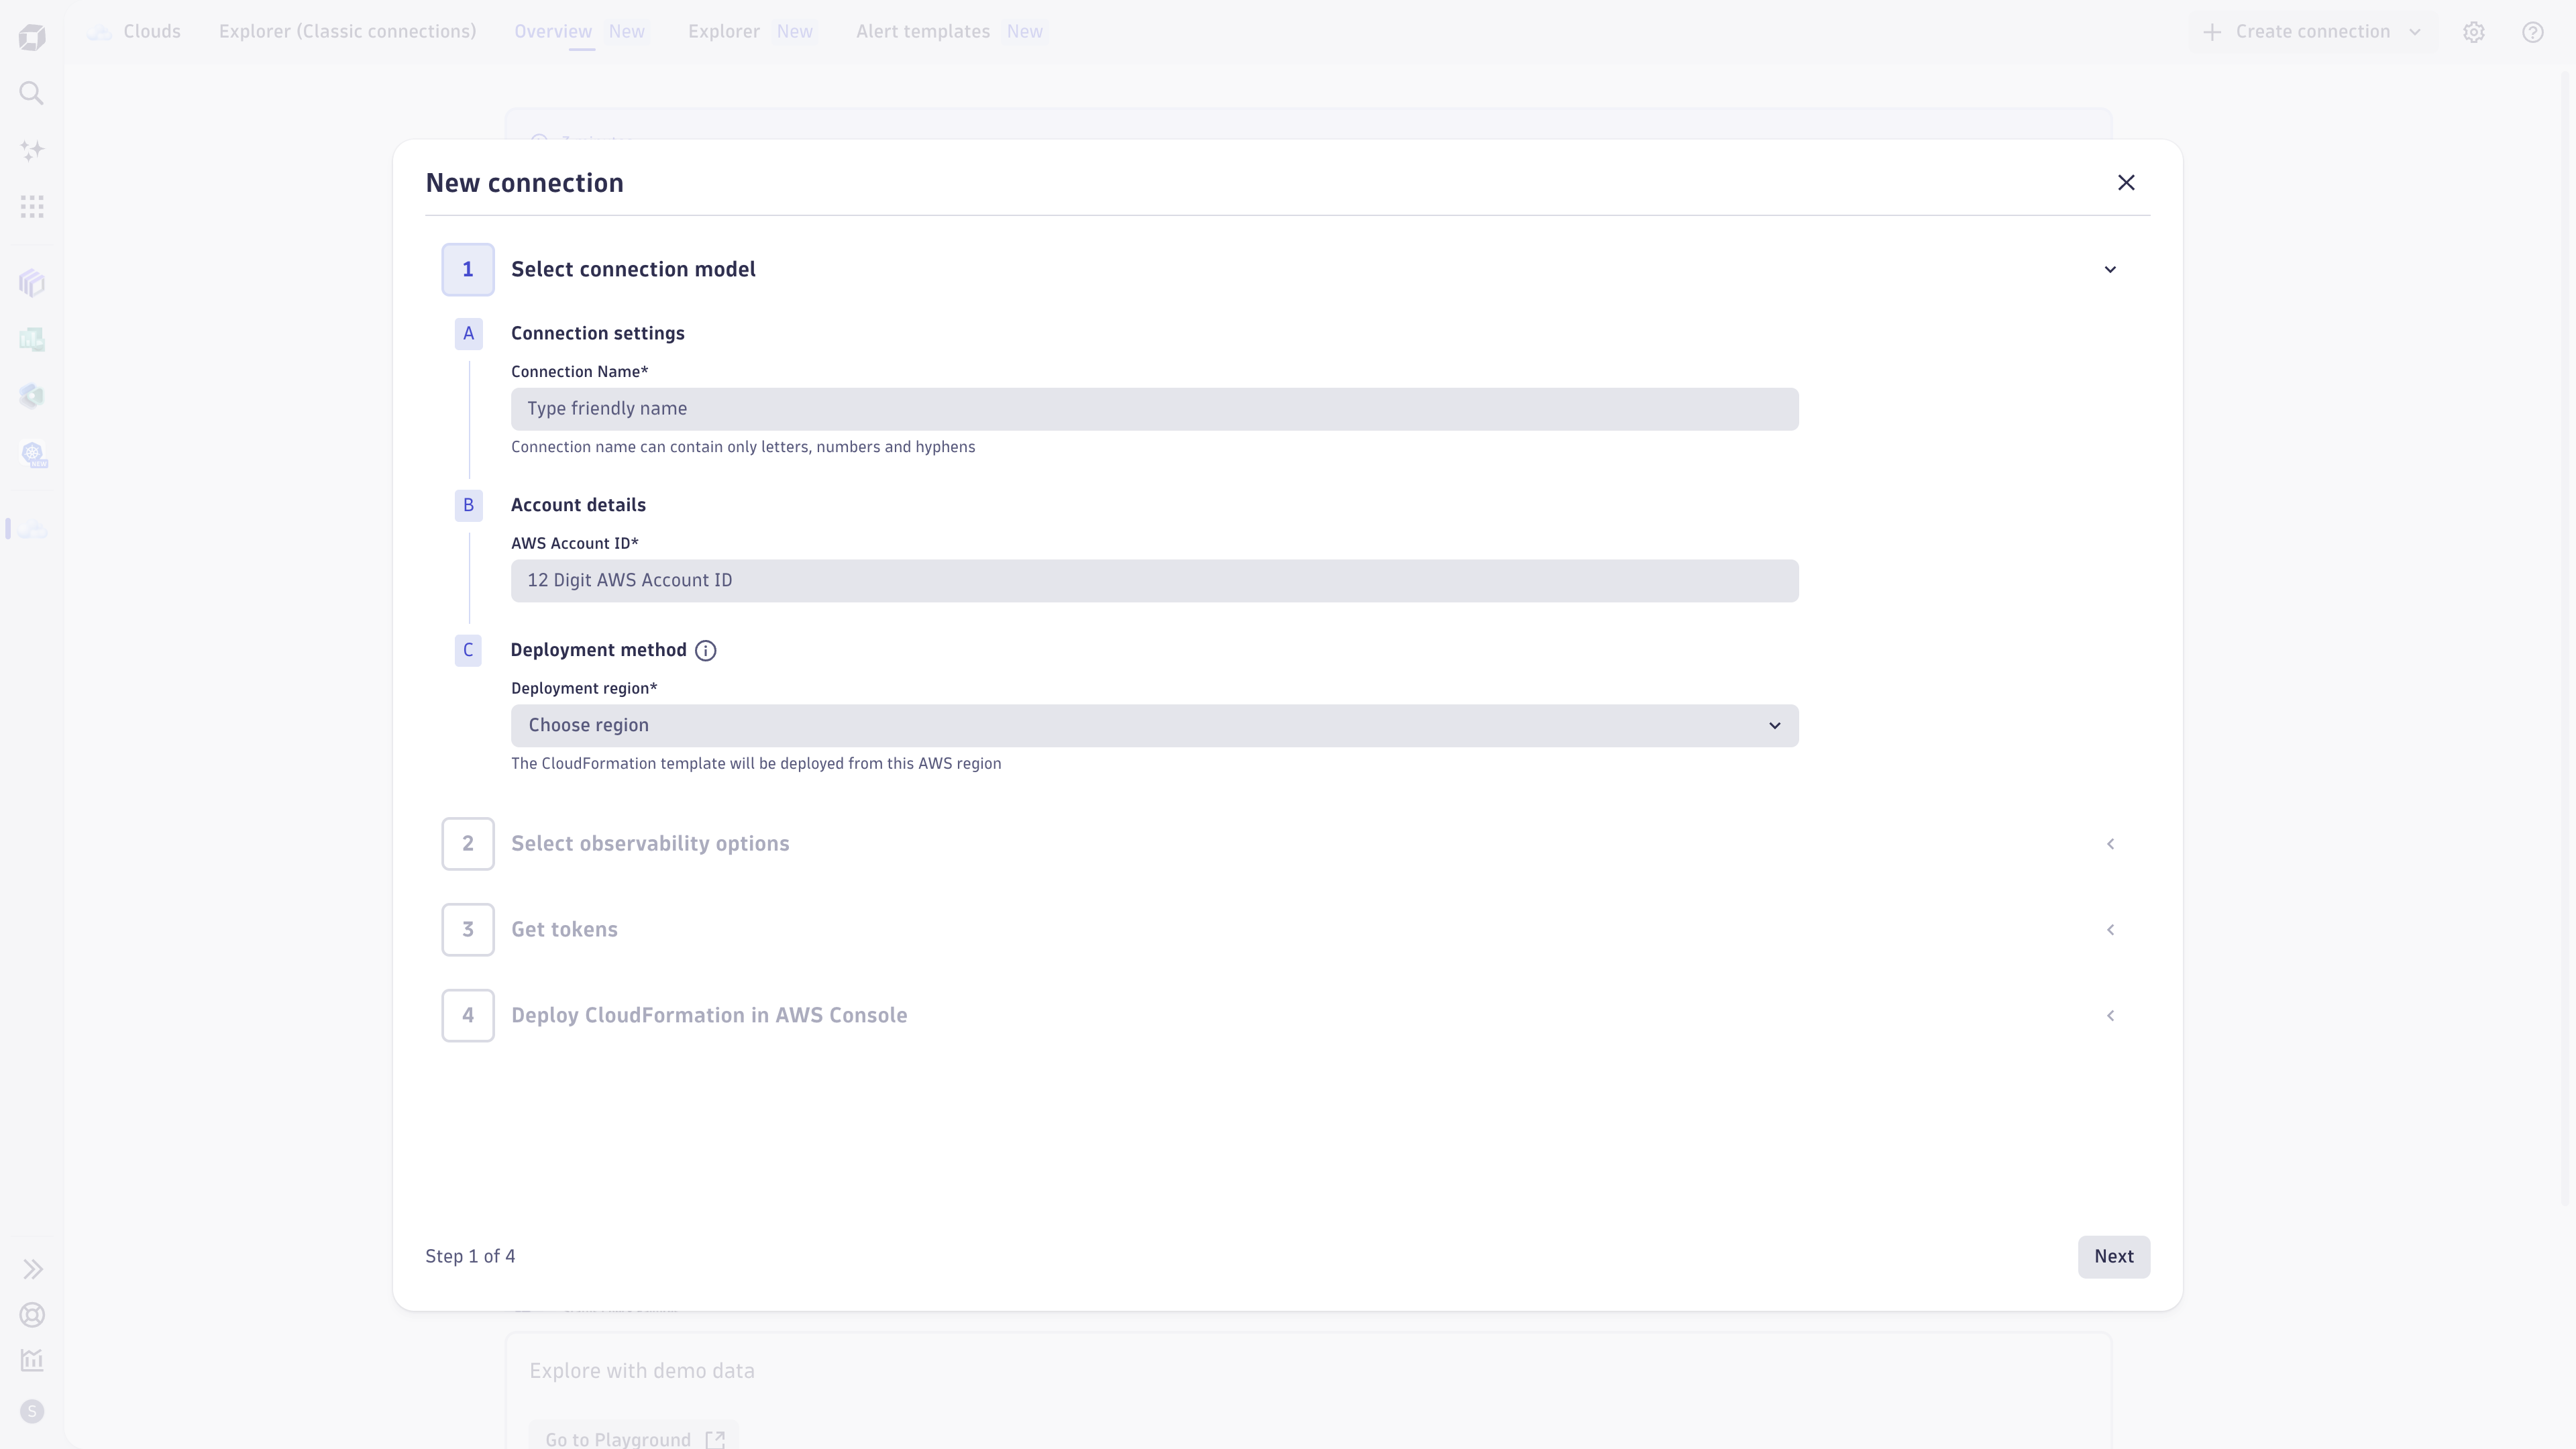
Get started
Clouds has an integrated onboarding flow that guides you through all the required steps to get started. The exact steps you need to take depend on your cloud provider and the type of cloud connection (new or classic).
If you're new to Dynatrace AWS Cloud Platform Monitoring, we recommend starting with the new AWS connections instead of the classic ones.
Use the following guide to set up and configure a new cloud connection in Dynatrace.
Overview (New connections)
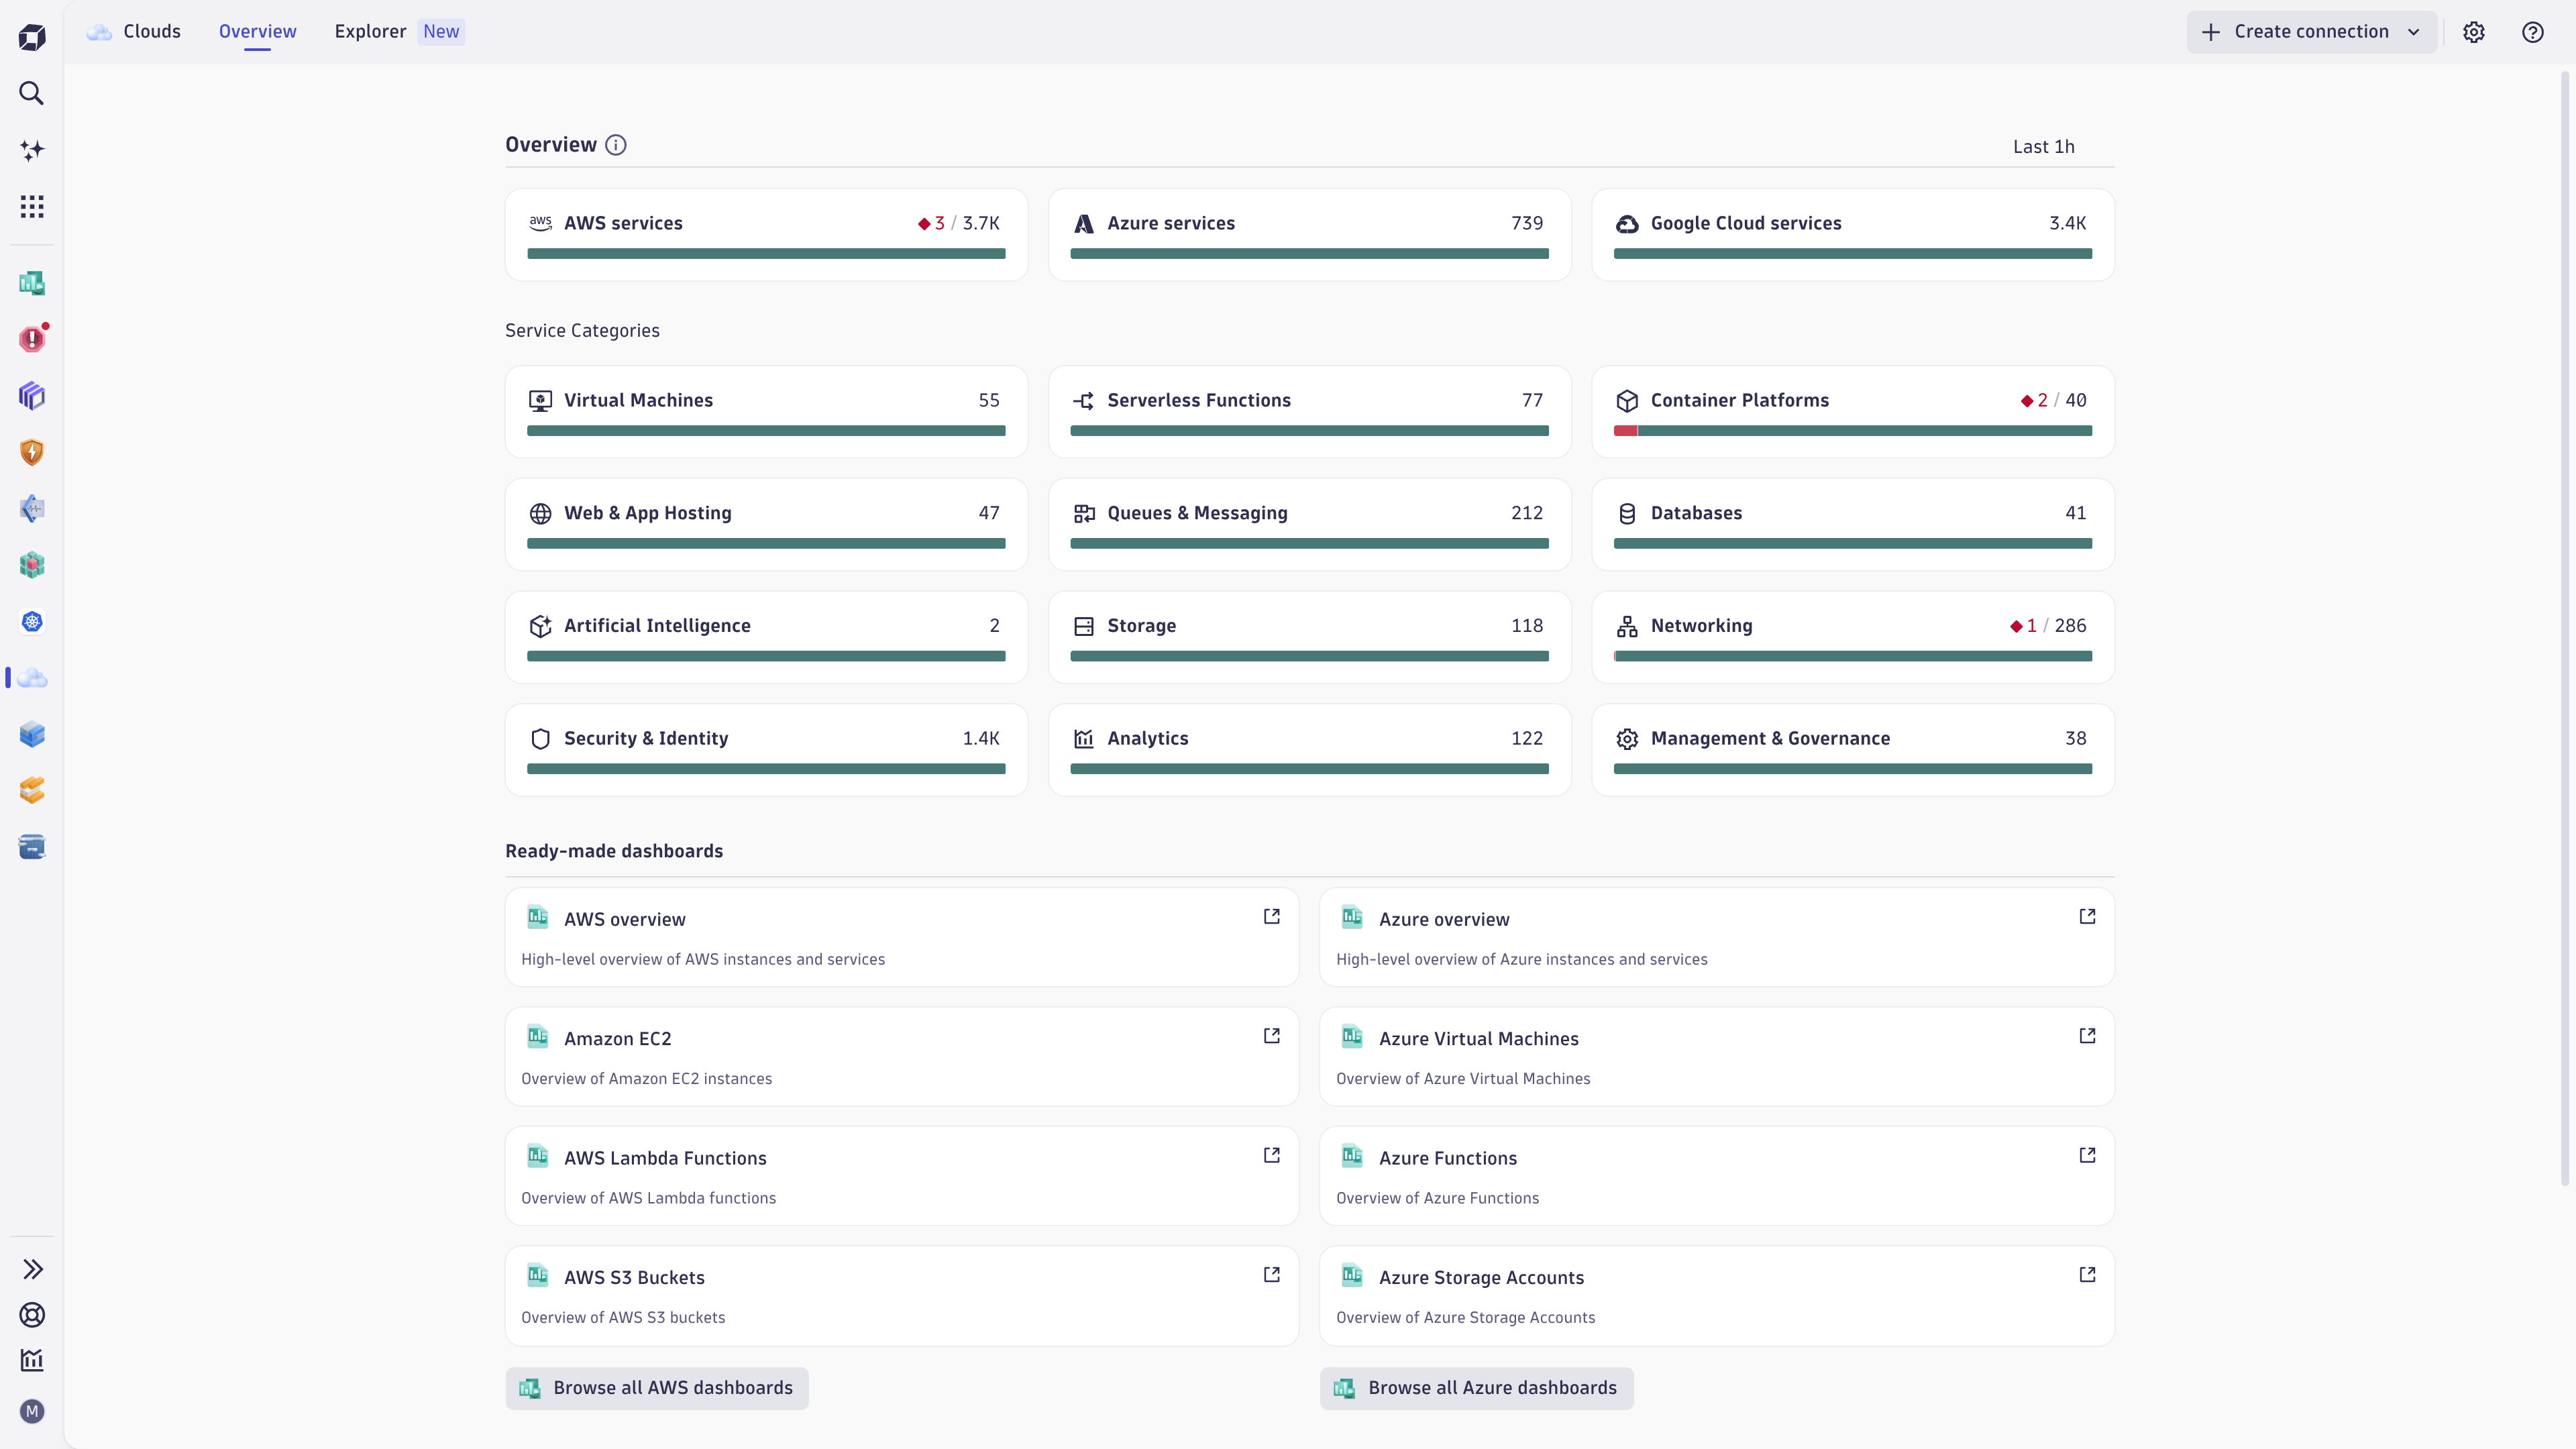
The Overview New tab is the landing page, where you can start discovering Clouds, get data into Dynatrace, and see a summary of the health state of your AWS and/or Azure services based on new cloud connections at a glance. On that page, you can:
-
Select the AWS services or Azure services tile, choose a specific service category, or select the counter in the upper-right corner of the tile to access the Explorer New tab with a list of selected services.
-
Review the health state of cloud services, depending on your alert setup. To list the unhealthy services in Explorer New, select the red counter (if any) in the upper-right corner of the tile.
-
Open ready-made dashboards for the most popular services (for example, AWS Lambda) or select Browse all dashboards to list all ready-made dashboards for AWS and/or Azure.
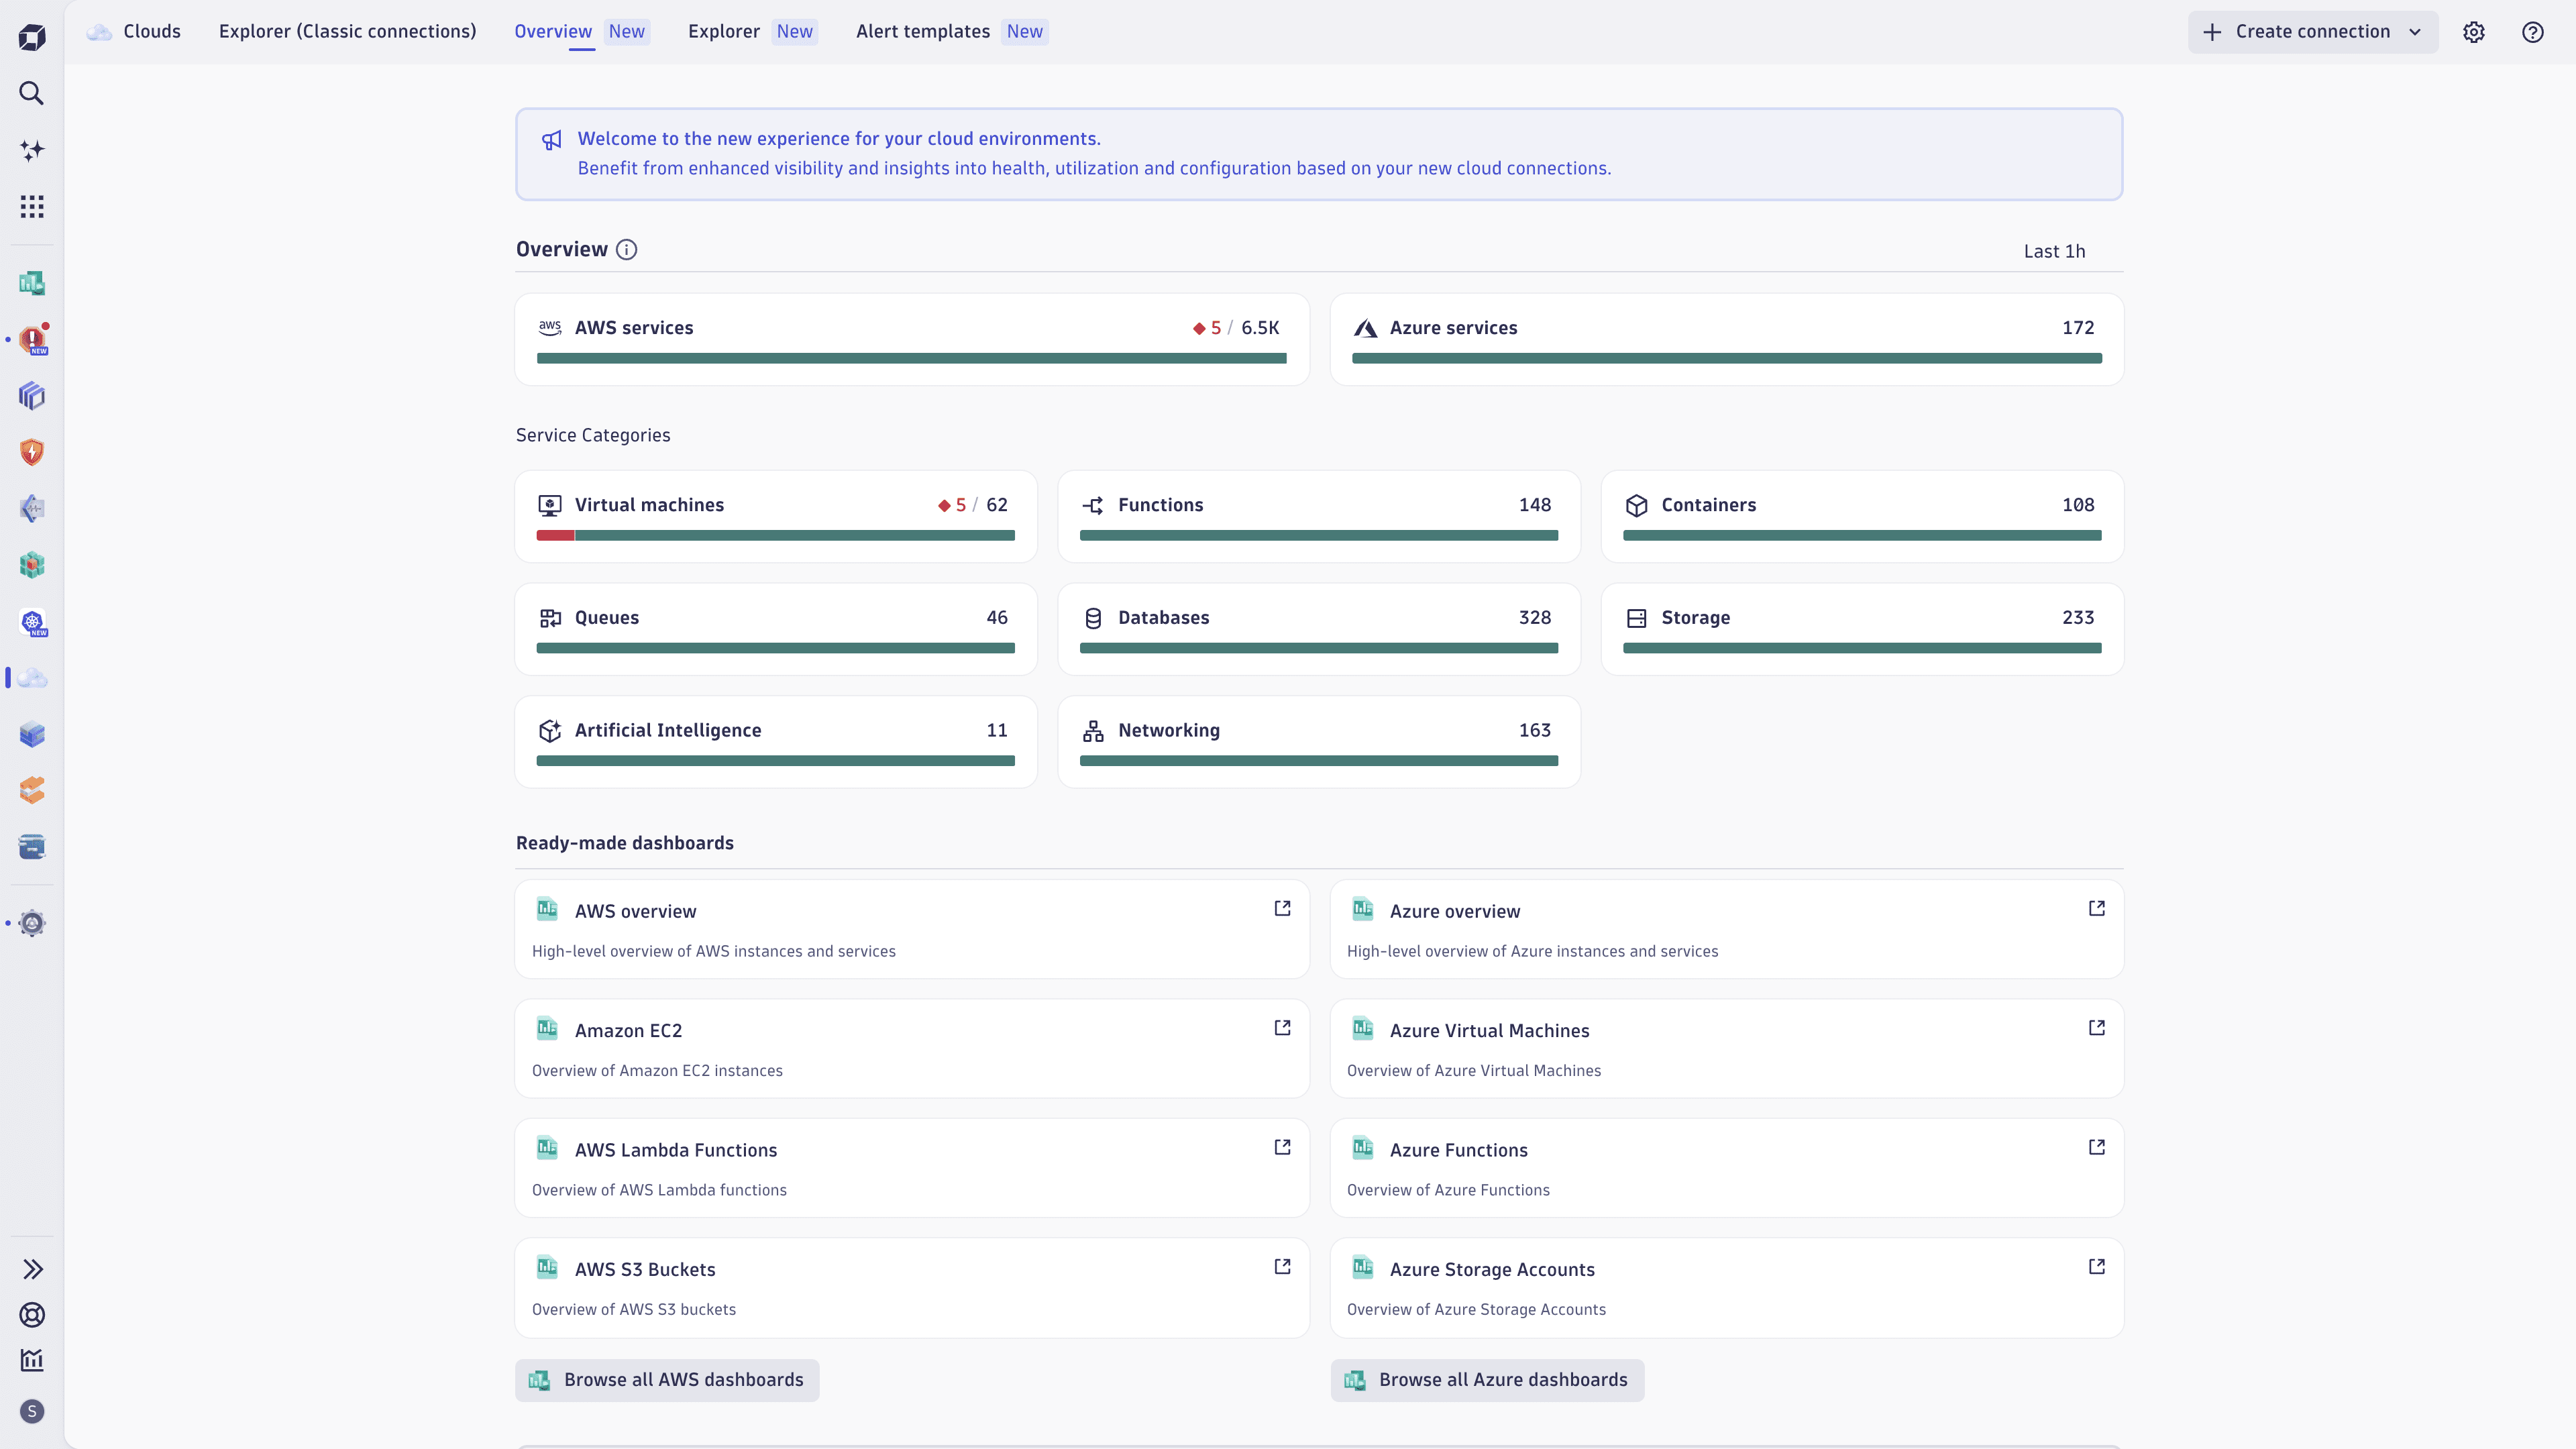 Clouds app | Overview
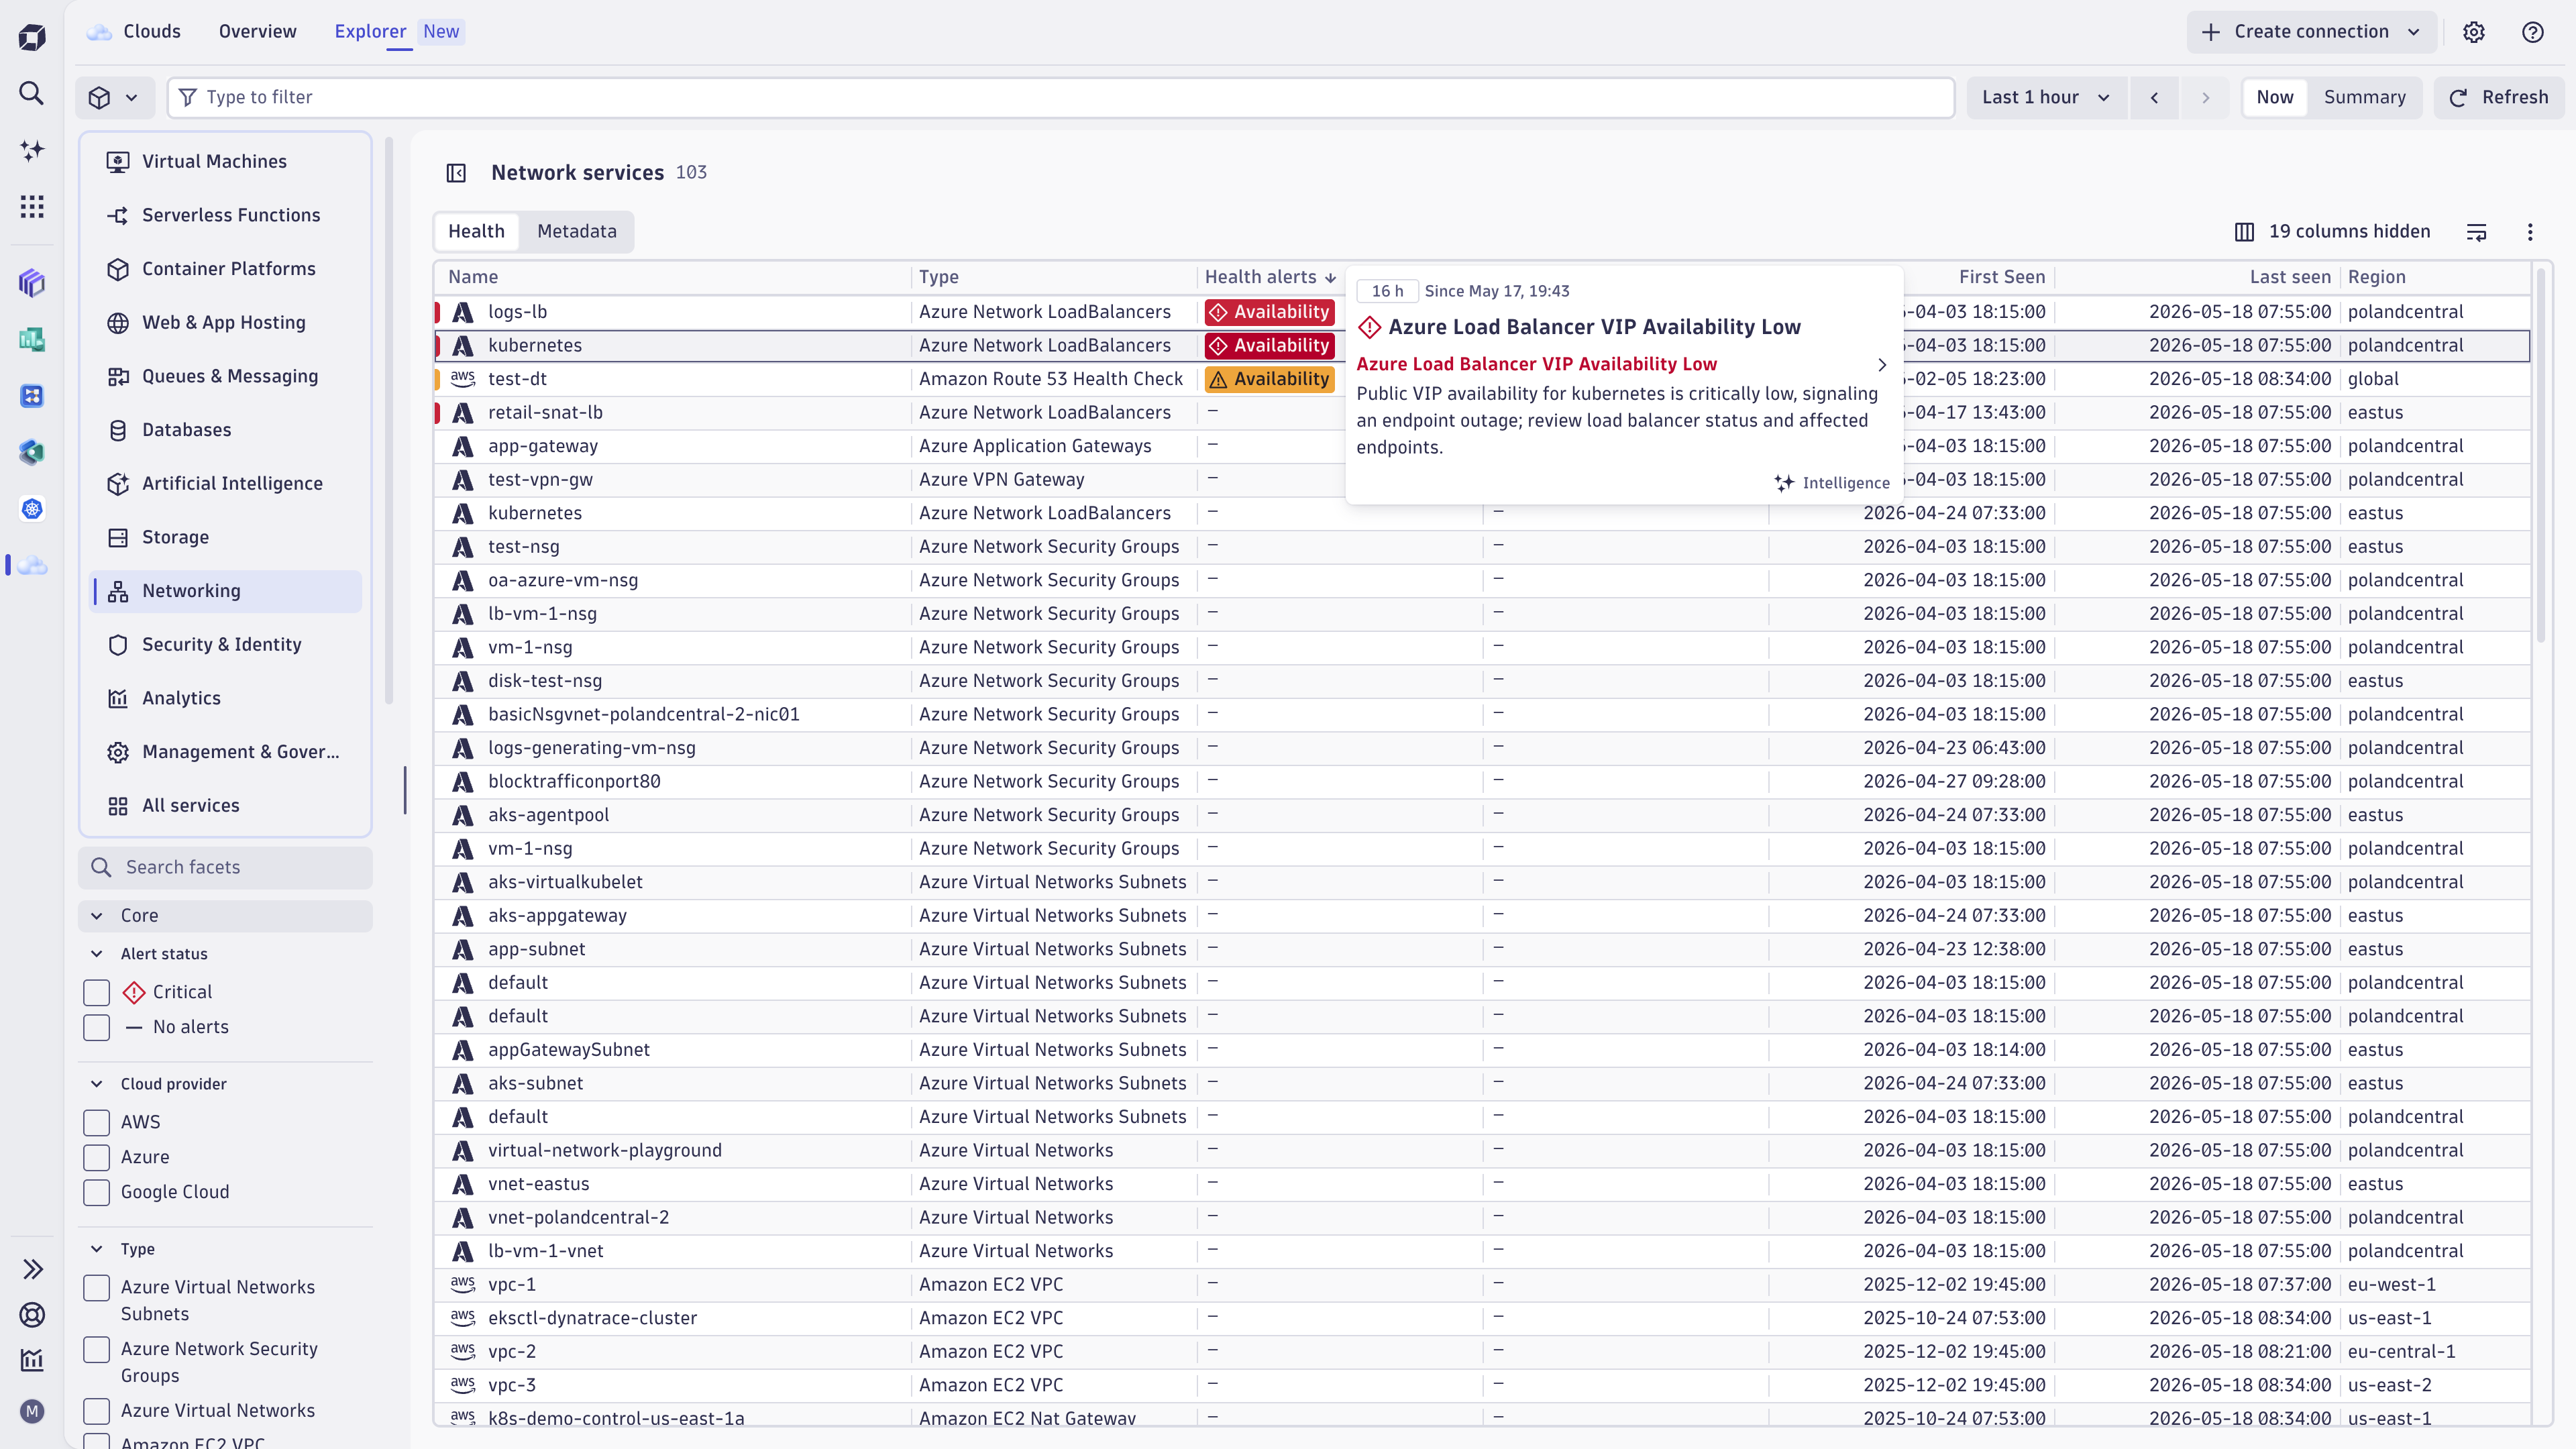
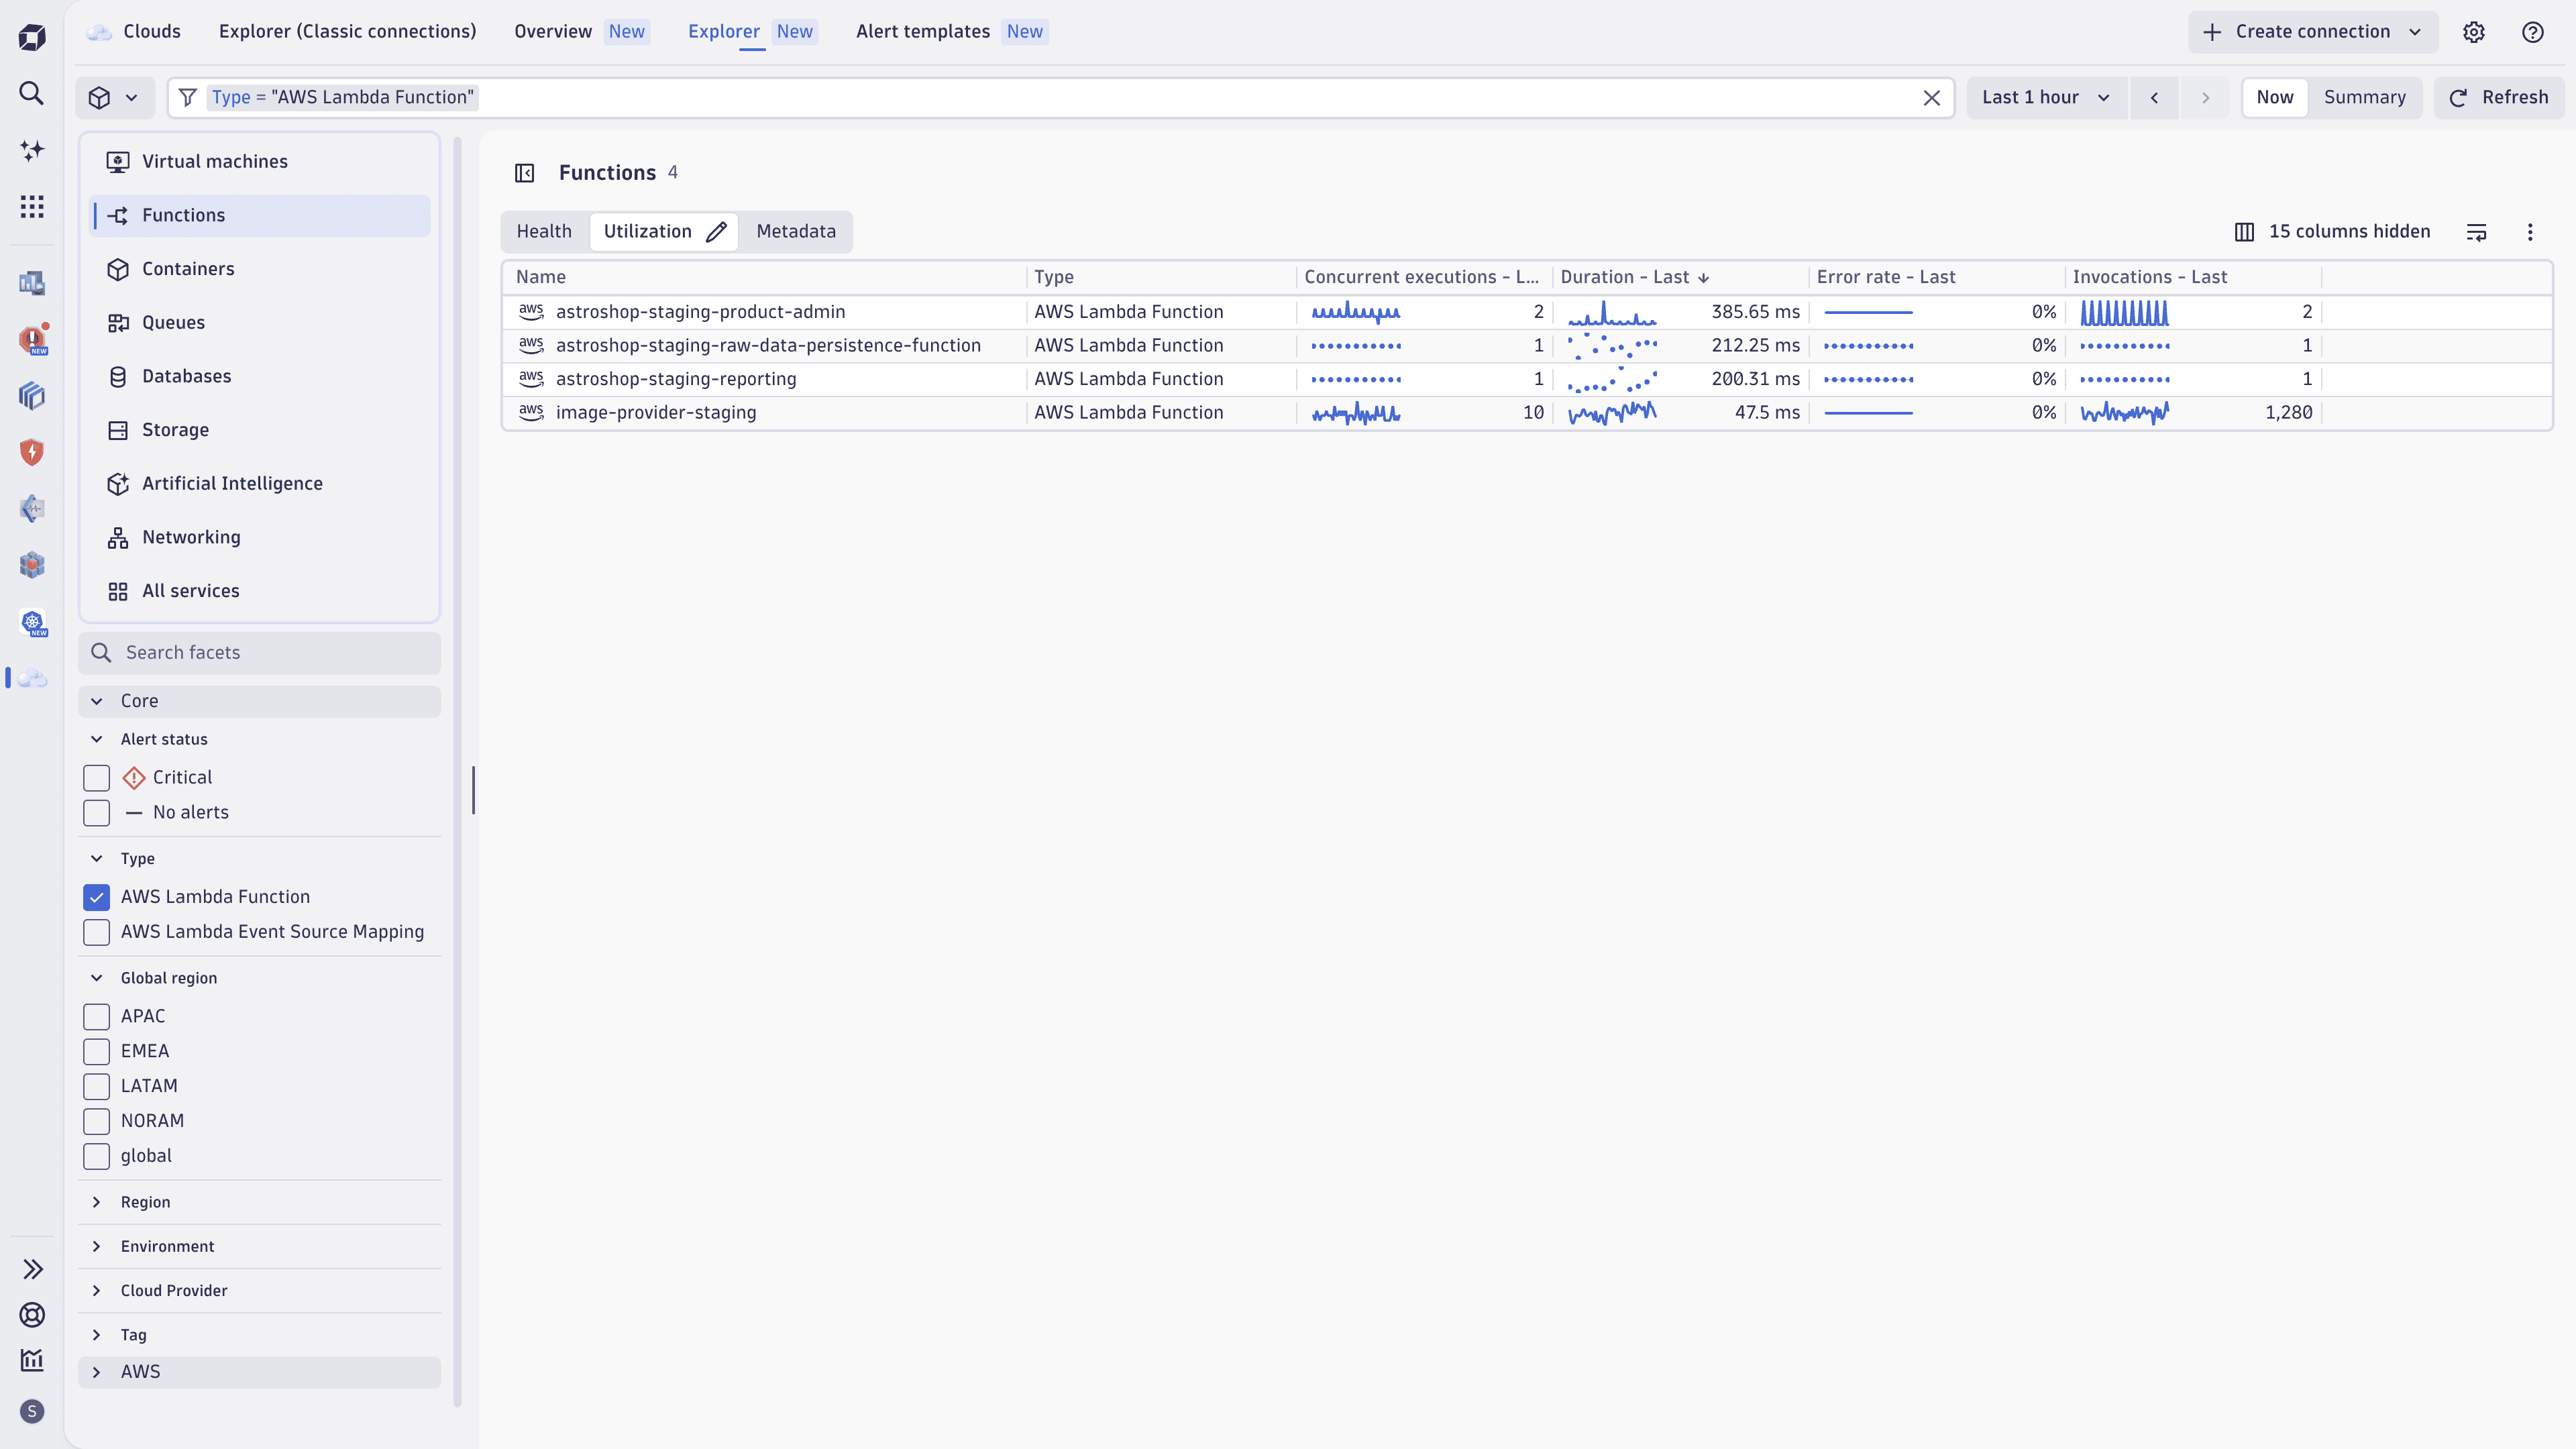
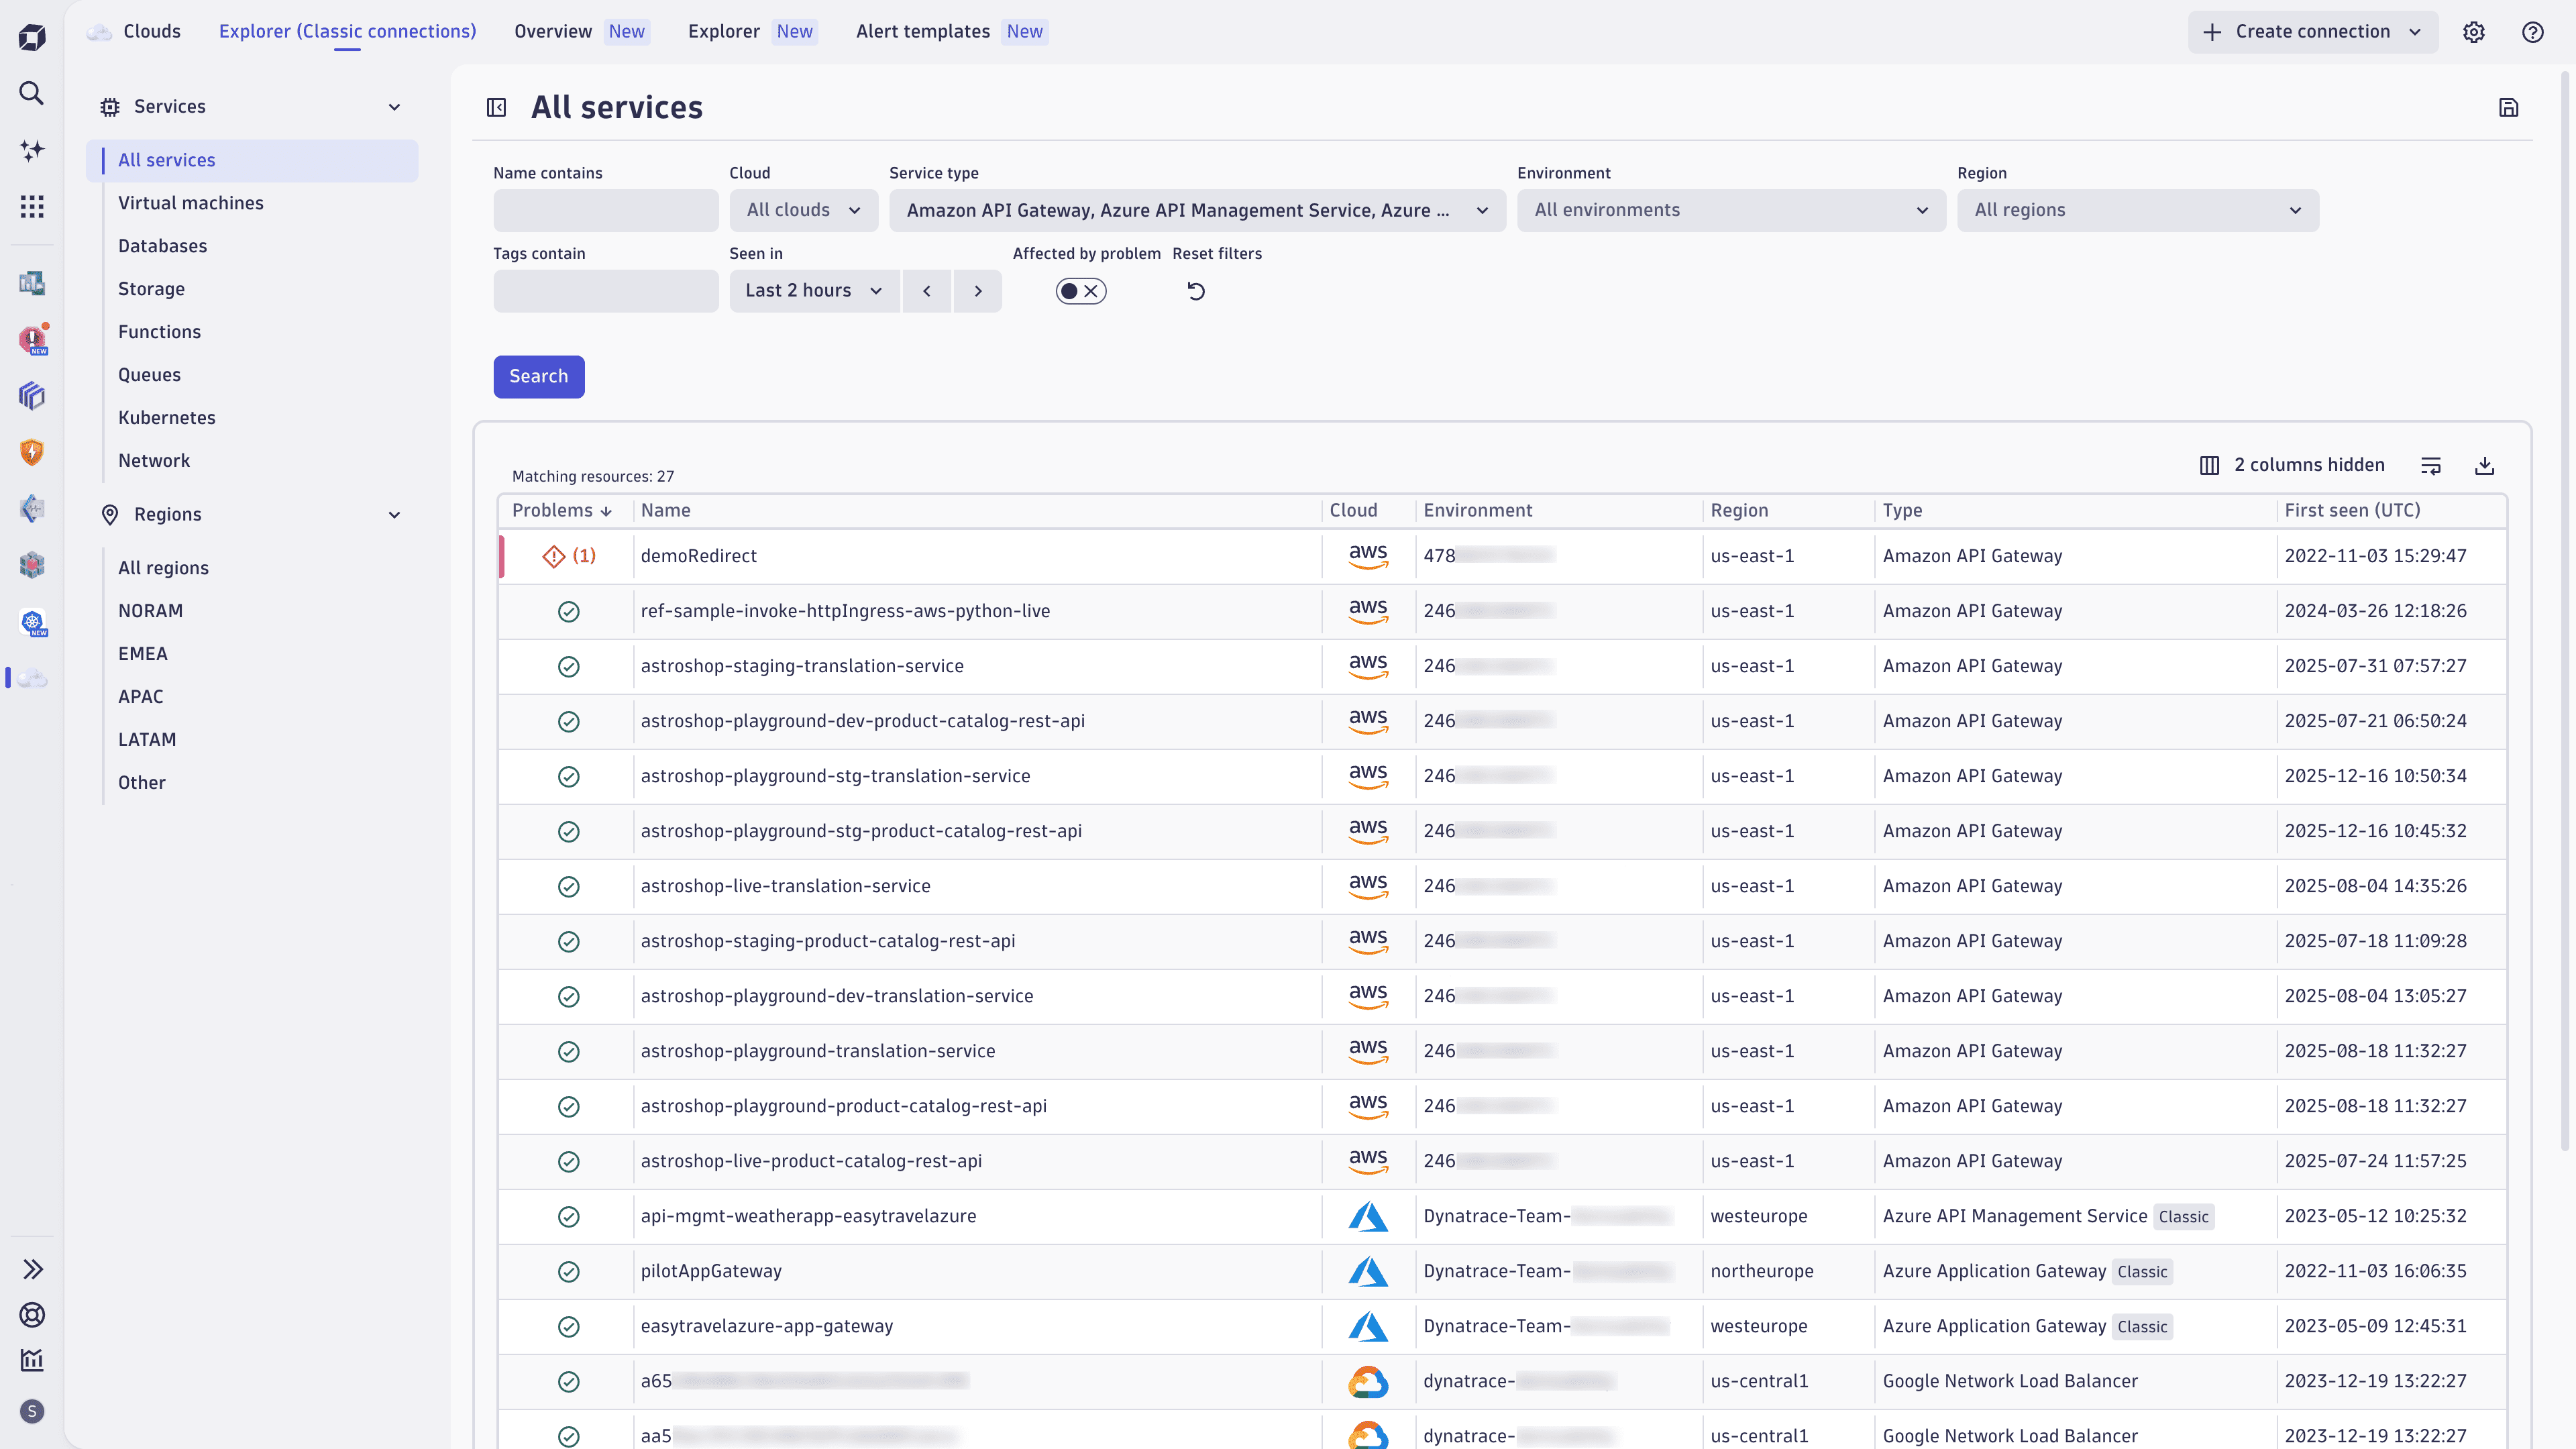
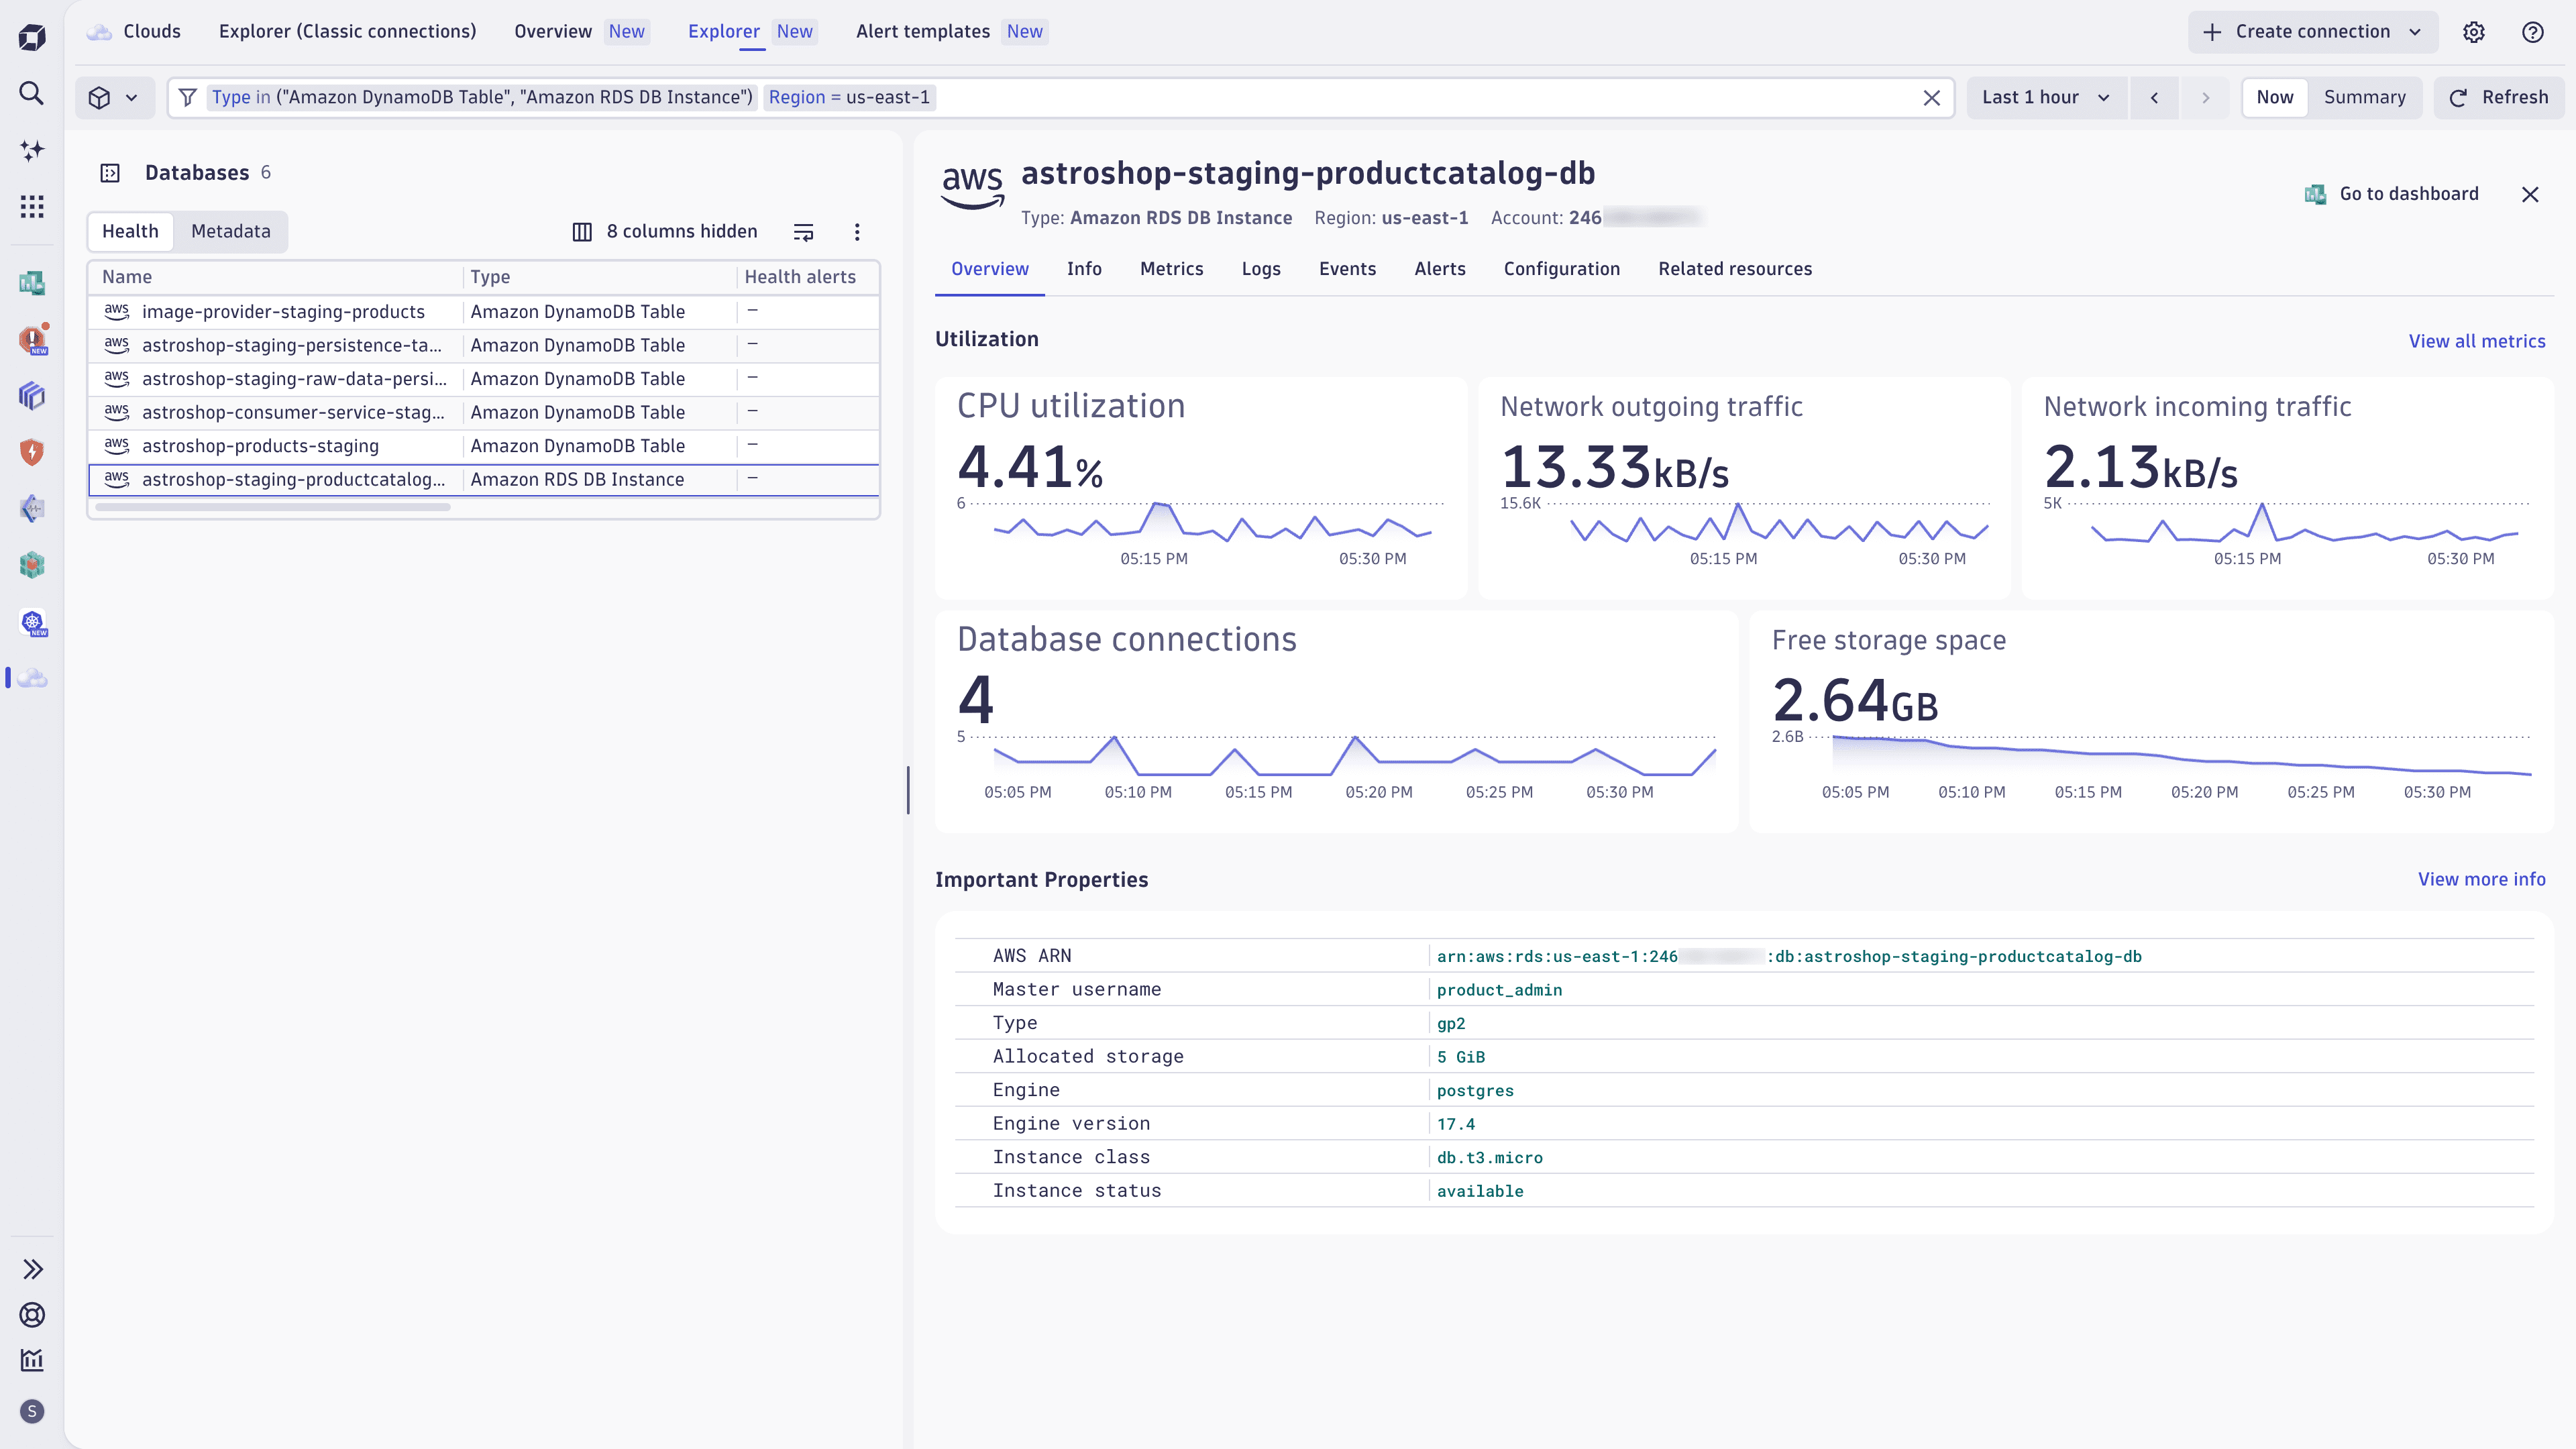
Explorer (New connections)
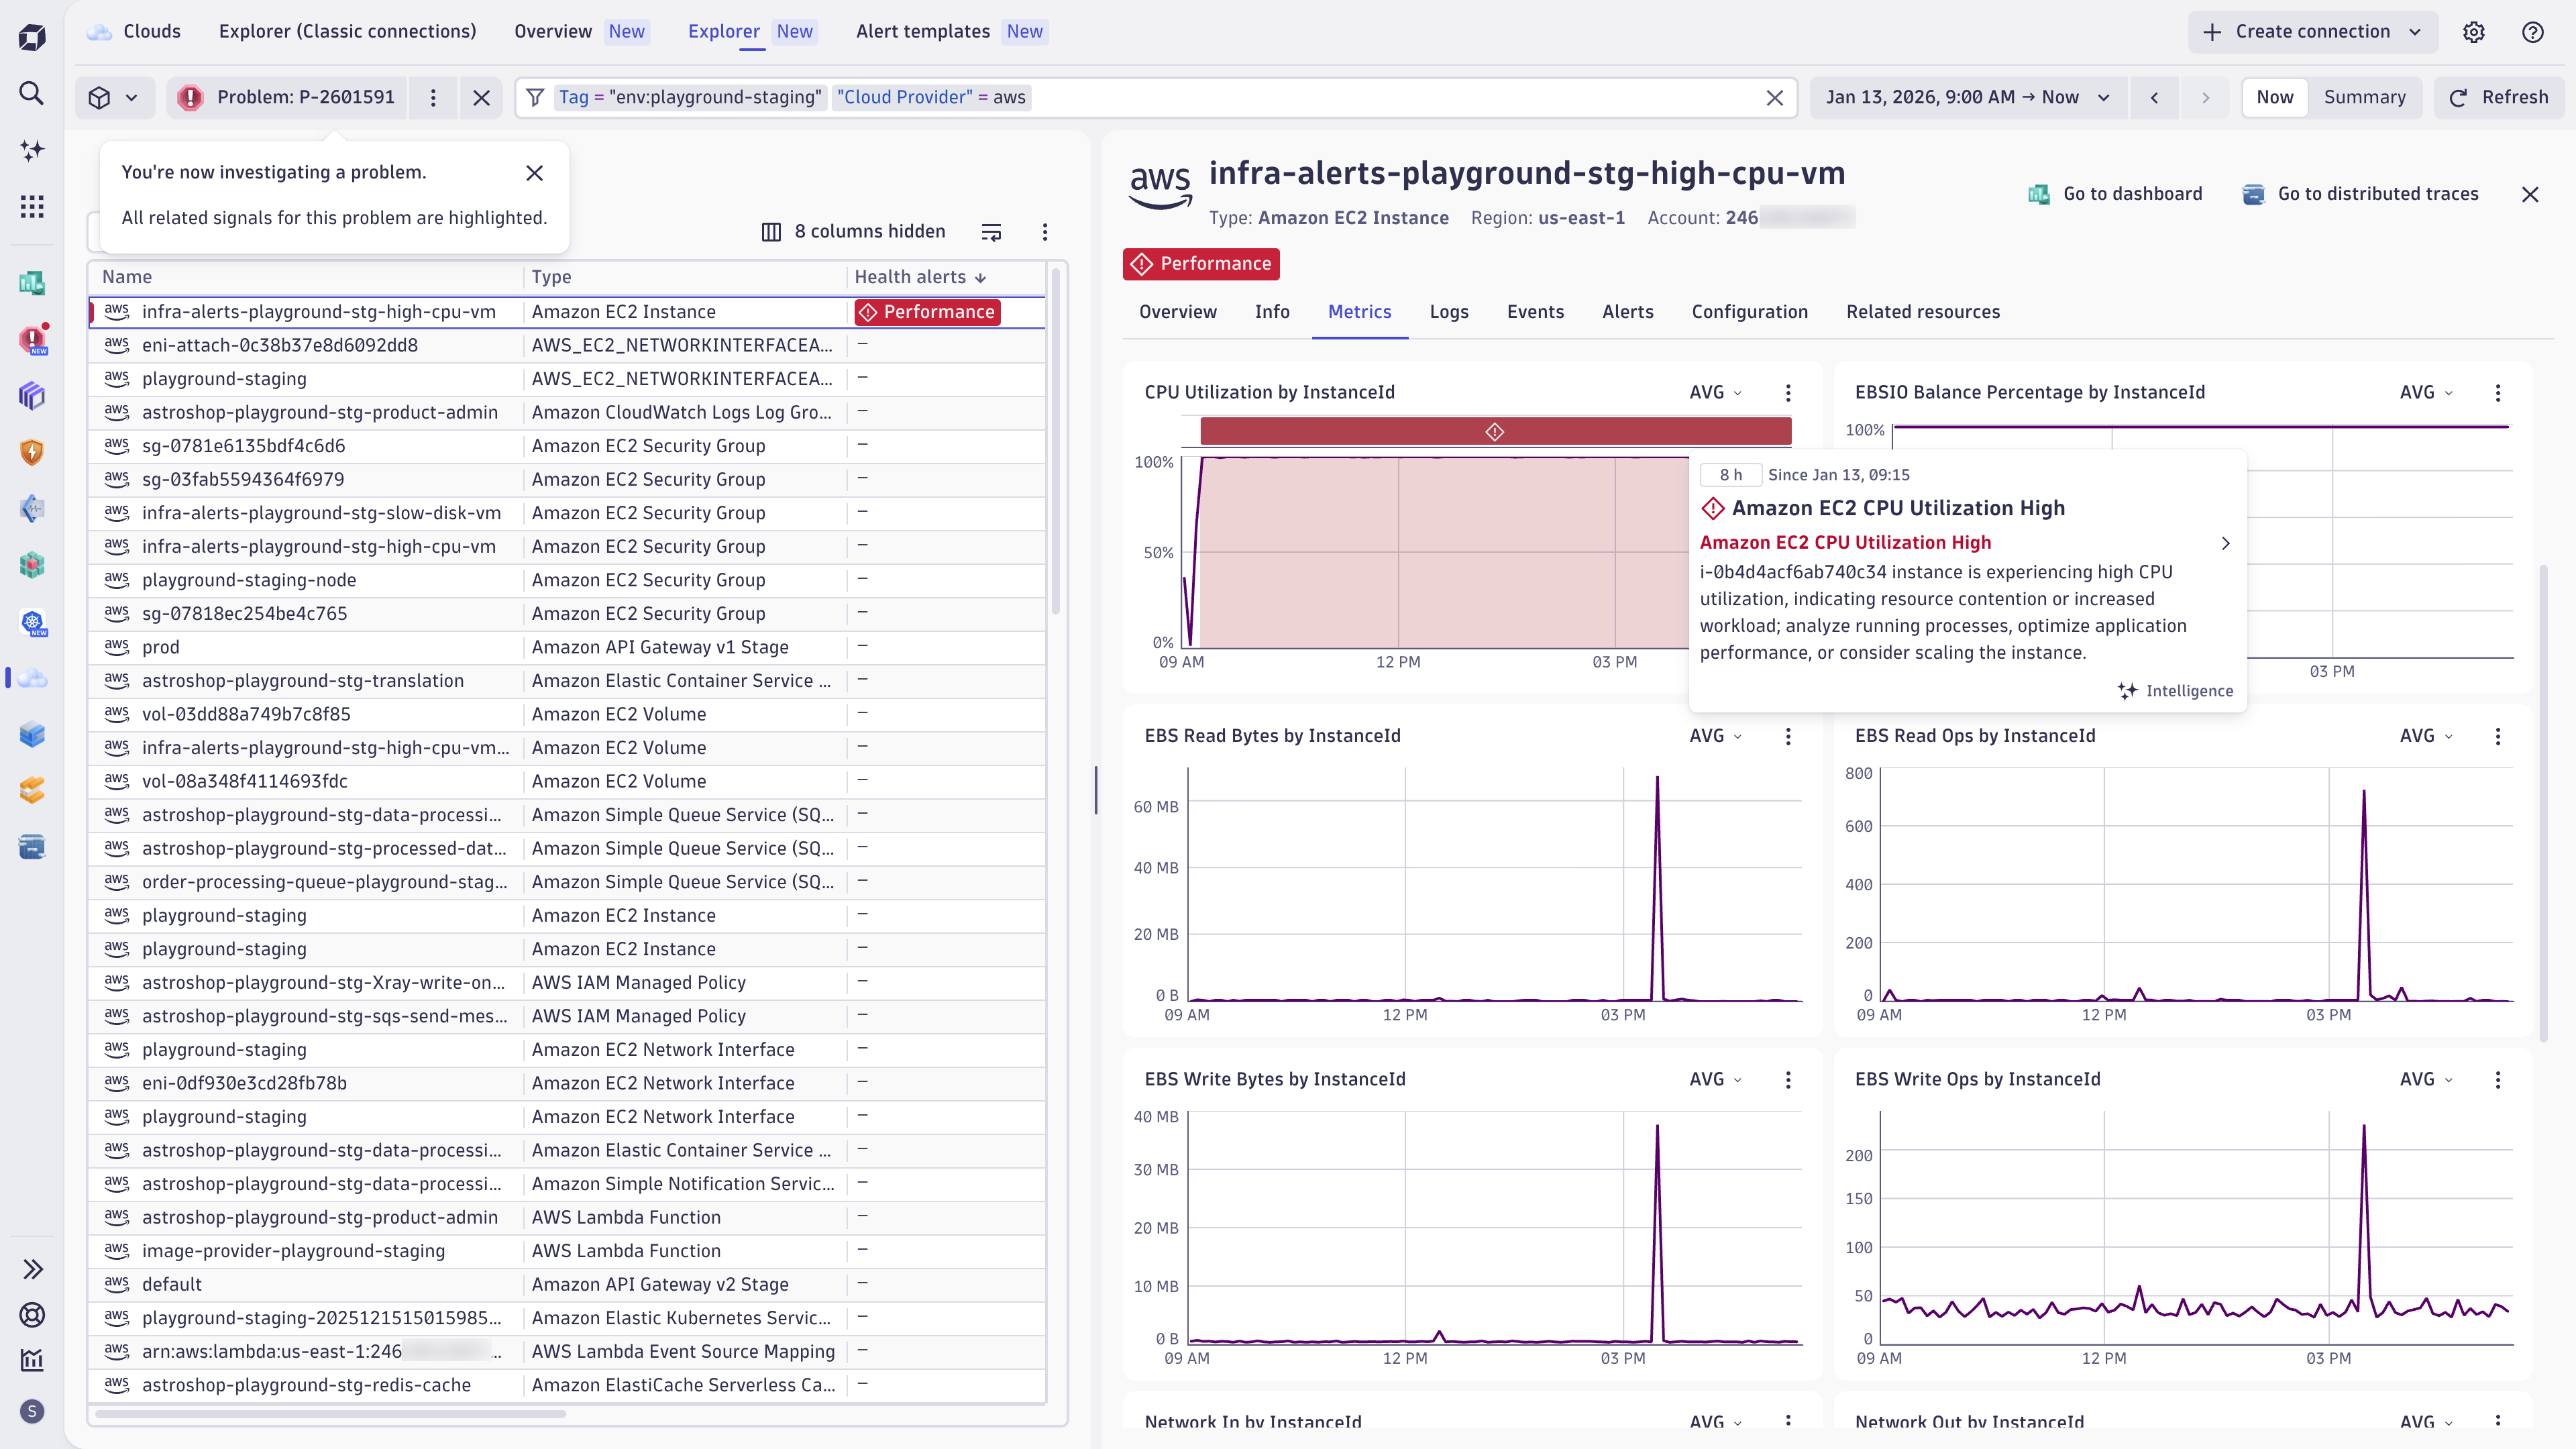
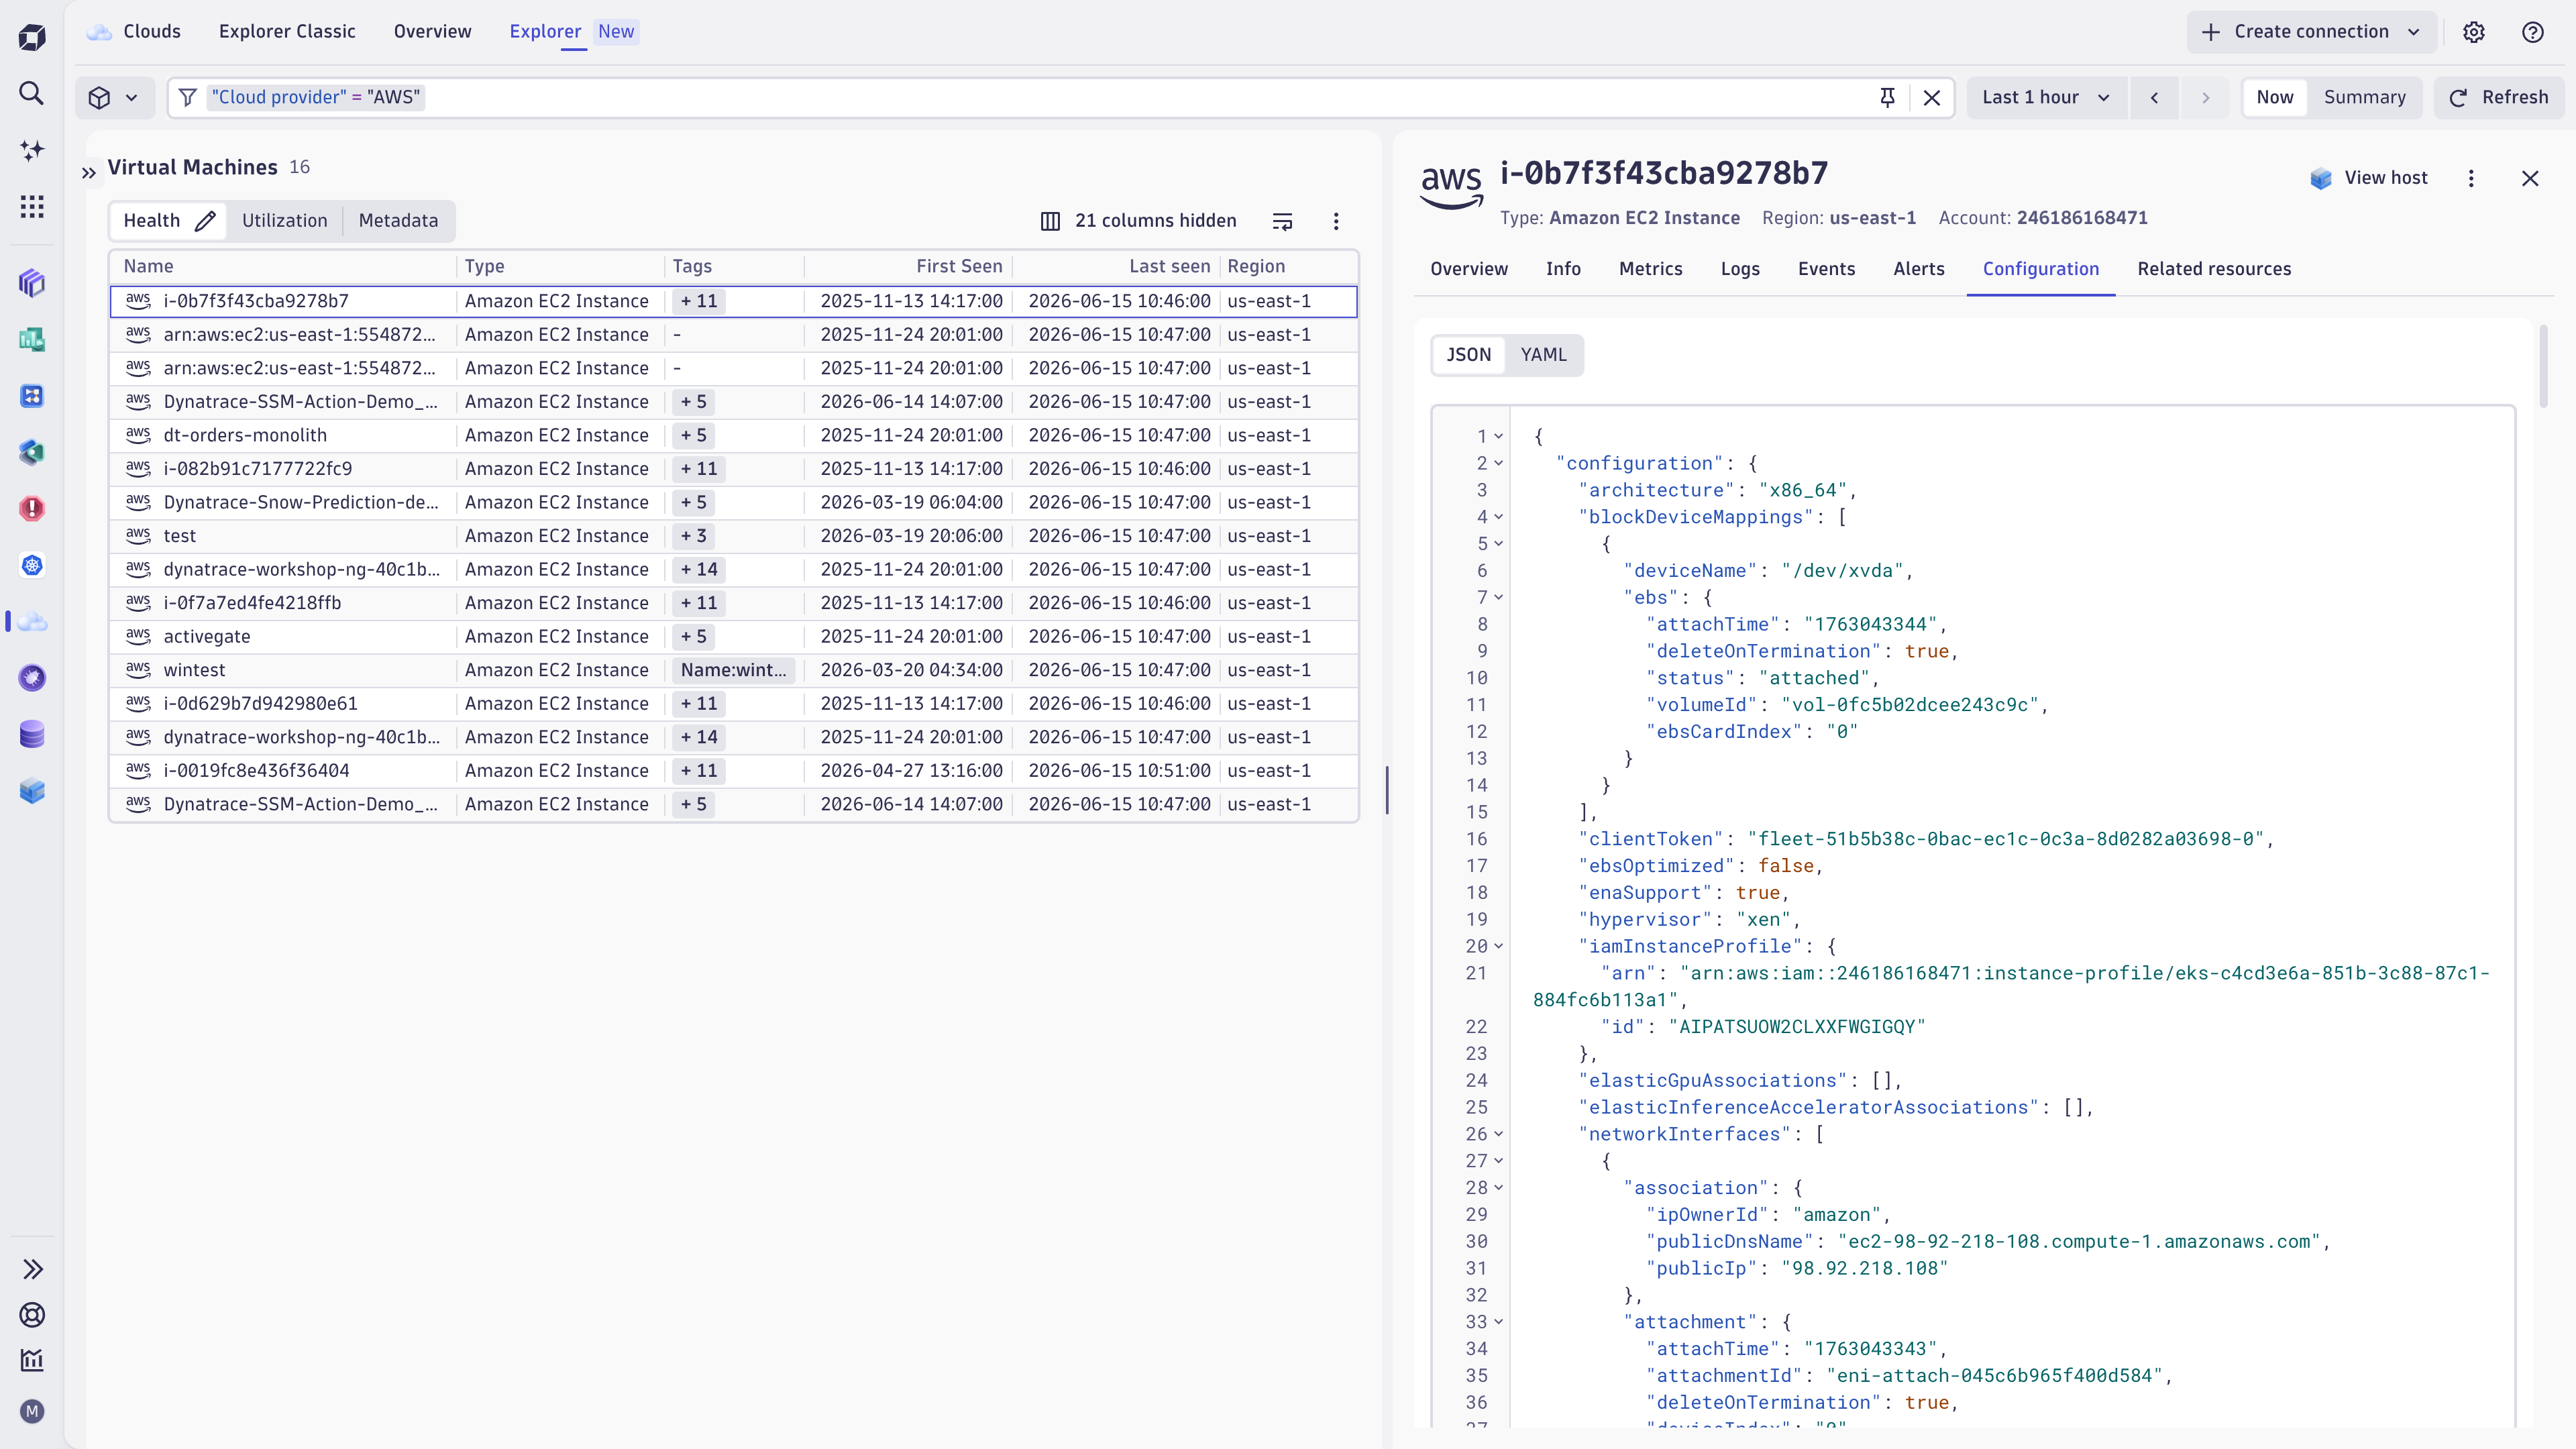
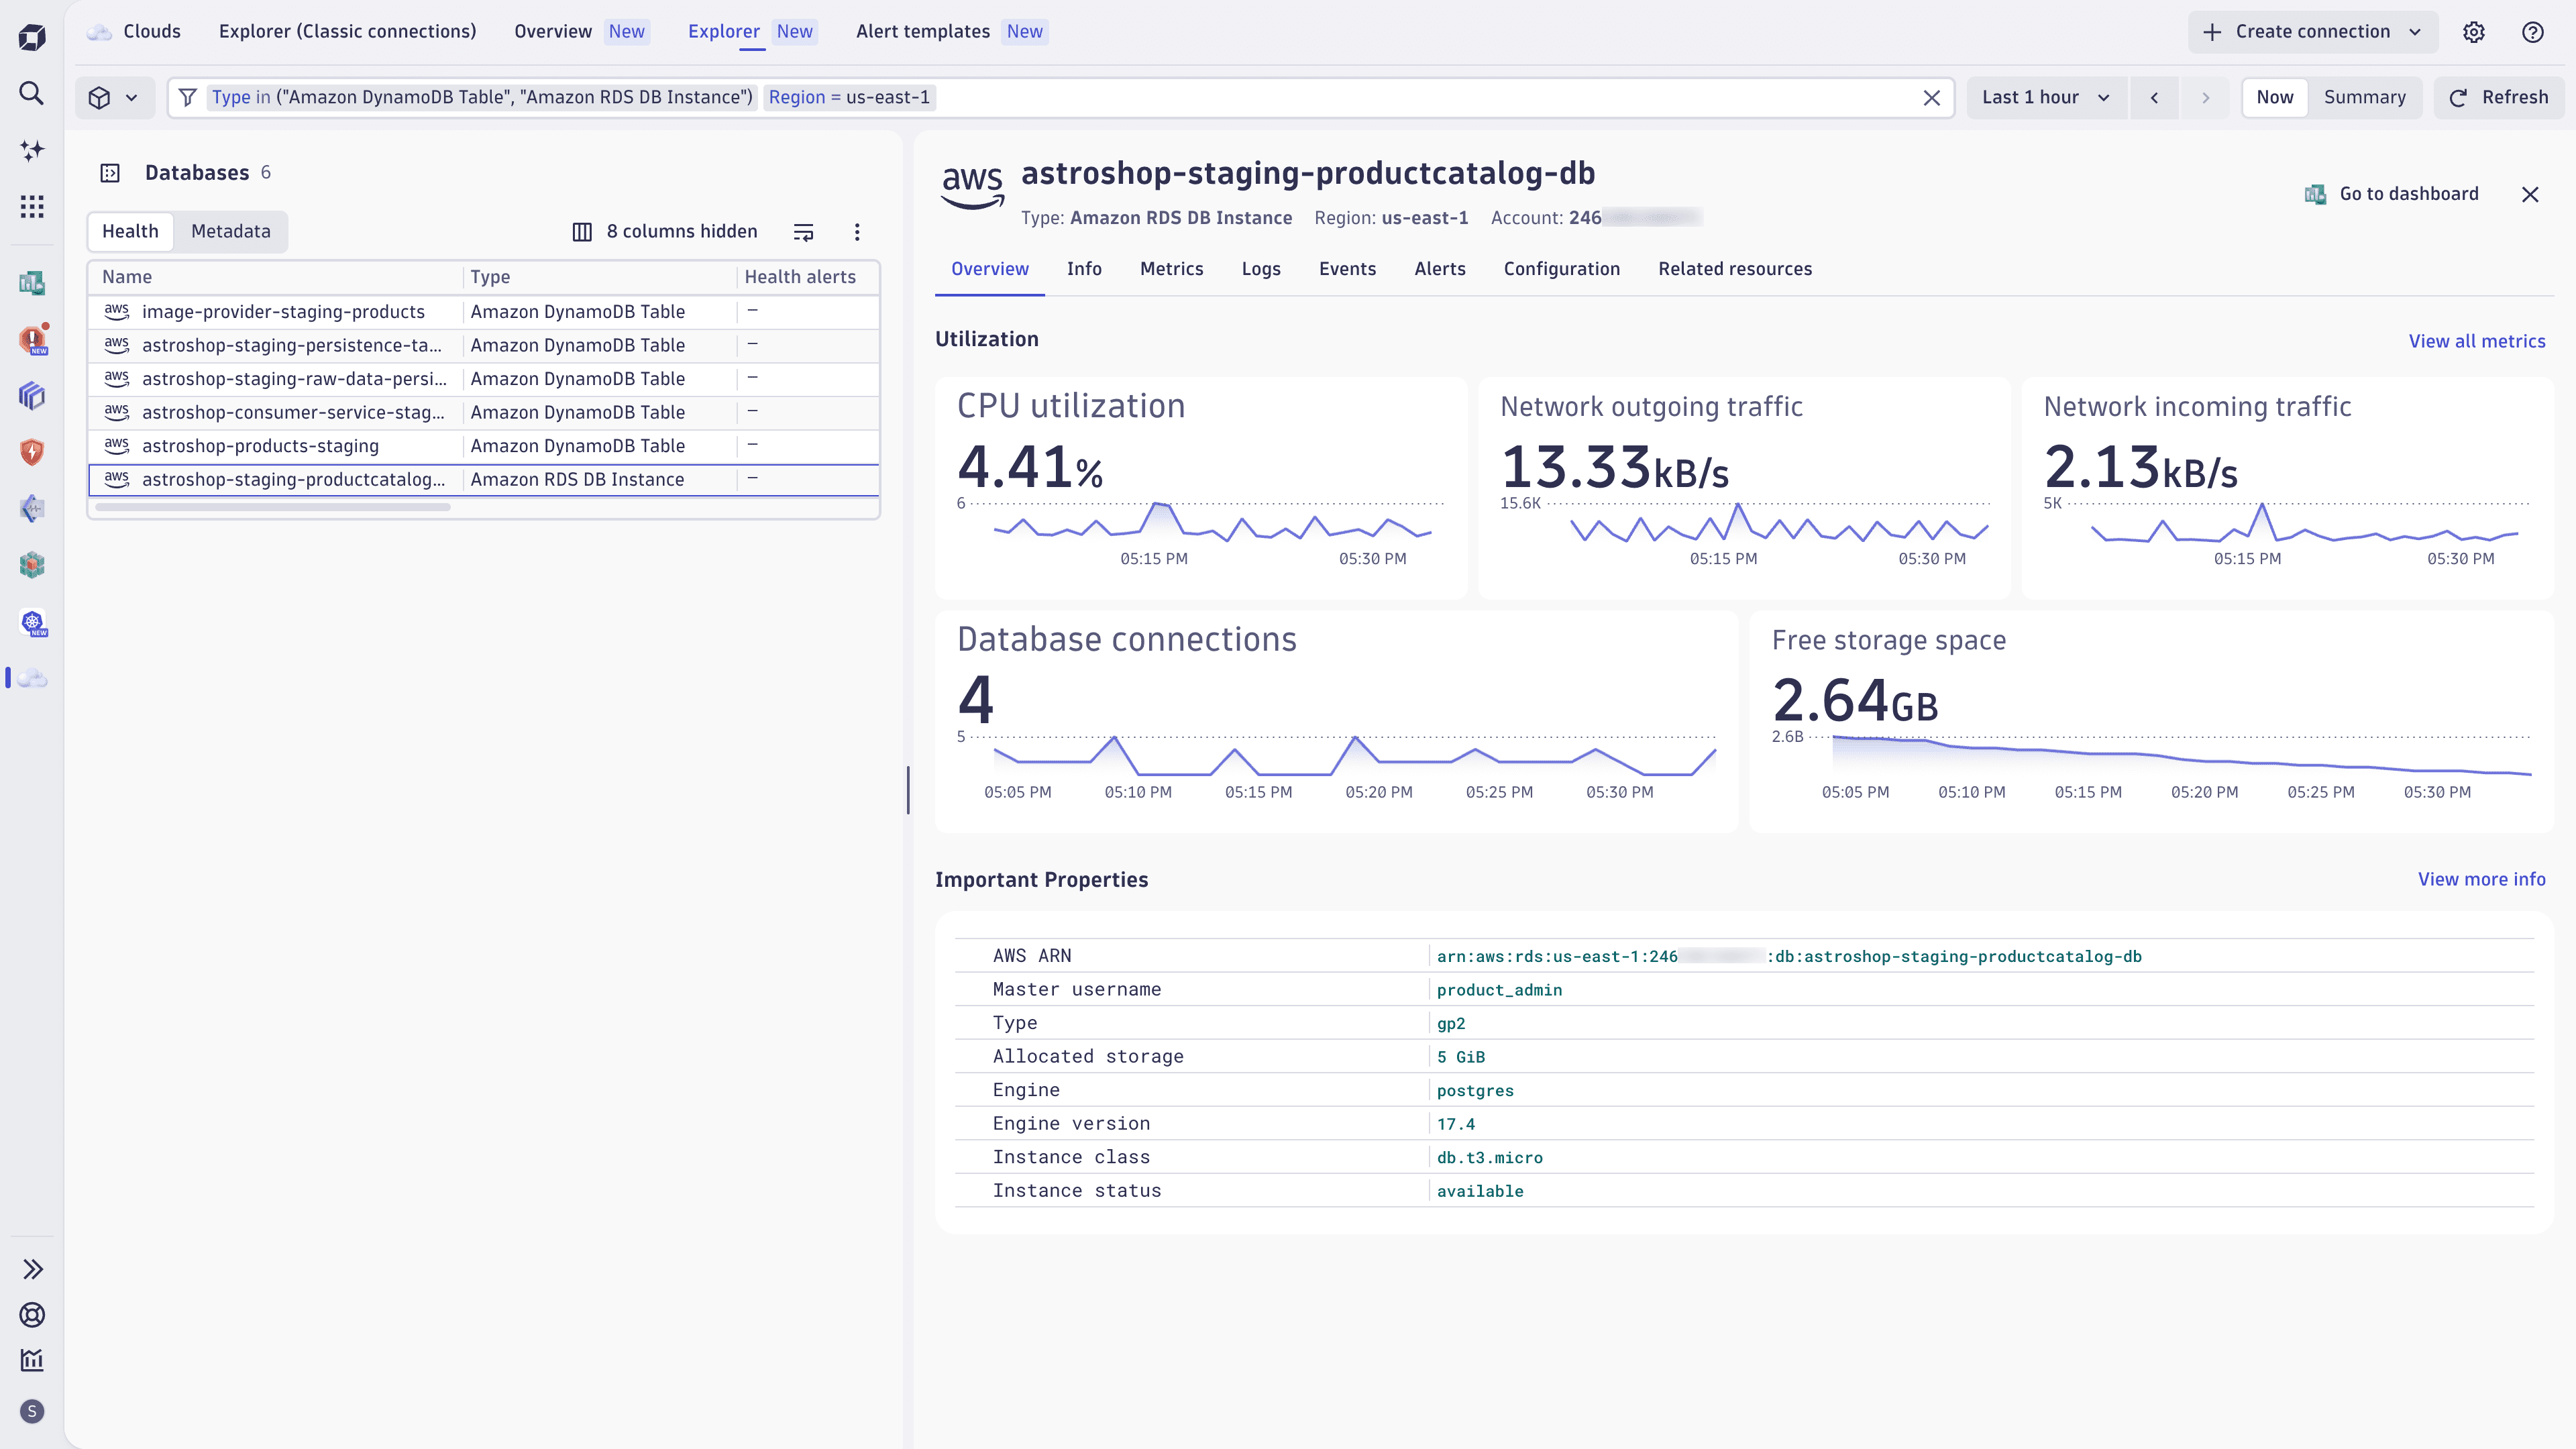
Use the Explorer New tab to analyze your AWS cloud services and environments. In the sidebar, select a service category (such as Containers or Functions) or analyze all services, then switch perspectives (Health, Utilization for compute services, Metadata) to focus the table on a specific use case.
Select a service in the table to analyze its metrics, logs, events, metadata, configuration, and topology in context. Select Go to dashboard to open the respective ready-made dashboard while maintaining the selected timeframe and filters.
For details, see Explorer view in Dynatrace apps.
Alerting (New connections)
Clouds provides ready-made health alerts and warning signals for your cloud services, as well as alert templates for setting up additional custom alerts for popular AWS services.
Health alerts and warning signals
Health alerts and warning signals are provided and maintained out of the box by Dynatrace.
-
A health alert creates a Dynatrace problem that triggers root-cause analysis in Dynatrace.
-
A warning is created for a resource when the observation is not critical and shouldn't raise a problem.
Health alerts and warning signals are both surfaced in
Clouds.
You can easily adopt ready-made health alerts and warning signals for your AWS accounts either upon your AWS connection onboarding or in ![]() Settings.
Settings.
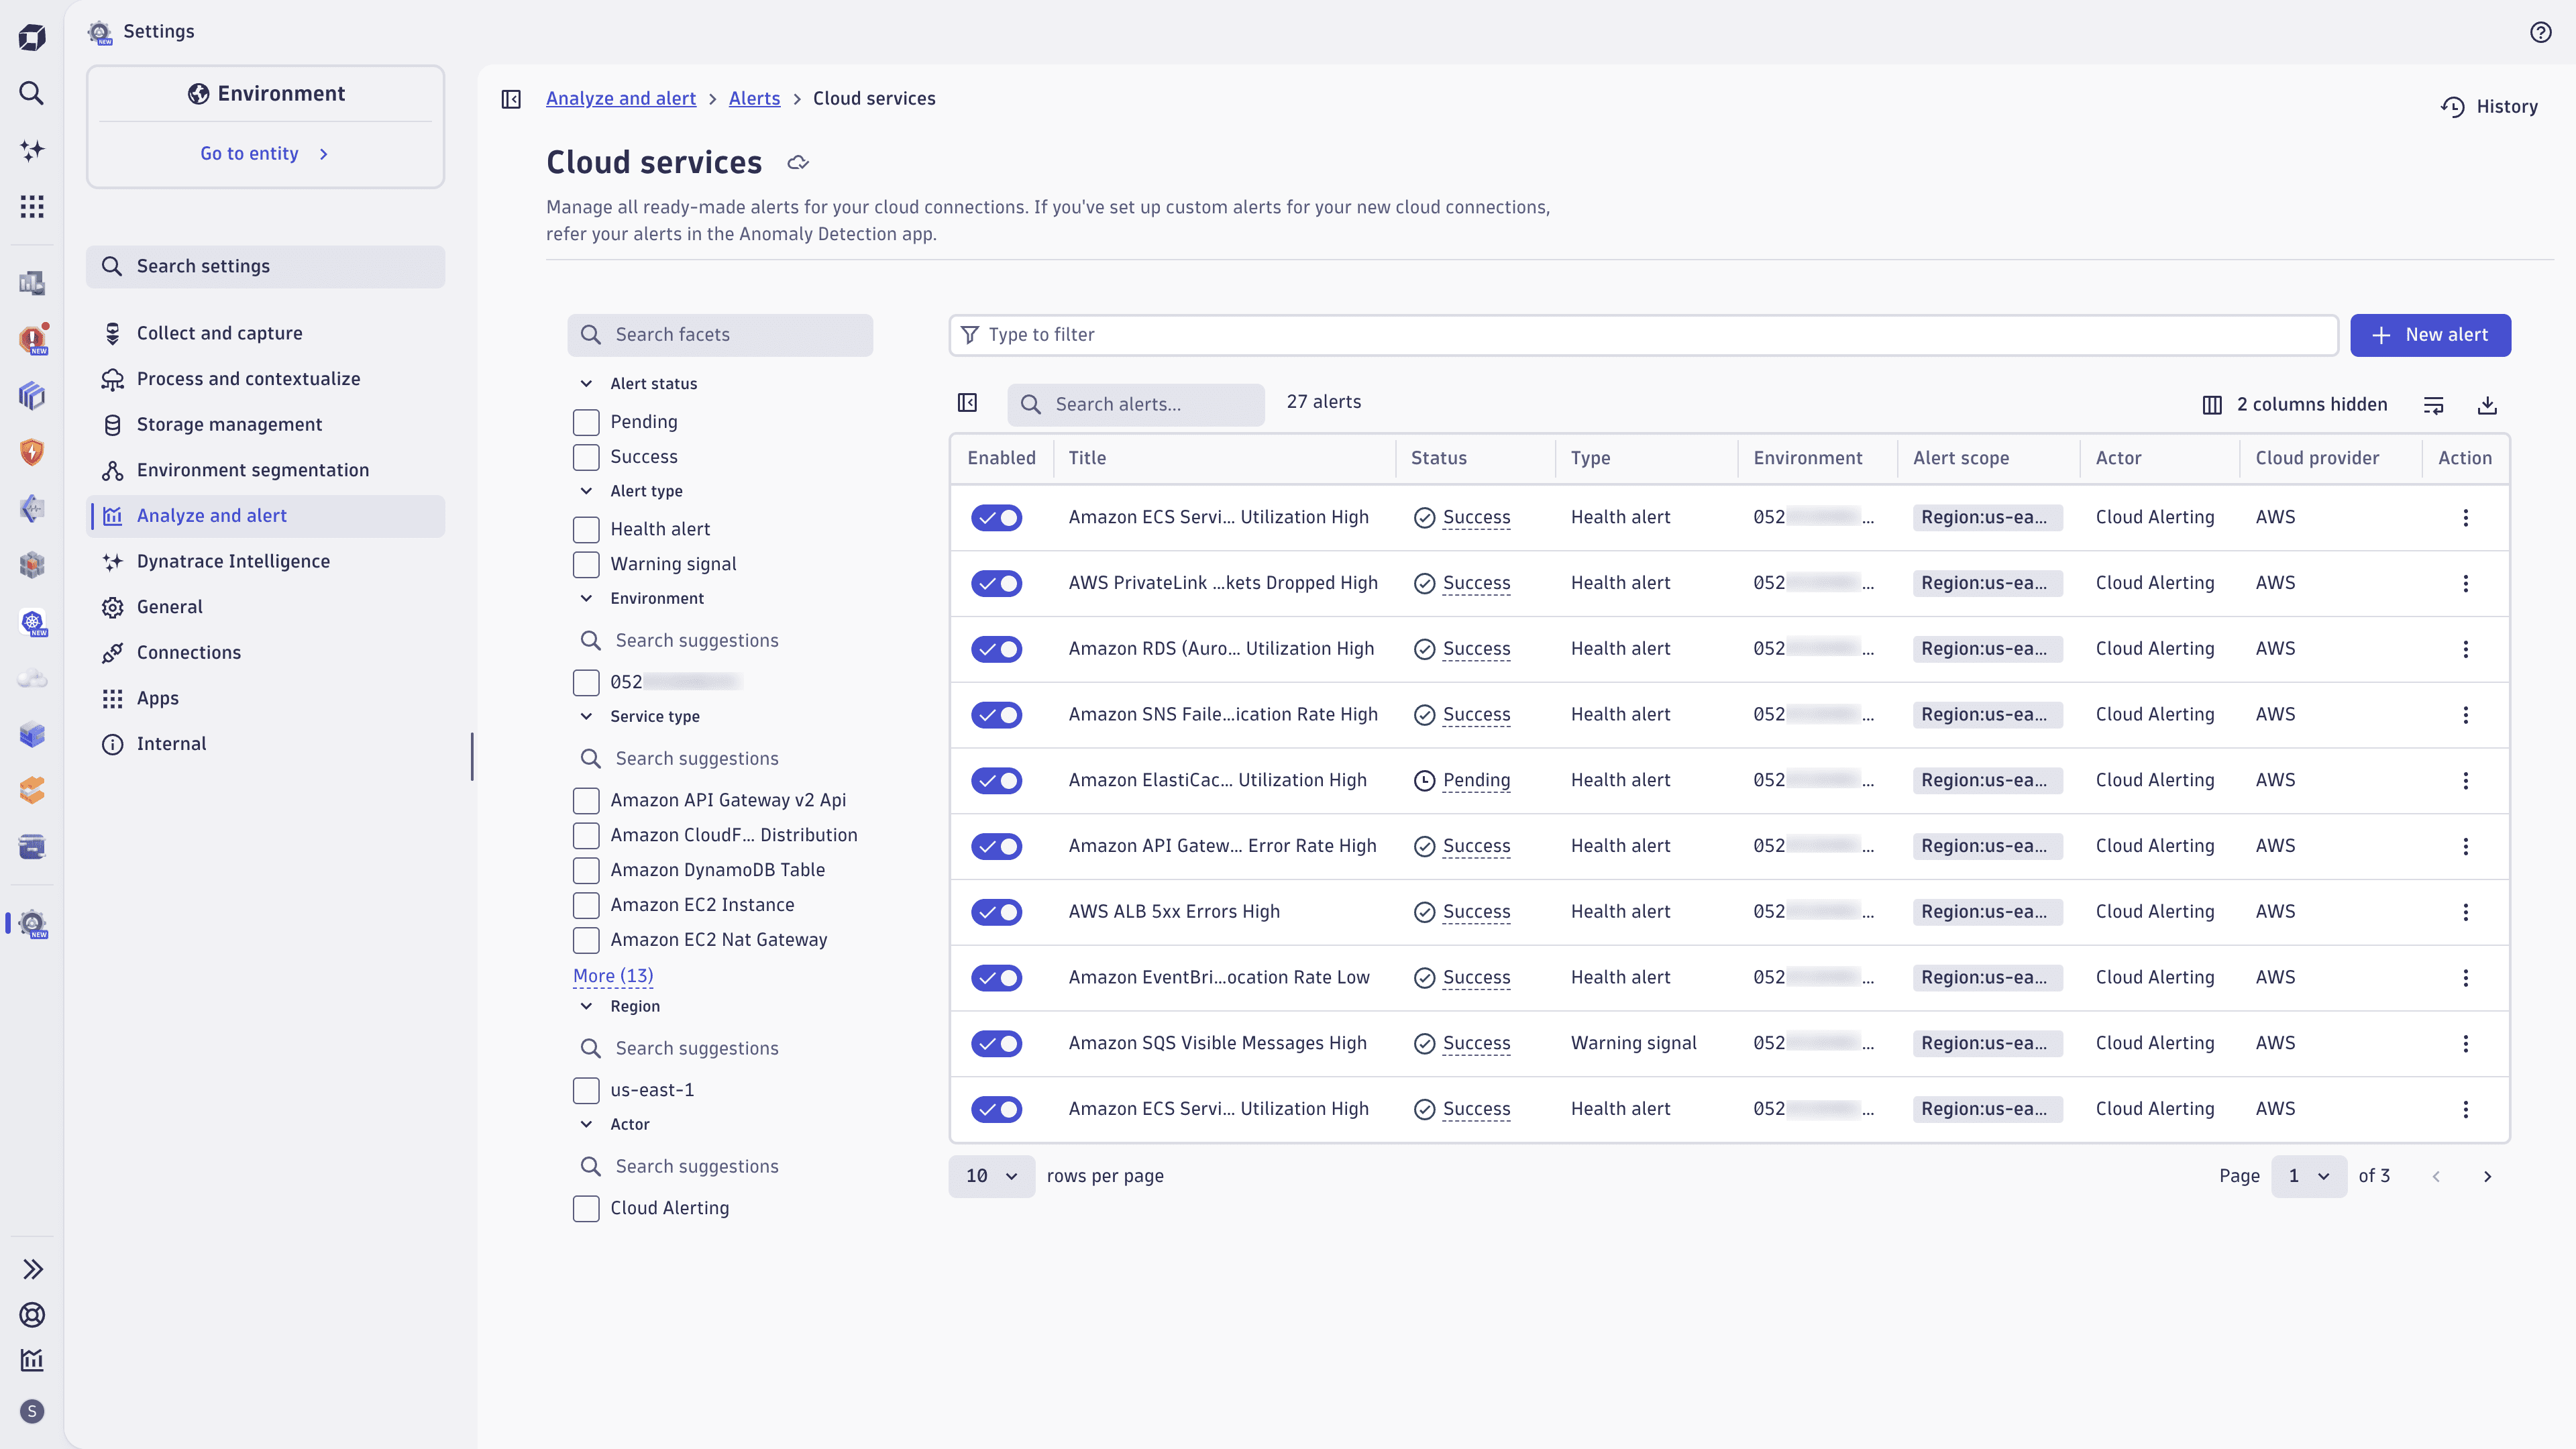
If you want to create new or update ready-made health alerts and warning signals, go to ![]() Settings > Analyze and alert > Alerts > Cloud services, where you can create, update, and enable/disable alerts for your connections.
Settings > Analyze and alert > Alerts > Cloud services, where you can create, update, and enable/disable alerts for your connections.
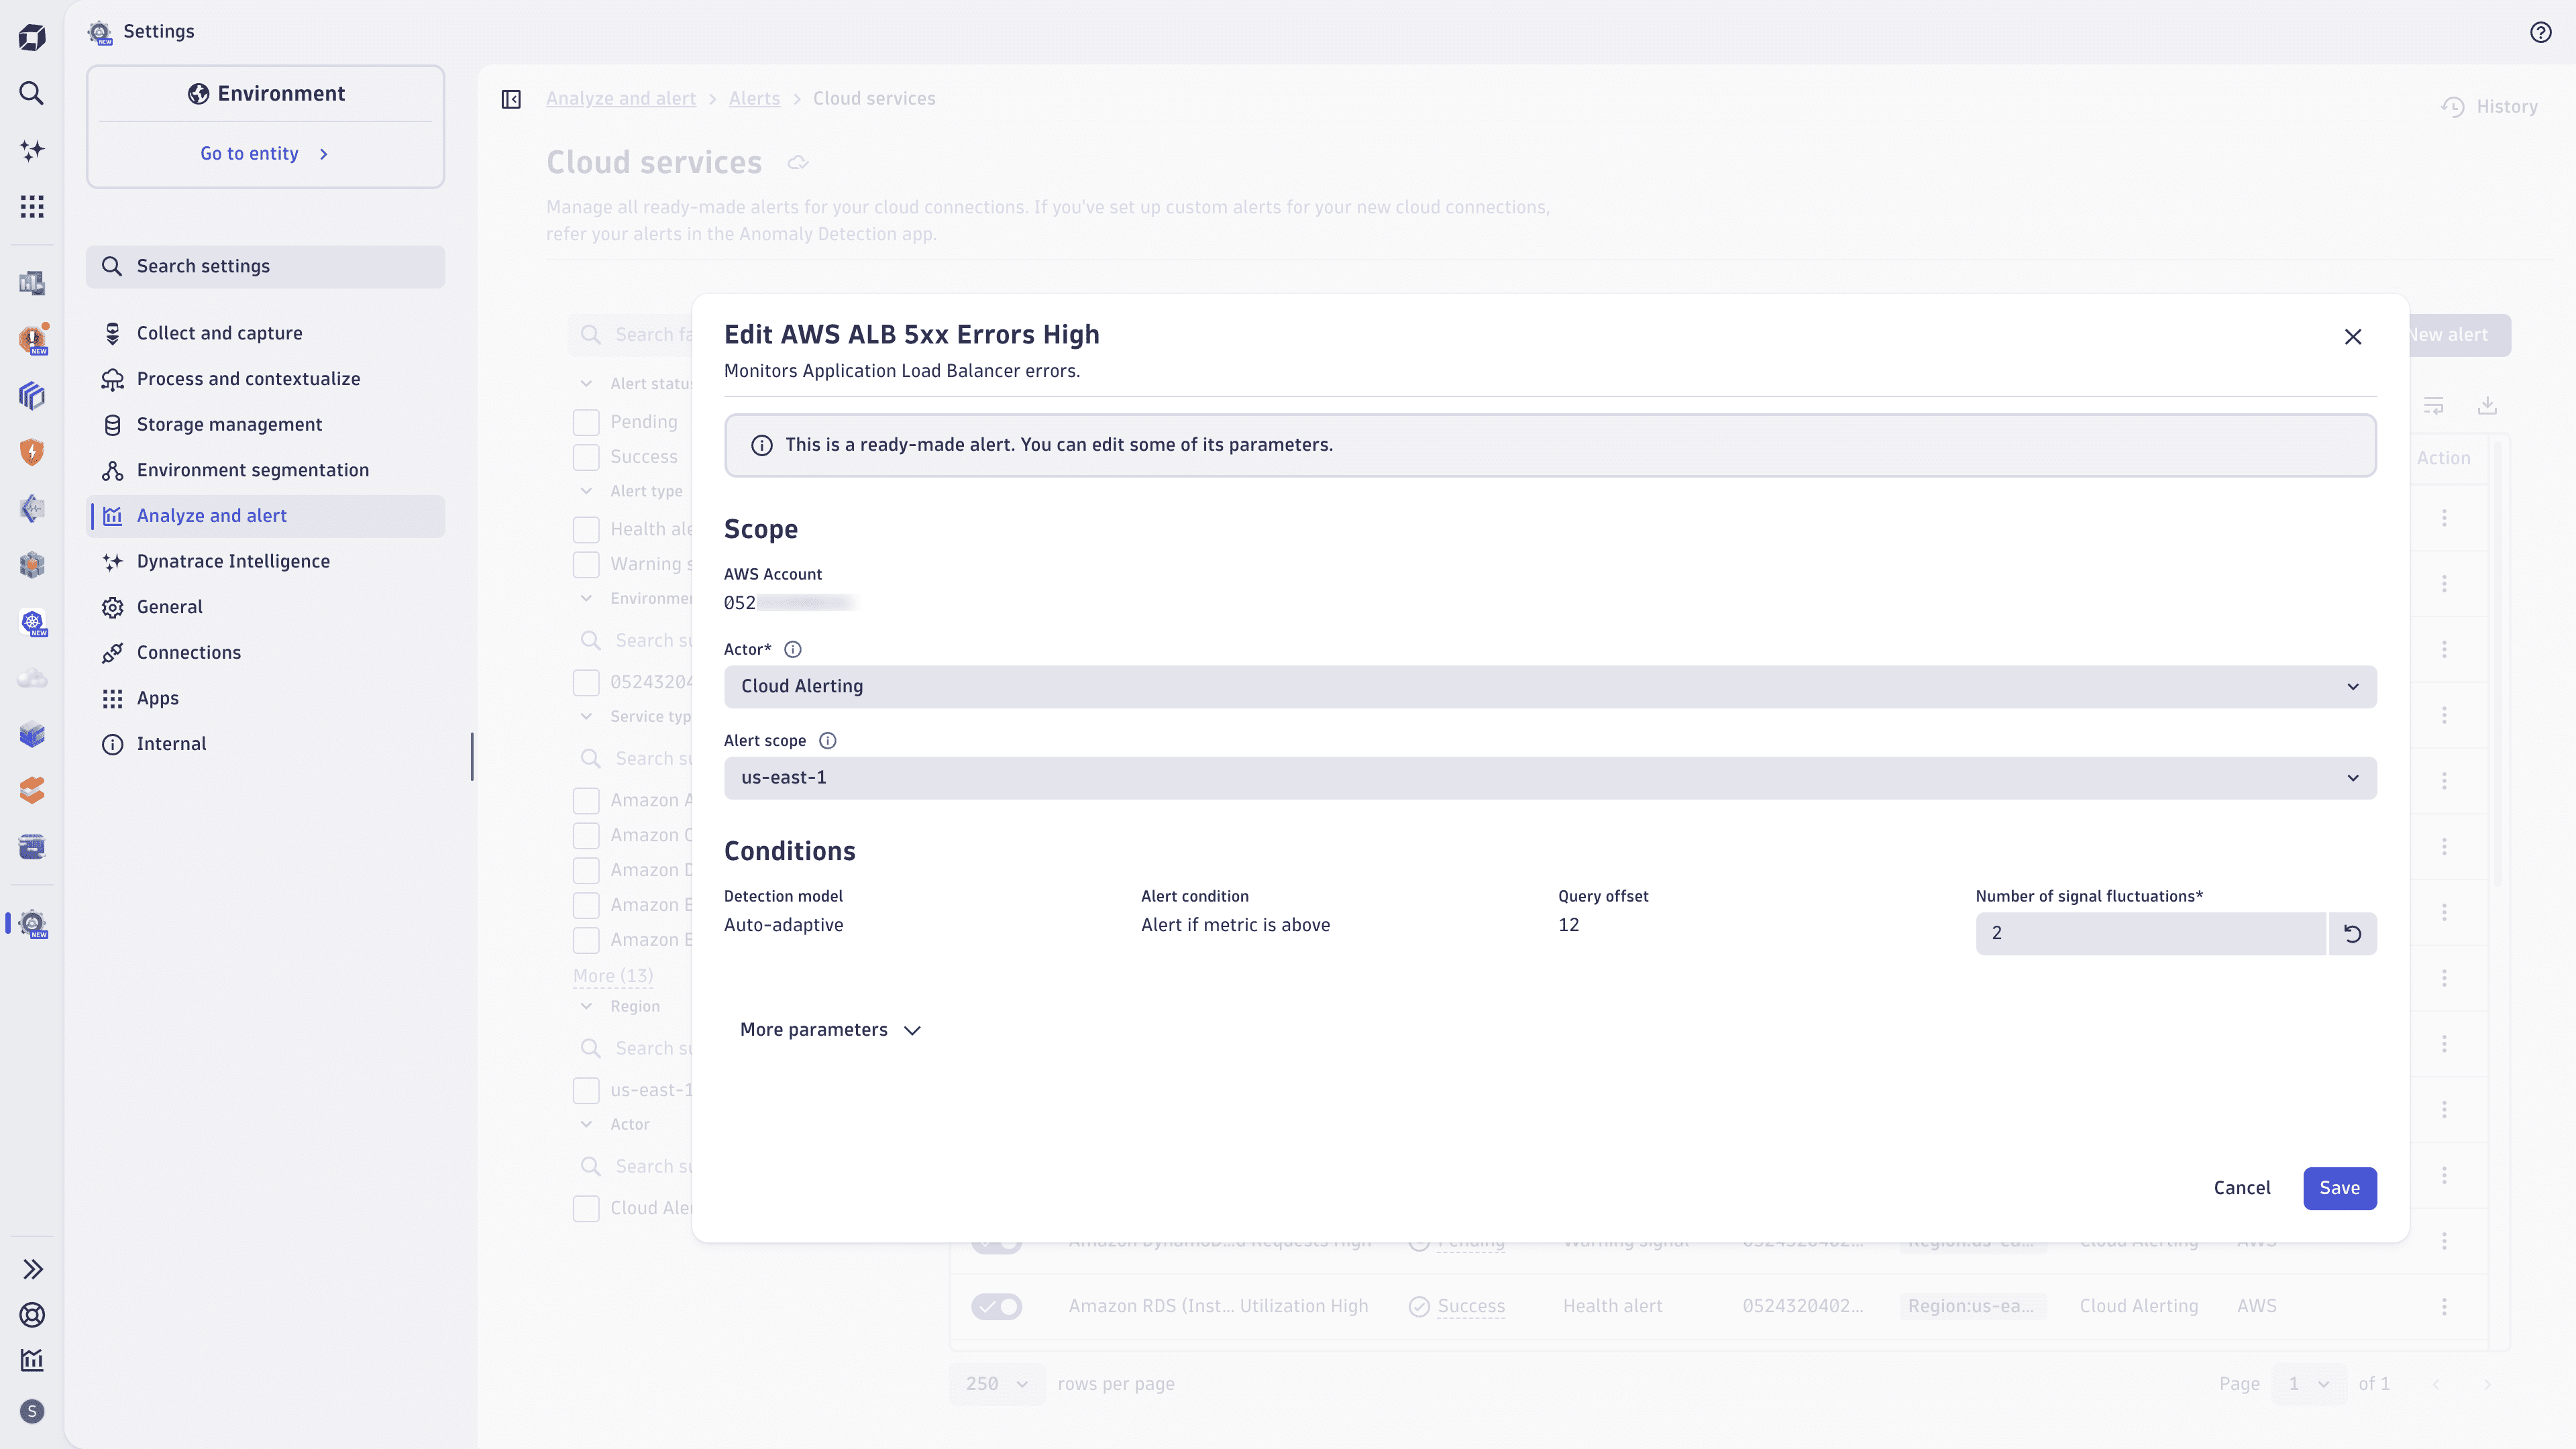
- Alert scope
- Actor (service user): Provide a Dynatrace service user on whose behalf the alert evaluation (and thus queries) are executed. The service user requires at least the following permissions:
storage:metrics:readstorage:buckets:readstorage:smartscape:readdavis:analyzers:execute
- Alert scope (region): Allows you to filter alert evaluations only for specific regions. For example, filter for
us-east-1to get alerts and warnings only for cloud services hosted in that region. - Alert conditions
- Depending on the detection model of the configured alert, you can customize different parameters such as threshold and number of signal fluctuations.
- Actor (service user): Provide a Dynatrace service user on whose behalf the alert evaluation (and thus queries) are executed. The service user requires at least the following permissions:
Alert templates
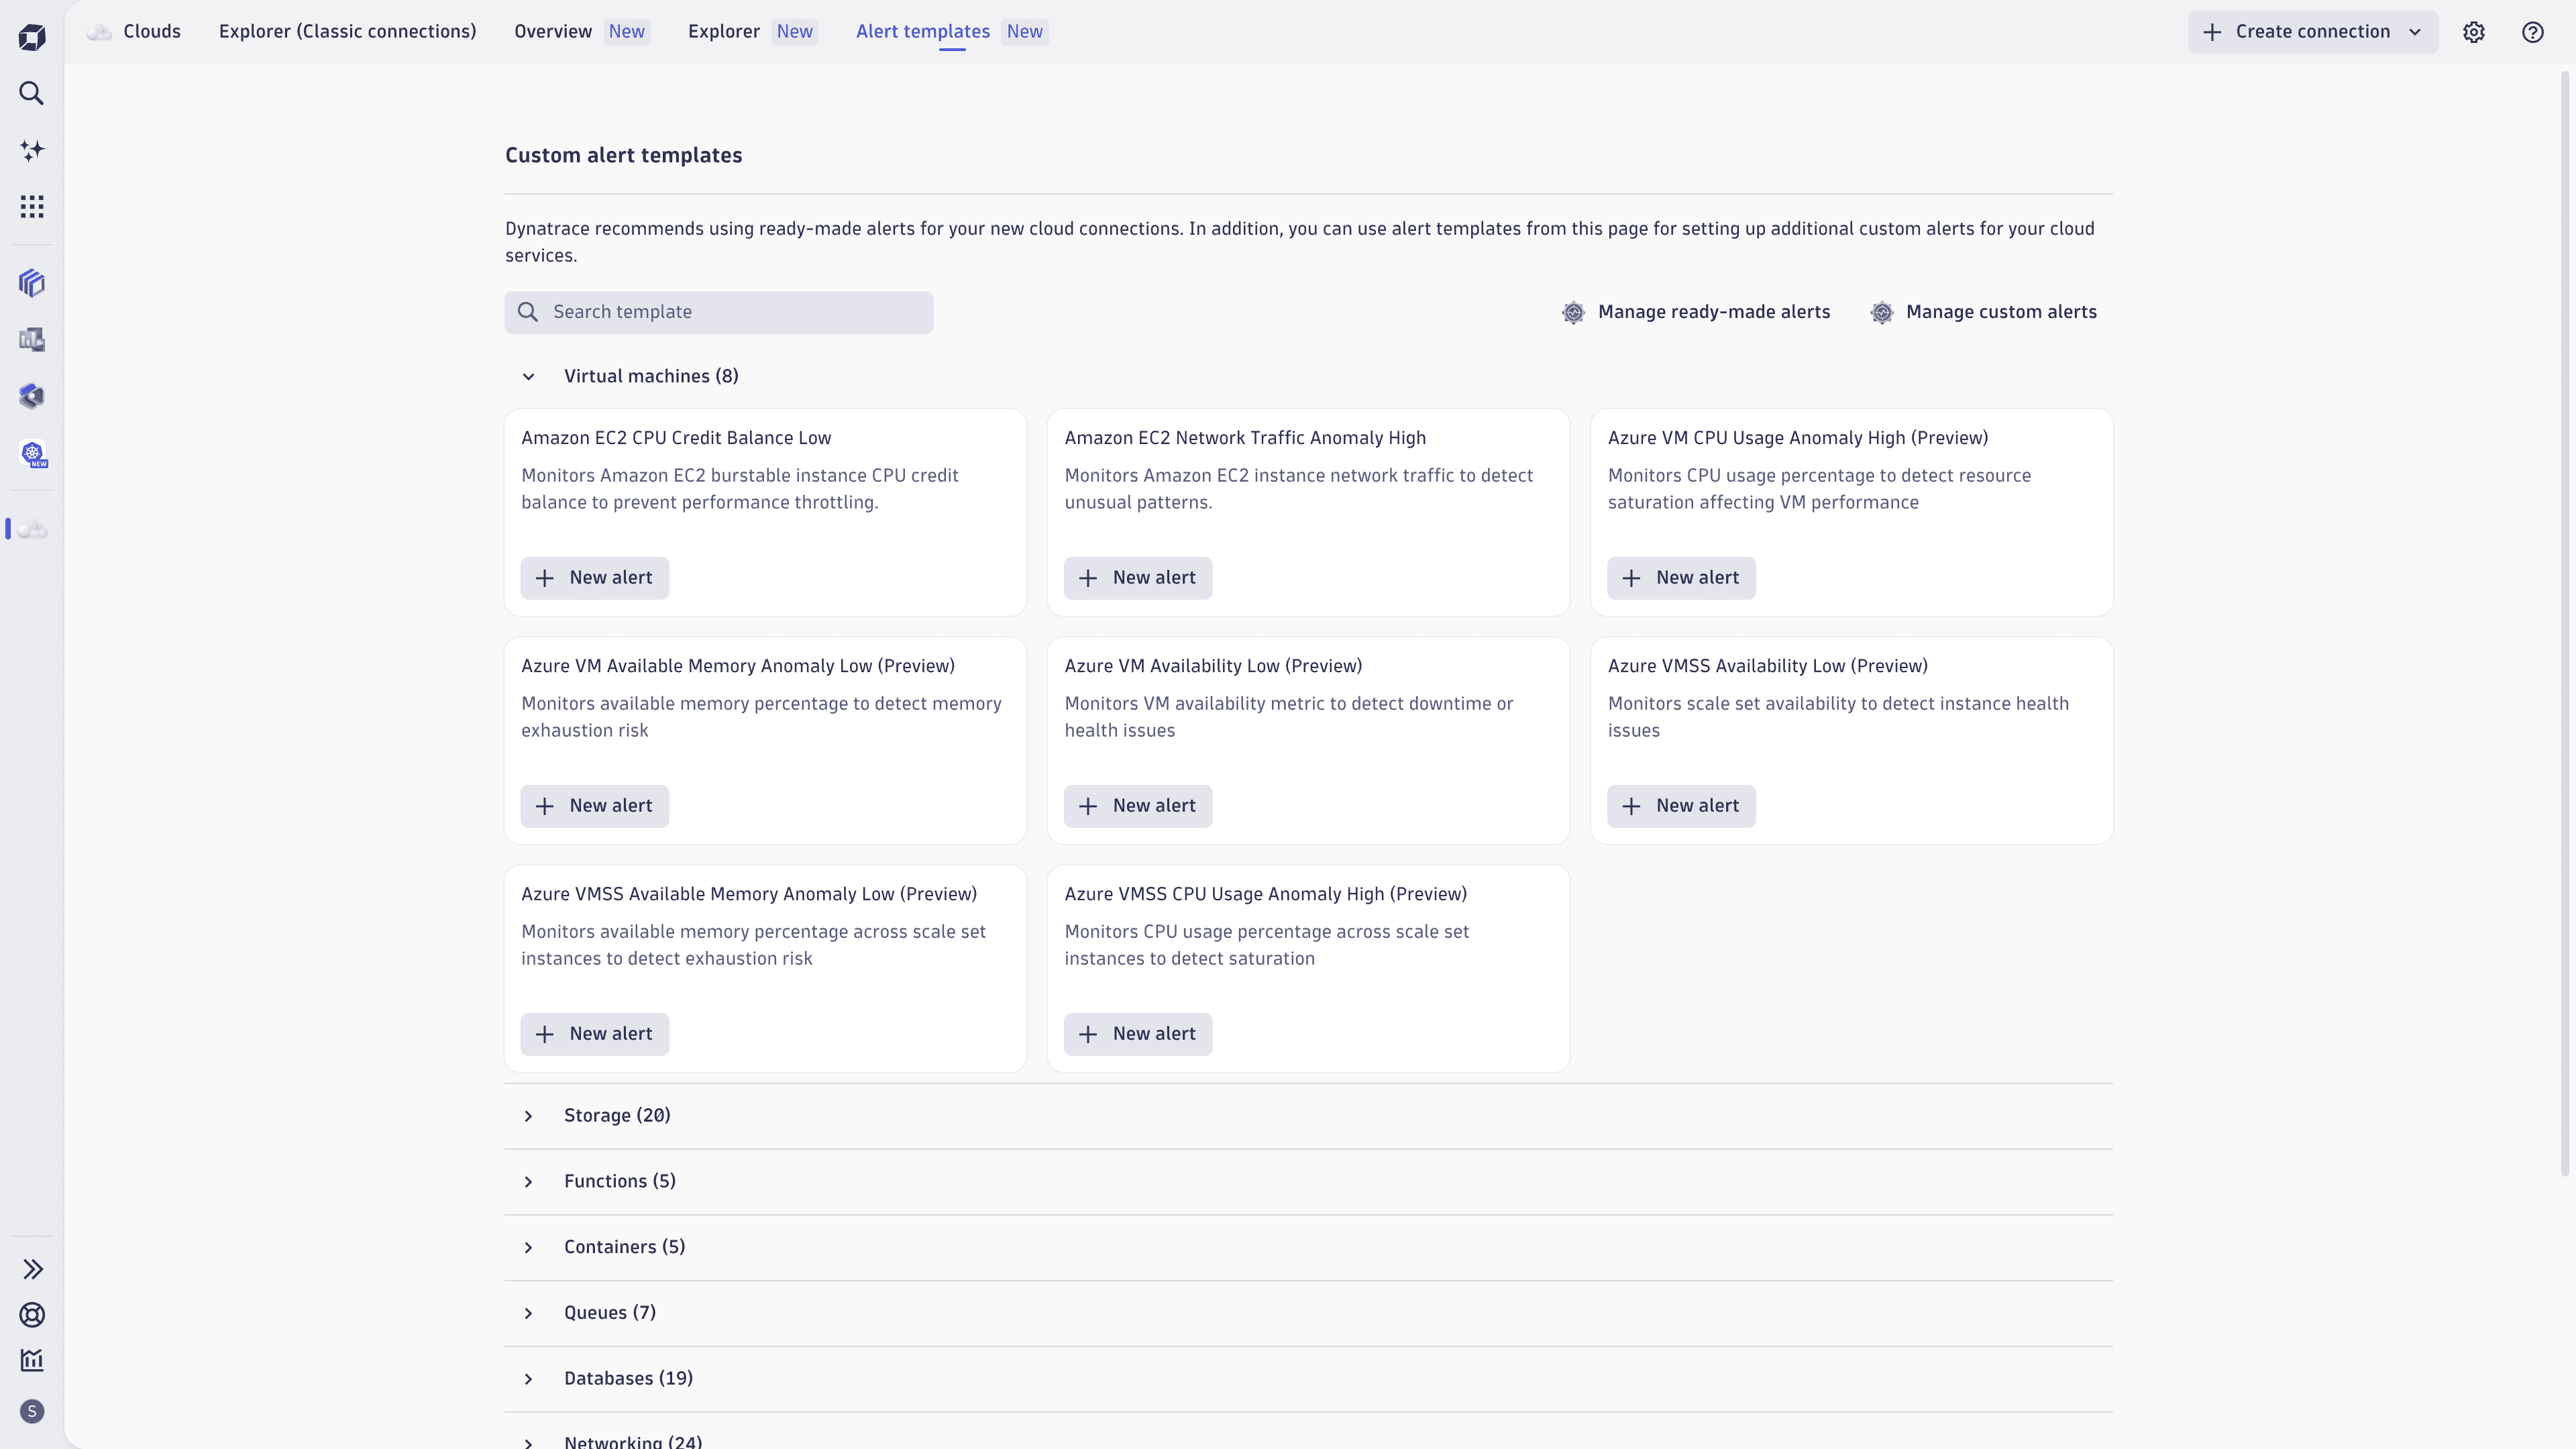
Dynatrace provides predefined alert templates to allow for additional custom alerts on popular cloud services. These alert templates are complementary to ready-made health alerts and warning signals.
You can easily create new custom alerts directly in Clouds by selecting a template and New Alert.
Next, you can either customize the alert in the Anomaly Detection wizard or create the alert with one click.
You can find all custom alerts and more information around capabilities and limits in  Anomaly Detection.
Explorer (Classic connections)
The Explorer (Classic connections) tab surfaces data coming from classic cloud connections and allows for the analysis of cloud services across AWS, Azure, and GCP.
If you've already used Dynatrace for cloud platform monitoring, the classic connections and Explorer (Classic connections) continue to provide the same value.
Concepts
New cloud connections vs classic cloud connections
Clouds provides a comprehensive view of your (multi-)cloud environments, enabling you to optimize the health, performance, and resource utilization of your cloud services.
Currently, Clouds supports two types of cloud connections:
New cloud connections (AWS/Azure)
The newest cloud platform connections by Dynatrace provide an easier, more flexible, and more powerful way to connect AWS and Azure cloud accounts with Dynatrace. Support for GCP will follow soon.
All data is natively stored in Grail and surfaced on the Overview New and Explorer New tabs within Clouds.
Classic connections
The classic cloud connections are available for AWS, Azure, and GCP within the previous (AWS Classic, Azure Classic, GCP Classic) and latest Dynatrace.
Classic connections are surfaced on the Explorer (Classic connection) tab in Clouds and have no specific licensing requirements.
If you're new to Dynatrace AWS Cloud Platform Monitoring, we recommend starting with the new AWS connections instead of the classic ones.
The Explorer New and Overview New tabs only operate upon data originating from new AWS cloud connections.
Azure and GCP will follow in the future.
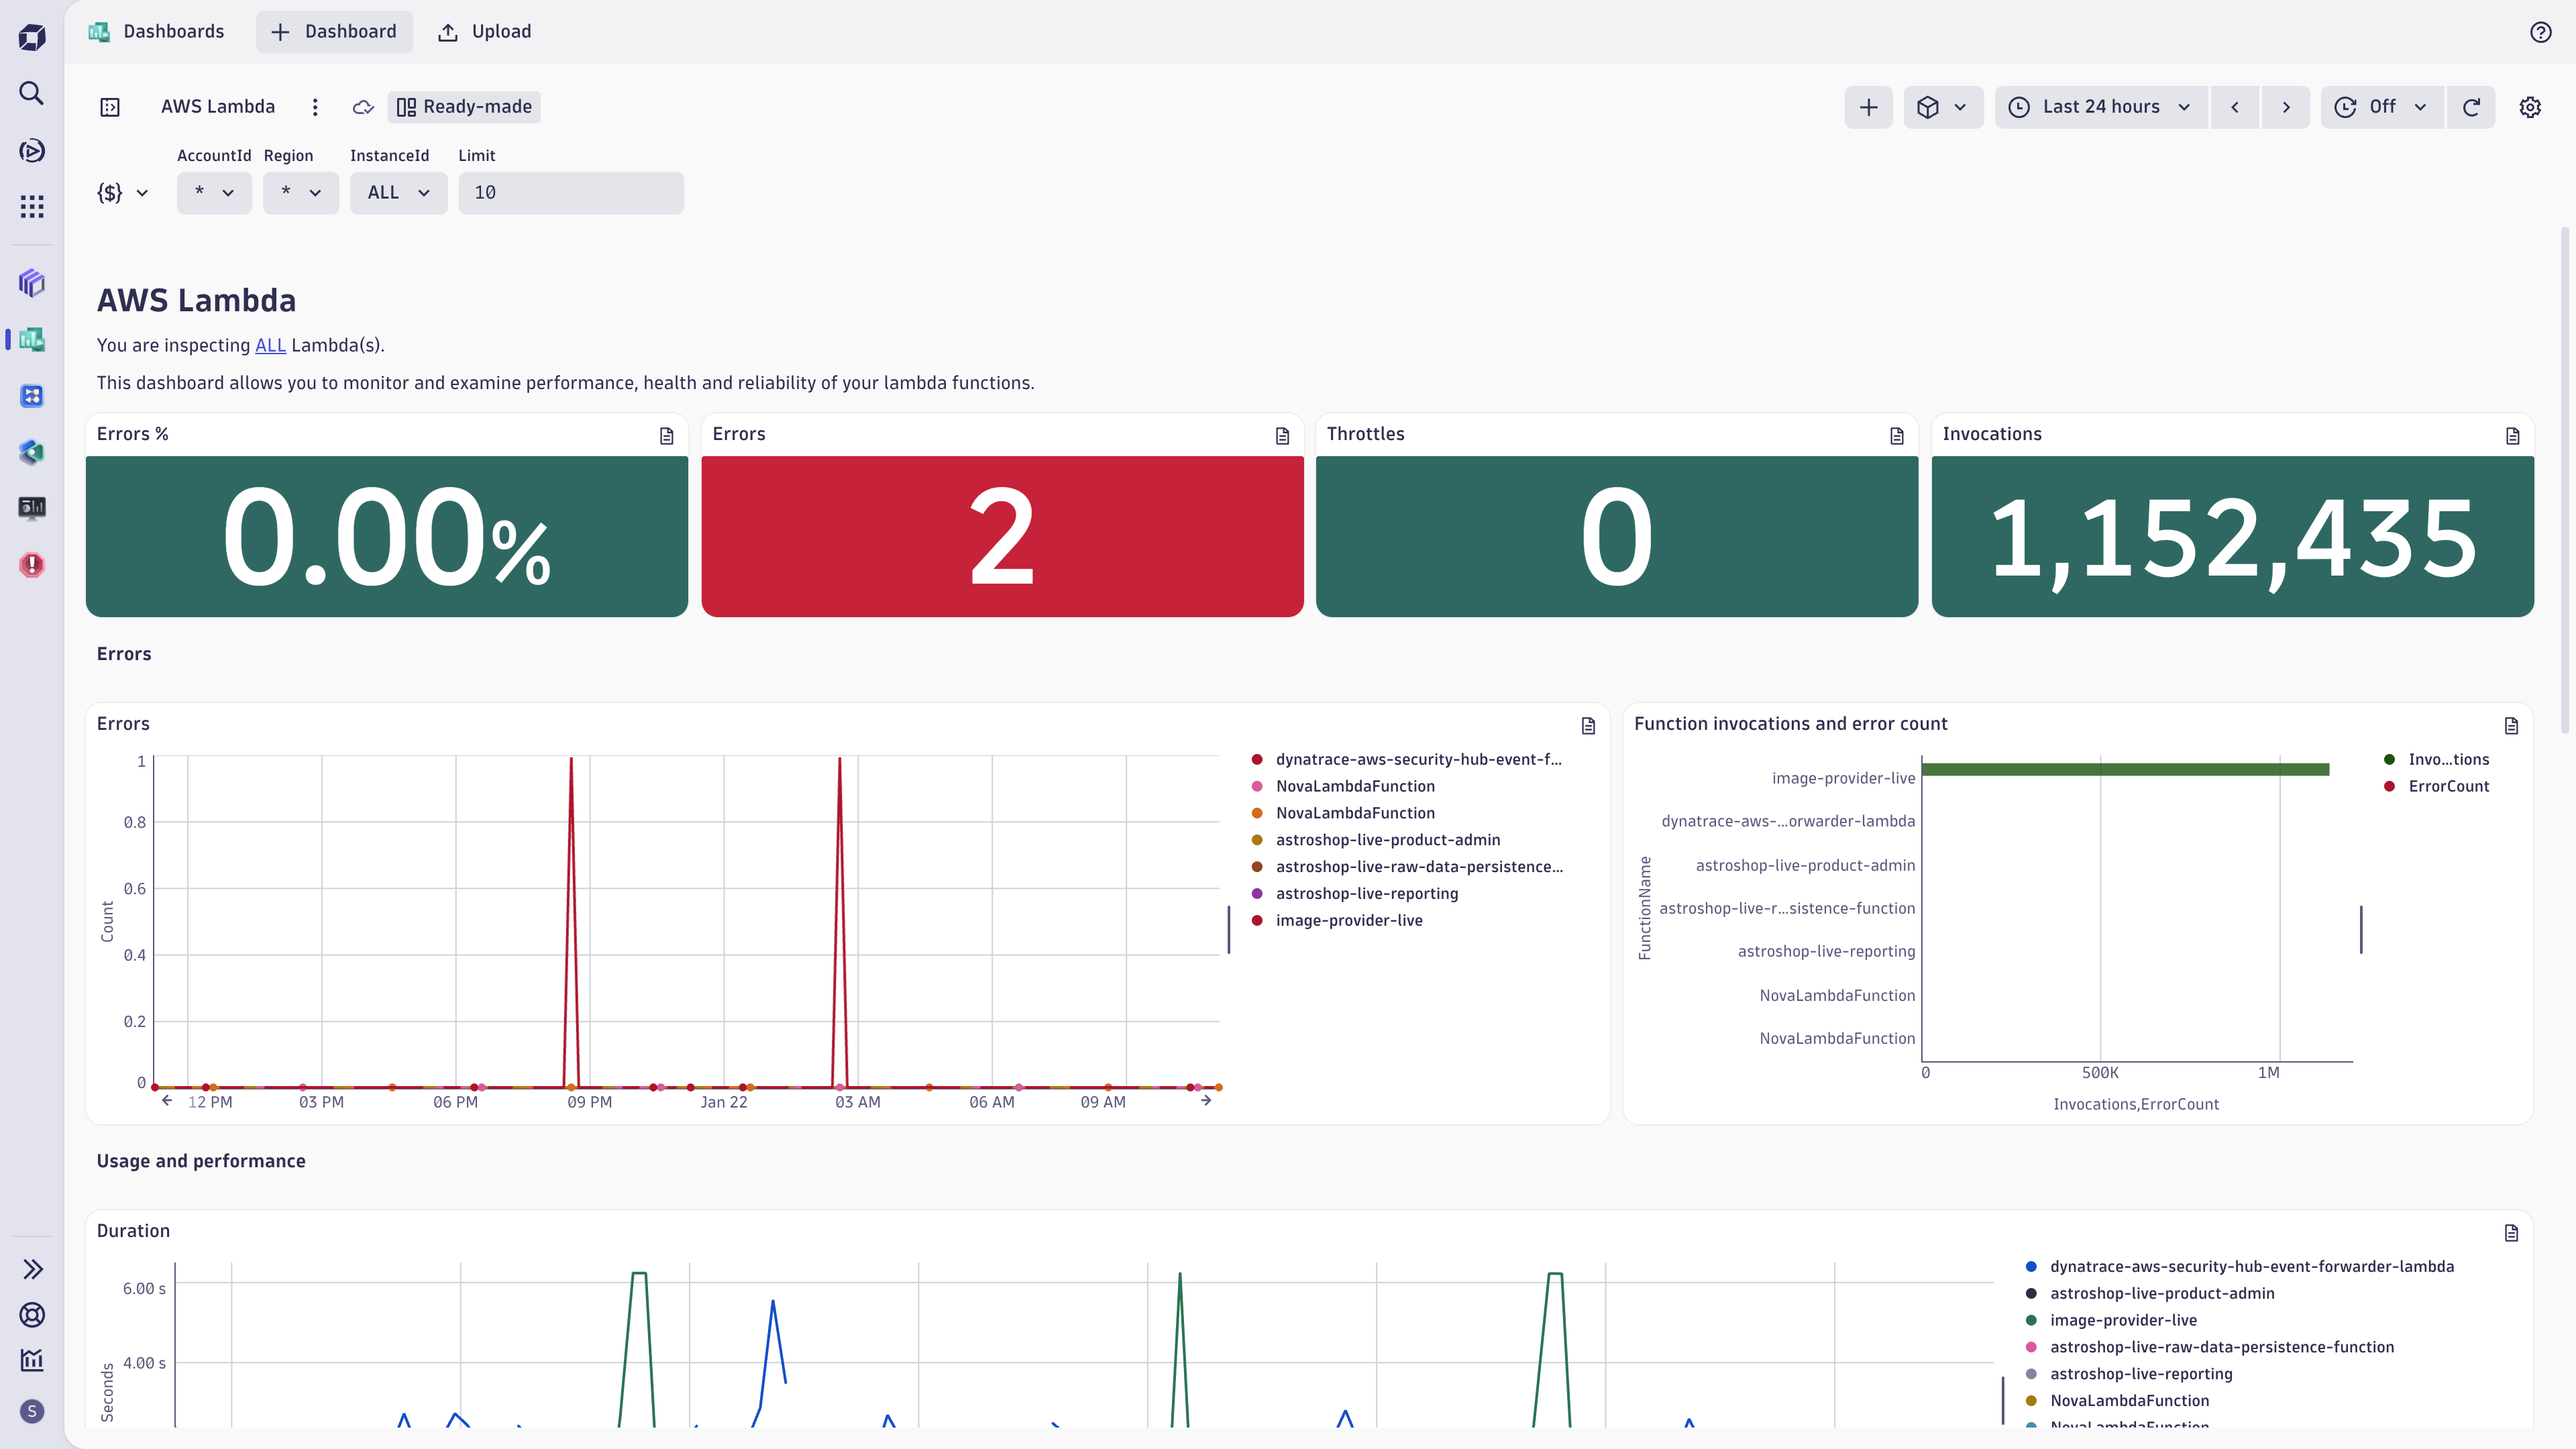
Ready-made dashboards (New connections)
You have access to the ready-made dashboards for the new AWS Cloud Platform Monitoring and Azure Cloud Platform Monitoring.
The ready-made dashboards can be accessed through:
-
Dashboards
Open
Dashboards, select Ready-made dashboards in the left menu, and search for aws. -
Clouds
- Open Clouds and select the Overview New tab. You can then either select one of the more popular dashboards directly (for example, AWS Lambda) or select Browse all dashboards.
- Clouds allows you to navigate from a specific service to the respective dashboard in context ( Go to dashboard). The selected timeframe, segment, and applied filters will be carried over from Clouds to the dashboard.
- Open
Segments (New connections)
In Clouds, segments are available within the Explorer New tab and can be defined on primary Grail fields (for example, aws.account.id, aws.region) or on Smartscape nodes. For details, see Segments and Filter Smartscape nodes with segments.
Use cases
- Understand your (multi-)cloud architectures and dependencies
- Assess health of your cloud services
- Troubleshoot problems in Clouds
- Analyze performance and resource utilization
FAQ
What if I already have existing cloud connections?
The existing, classic cloud connections stay as they are and are not automatically upgraded or removed.
To benefit from the new AWS Cloud Platform Monitoring, you need to create a new cloud connection for your AWS accounts.
We do not recommend setting up the classic and new cloud connections for the same AWS account. For a heterogeneous set of AWS accounts, classic and new cloud connections can co-exist.
 CloudsInfrastructure Observability