Upgrade Guide - Metric Alerting
- Dynatrace Classic
- How-to guide
- 6-min read
In Dynatrace classic metric alerting, you use custom metric alerting with thresholds and baselines along with built-in metric custom alerts. This document serves as a guide for upgrading to metric alerting in the latest Dynatrace, ensuring that scenarios that raise alerts on metric thresholds and baselines continue working seamlessly.
New concepts
Before you start with performing this upgrade, familiarize yourself with core concepts of the latest Dynatrace, such as what Dynatrace Grail is and how to query data using DQL.
Anomaly detection
Anomaly detection is the automated process of identifying unusual patterns or behaviors within data that deviate from the norm. This involves continuous monitoring of application performance, user actions, and various metrics to establish baseline metrics and detect any deviations in real-time. Customizable thresholds and automated baselining help in accurately detecting and notifying anomalies, ensuring prompt alerts for potential issues.
In the latest Dynatrace, custom alerts help with the following:
- Getting notified about problems in an environment.
- Using Davis analyzer (static and auto-adoptive thresholds, or seasonal baseline) to detect abnormal behavior and set up alerts for custom events.
Prerequisites
- An active DPS license
 Anomaly Detection permissions
Metric alerting in Dynatrace Classic
The main use case for configuring and applying thresholds and baselines on metrics and timeseries in general is automatic detection of outliers and anomalies and raising alerts for those.
Dynatrace by default ships a large list of out-of-the-box custom alerts. Extensions and users have the possibility to introduce their own completely customized custom alerts.
Out-of-the-box detectors in the previous Dynatrace
- Host and process infrastructure custom alerts
Detecting CPU and memory saturation along with network, host, process, and process groups instance availability detection. For more information, see Adjust the sensitivity of anomaly detection for infrastructure.
- Automated multi-dimensional baselining detector
Automated baselining attempts to determine the best reference values for incoming application and service traffic. For more information, see the following topics:
- Extension events
Installed extensions providing various event thresholds that are evaluated by anomaly detection. For more information, see Adjust the sensitivity of anomaly detection for extension events.
Customizable classic custom alerts in the previous Dynatrace
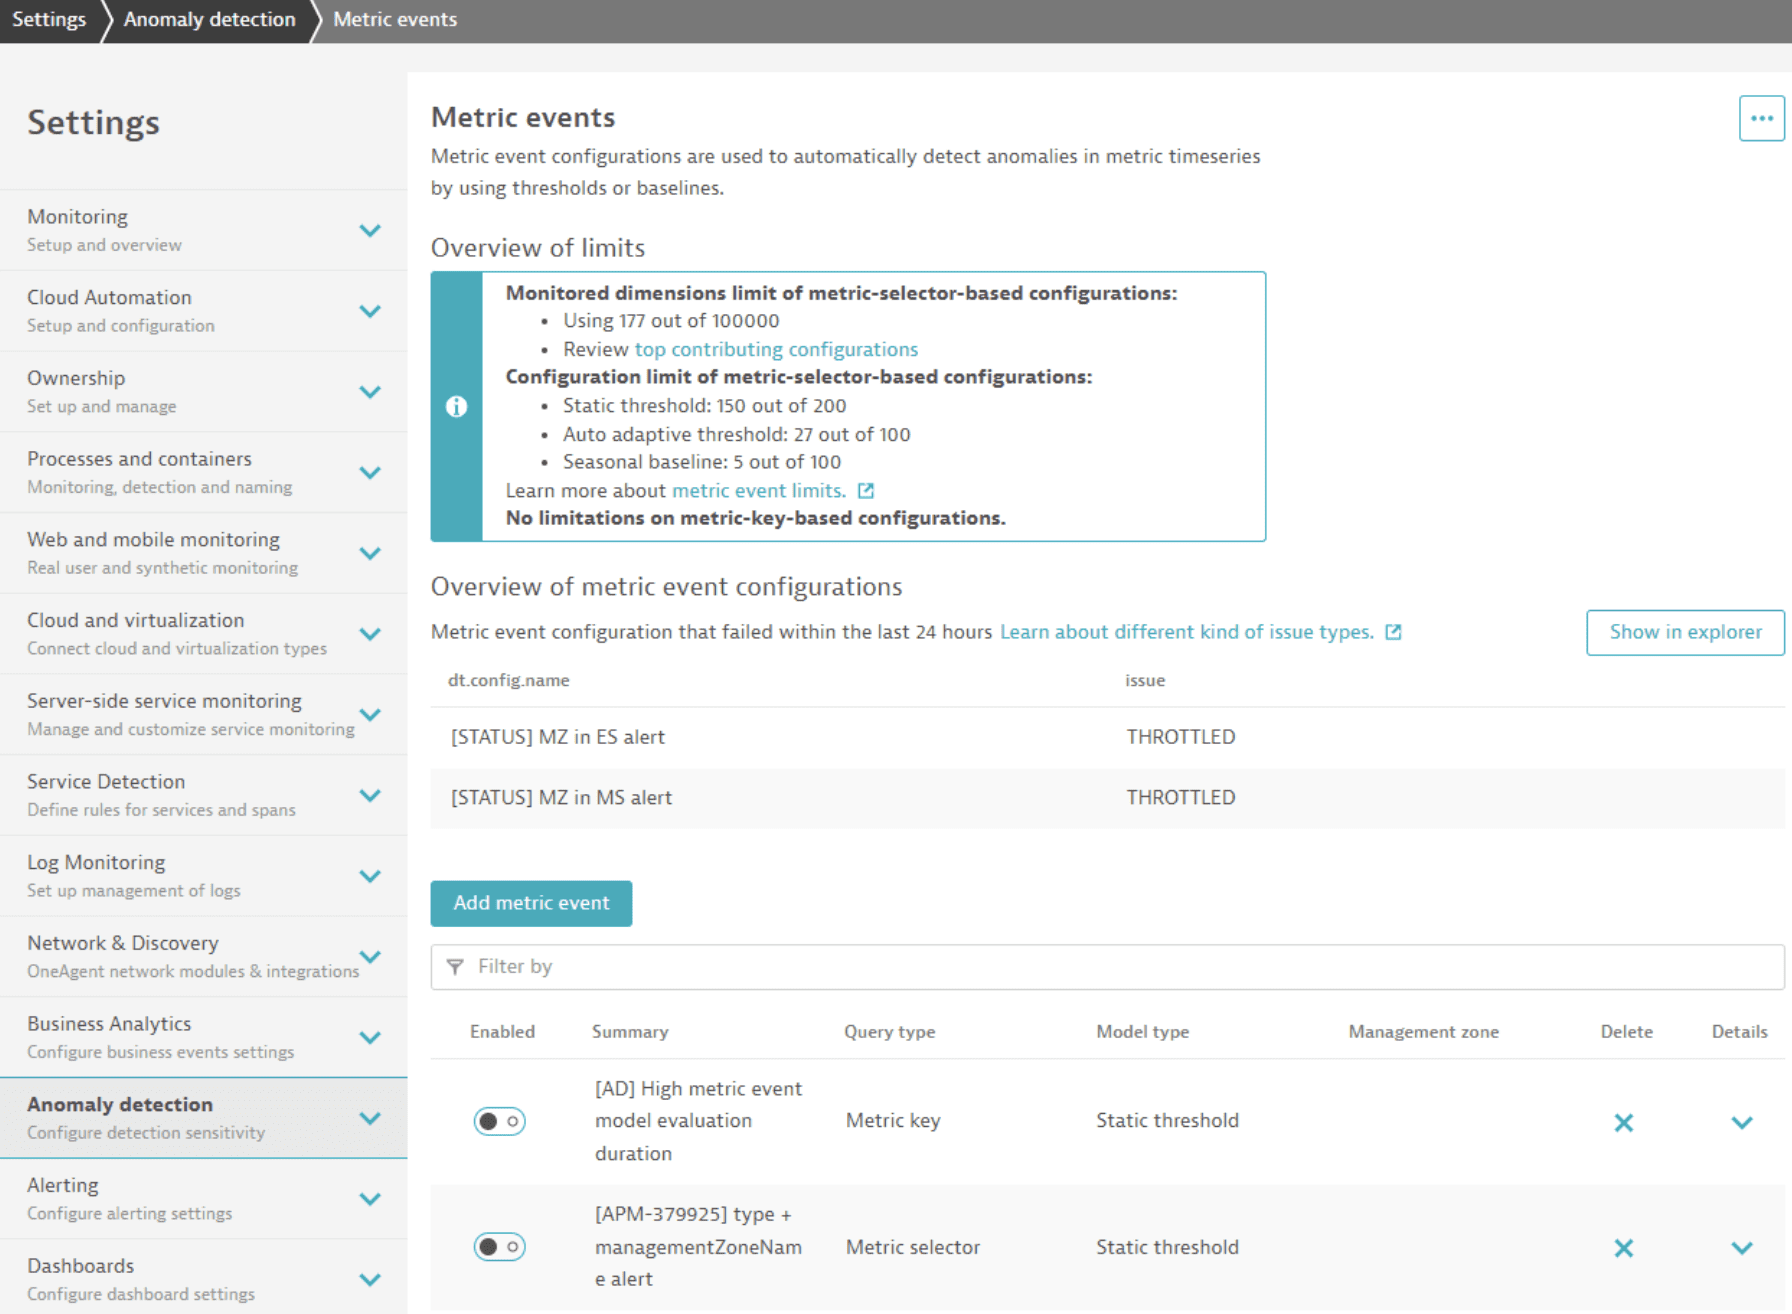
Metric events
Dynatrace offers customizable custom alerts for domain specific business needs. Once a custom alert is triggered, an event is created based on metric data.
There are two types of metric events based on how the metric is queried for event evaluation:
-
Metric key events evaluate the incoming measures of a single metric. You can use only static thresholds with this query type.
-
Metric selector events evaluate a complex query defined by the metric selector. This query type can include historical data and even arithmetic operations with multiple metrics.
To learn more about the differences between metric key and metric selector and how to set them up in classic settings, see Dynatrace Metric Events – Setup anomaly detection based on your business.
Metric events used by other solutions
- AWS
Dynatrace offers recommended AWS custom alerting rules. Enabling predefined alerting rules will create such configurations in metric events. For more information, see Set up metric events for alerting.
- Azure
Dynatrace offers recommended Azure custom alerting rules. Enabling custom alerting rules will create such configurations in metric events. For more information, see Set up metric events for alerting.
- SLO
In
 Service-Level Objectives Classic you have the option to create a burn rate or status alerts. For more information, see Configure and monitor service-level objectives with Dynatrace.
SLO use functional metrics which behave different during transformation. We're working on a separated guide, covering SLOs and how to upgrade them.
- Extensions
For hundreds of technologies, extensions make domain-specific expertise available in Dynatrace by adding individual data acquisition capabilities. Some extensions—such as the one for F5—provide predefined alerts that are automatically created as metric events during installation. For more information, see the F5 BIG-IP extension in Dynatrace Hub.
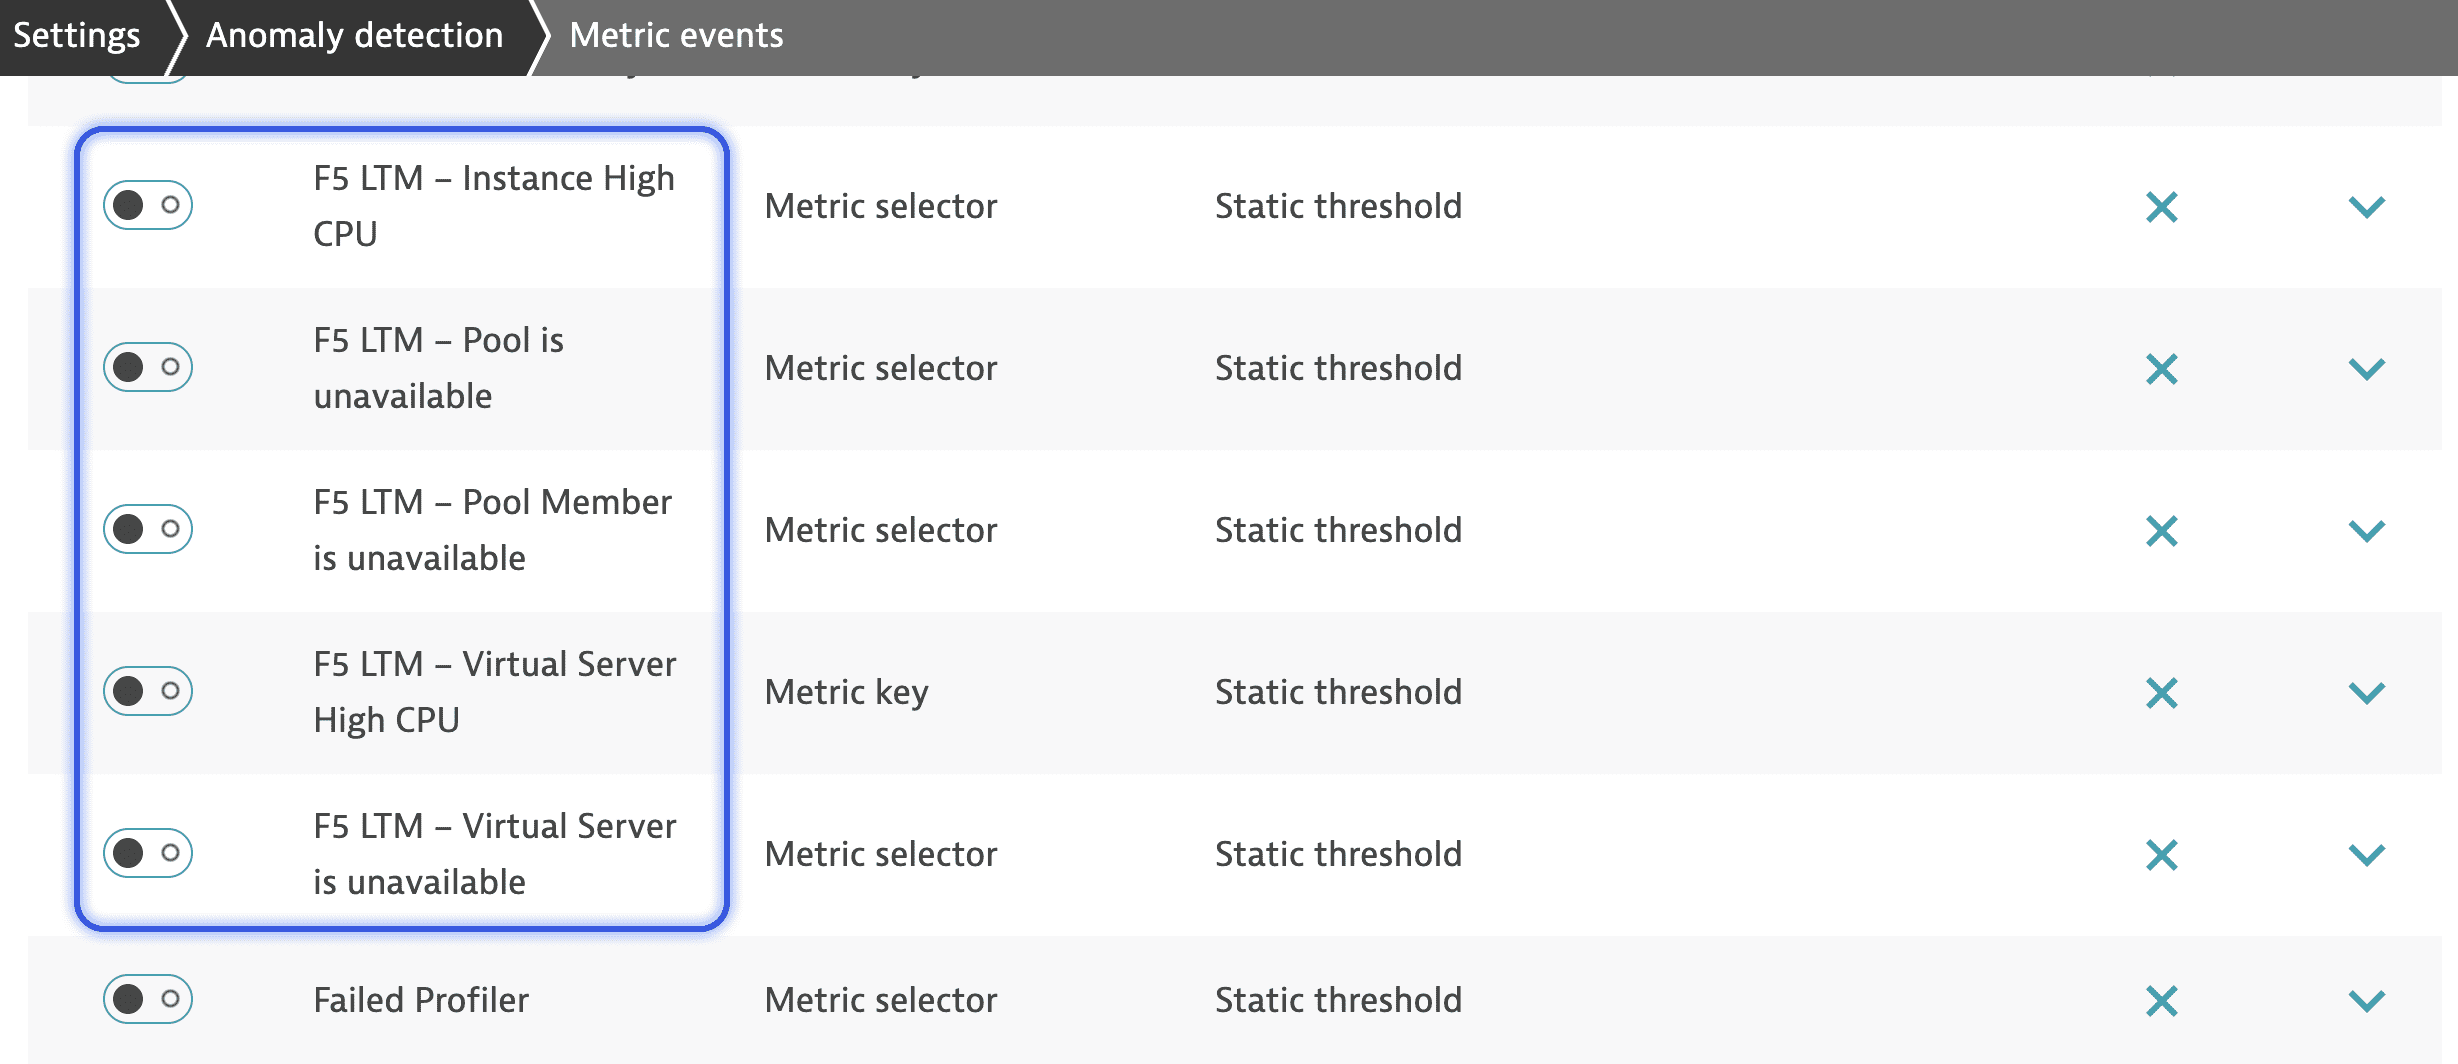 F5 Big IP extension in settings
You can use the transpiler from
Anomaly Detection to update the respective configuration.Once you're done, verify whether each configuration was successfully upgraded and whetherany warnings or errors occurred during the upgrade. In the future, there'll be a DQL Alerting template similar to the one available for F5 BIG-IP.
How to upgrade metric events to custom alerts
To create a custom alert, use Anomaly Detection.
Anomaly Detection
Anomaly Detection focuses on enhancing timeseries monitoring through real-time analysis of data stored in Grail using DQL queries. We encourage you to also try the app for more advanced configuration options such as:
- Using DQL queries in addition to Grail records.
- Alerting on data such as logs, spans, and business events.
- Creating advanced queries and including a higher number of data records.
Before continuing, have a look at the following resources for more detailed information:
- Dynatrace Documentation:
- Videos:
- Blog:
Example: Upgrade of a metric event from Dynatrace Classic
Enable authorization settings
If you're running Anomaly Detection for the first time, enable authorization settings.
-
Go to
Anomaly Detection. -
Select
 > Authorization settings.
 -
Select the required permissions under Permissions.
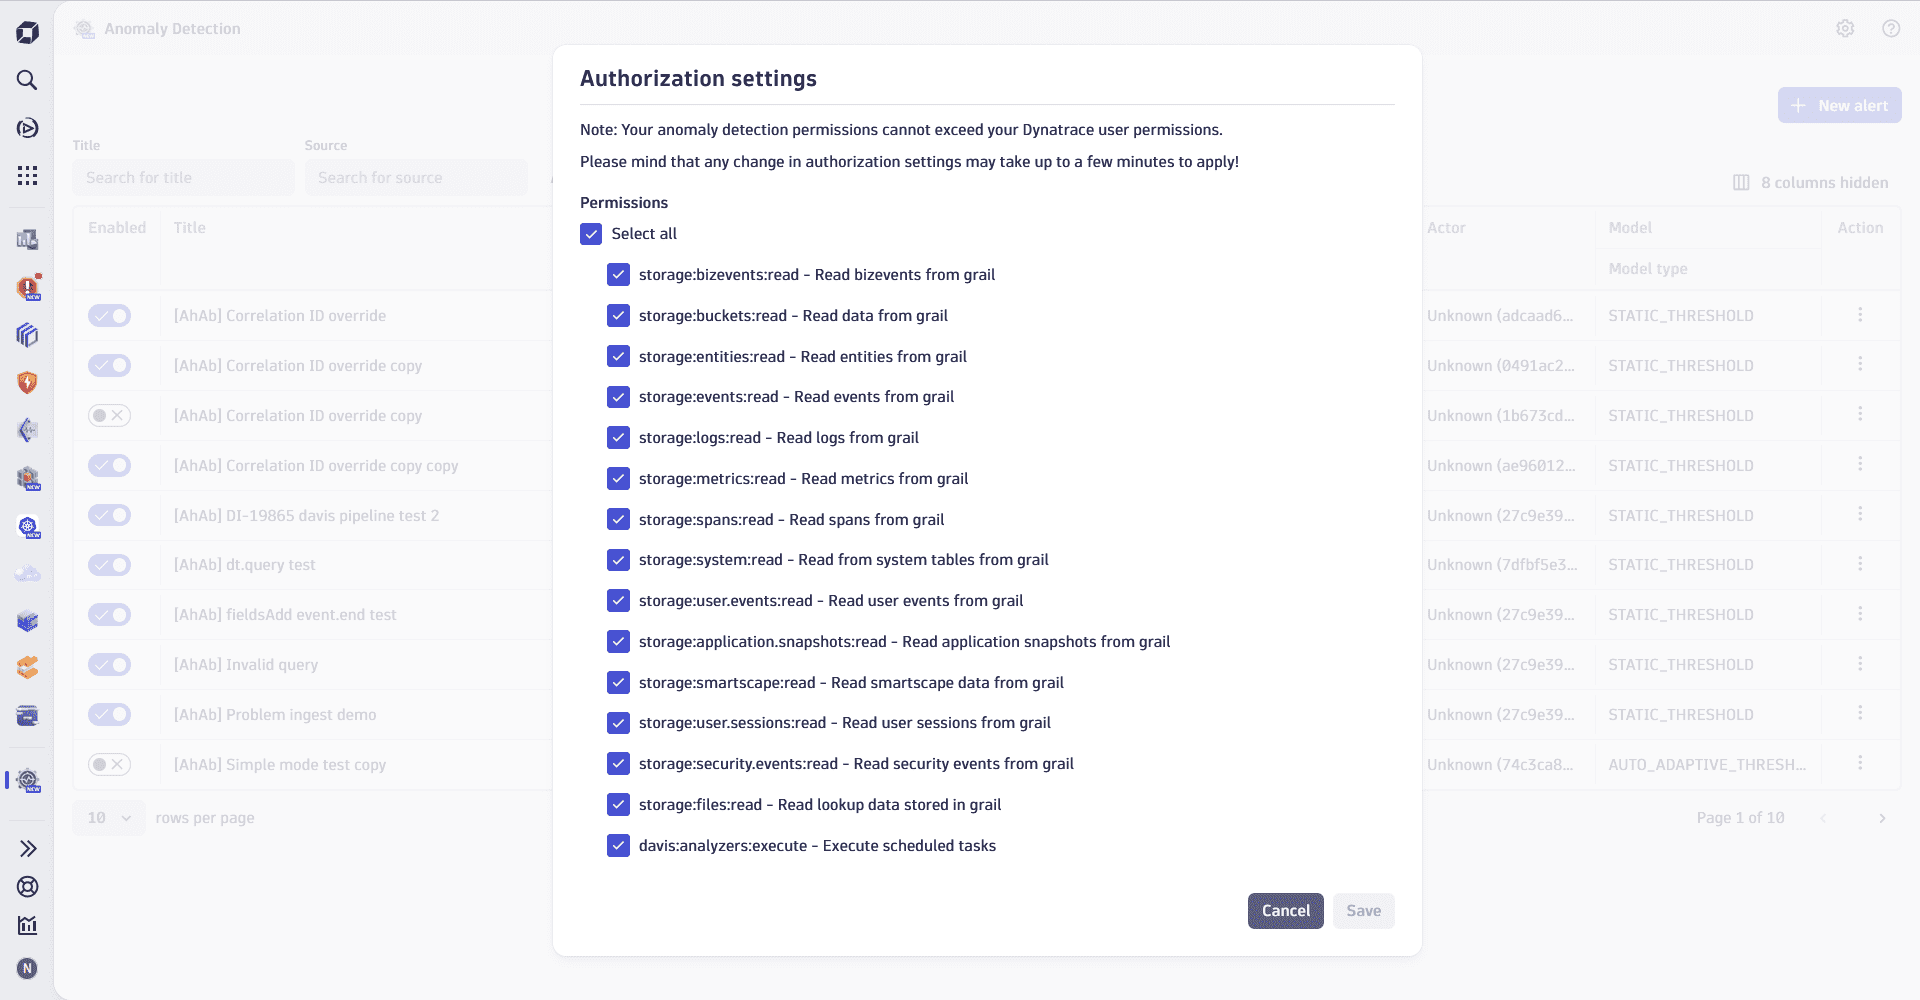 Anomaly Detection, an example of permission authorization settings
Choose metrics for upgrading
-
Go to
Anomaly Detection. -
Select
 Custom alert > Improve metric events with DQL to fetch all available metric events. Only metric selectors are available to transform.
 -
Select the metric events you want to transform and select Transform.
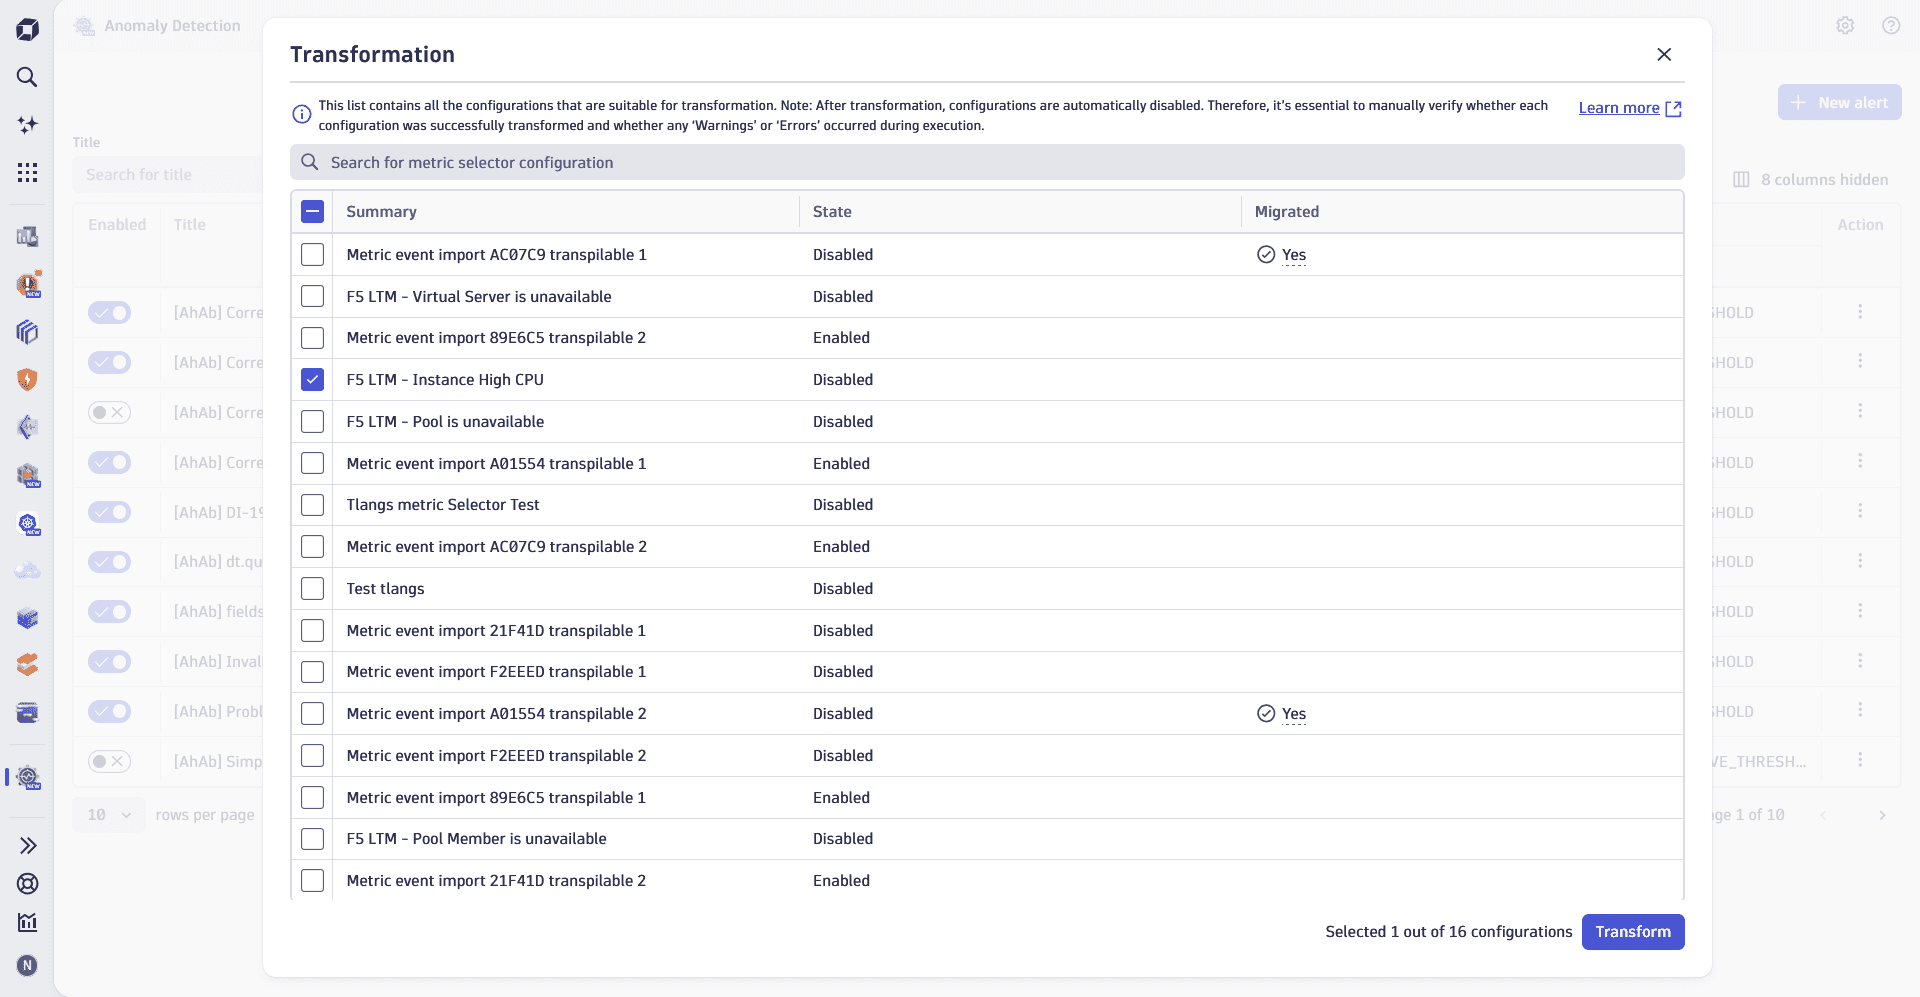 An example of a metric transformation pop-in in Anomaly Detection
You can only transform metric selectors.
Transformation
The metric event we selected for transformations is automatically disabled, and the newly created configuration is active instead.
If everything is fine, a successful notification appears in the lower-right corner of the screen.
Verify that everything works as expected
After the transformation is done, the app checks whether the created query meets the requirements of the configuration. However, this is not guaranteed, as, for example, the check can't detect whether the data from the metric is available or the necessary tags are present.
You therefore need to manually check after the transformation:
-
Go to
Anomaly Detection. -
Select
 >
>  Open with and select View and execute Grail query without leaving the app to check whether the metric is working as expected.
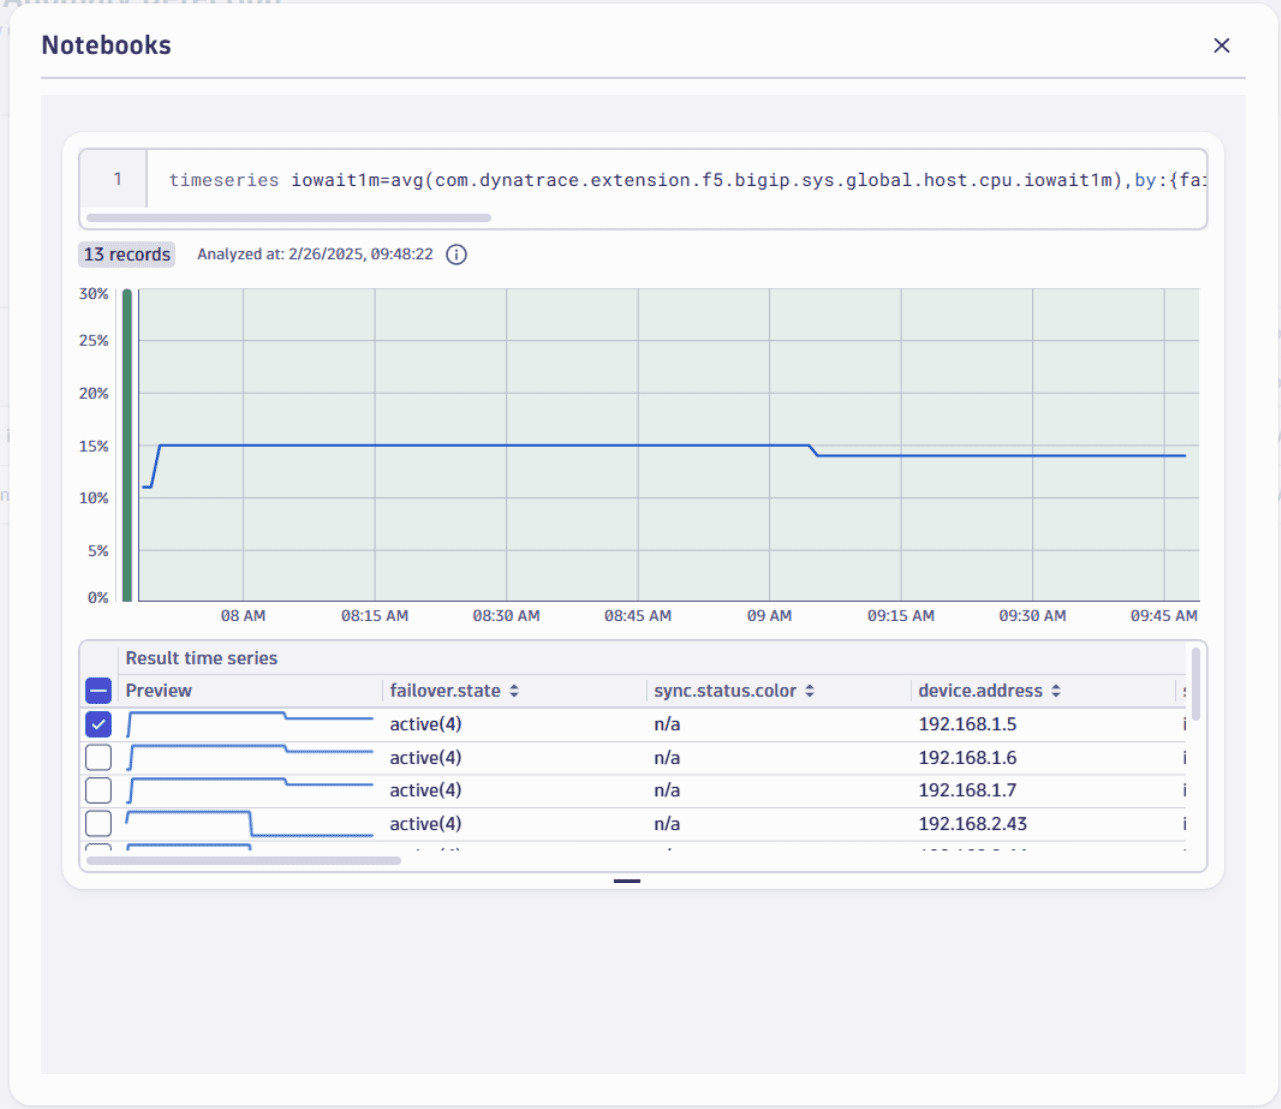 View and execute Grail query without leaving the app
Congratulations! You have just transformed your first Dynatrace classic metric event!
The next time you access the Transformation page in Anomaly Detection, you'll see that the transformed metric event has changed its State to Disabled, and its Migrated status to  Yes.
Yes.
Related topics
Anomaly Detection