Metric key events
- Dynatrace Classic
- How-to guide
- 4-min read
Metric key events are based on incoming raw measurements of a single metric. For this event type, only the static threshold monitoring strategy is available. You can monitor all metric dimensions within one configuration (for example, it is possible to create an alert for 20,000 CPUs in a single metric event configuration). As a safeguard, Dynatrace throttles these configurations with a limit of 200 simultaneous alerts. You can narrow down the scope of the event to particular dimensions.
Additionally, the limit of 10,000 configurations (both metric key and metric selector) per environment applies.
Scope of metric key events
Many Dynatrace metrics are delivered by multiple entities; the count can easily reach thousands. You likely don't need your event to cover all these entities simultaneously. To narrow down the scope of the event, you can specify some rule-based filters.
Two types of filters are available:
- Entity filters narrow the scope based on the provided criteria (for example, entity name or tag). The actual set of available criteria depends on the metric. If multiple filters are specified, the AND logic applies.
- Dimension filters filter out entities based on provided tuples (unique combinations of metric—dimension key—dimension value). If multiple filters are specified, the AND logic applies. For example, you can set a dimension filter that selects only user actions coming from iOS devices for your metric event based on the Action count metric.
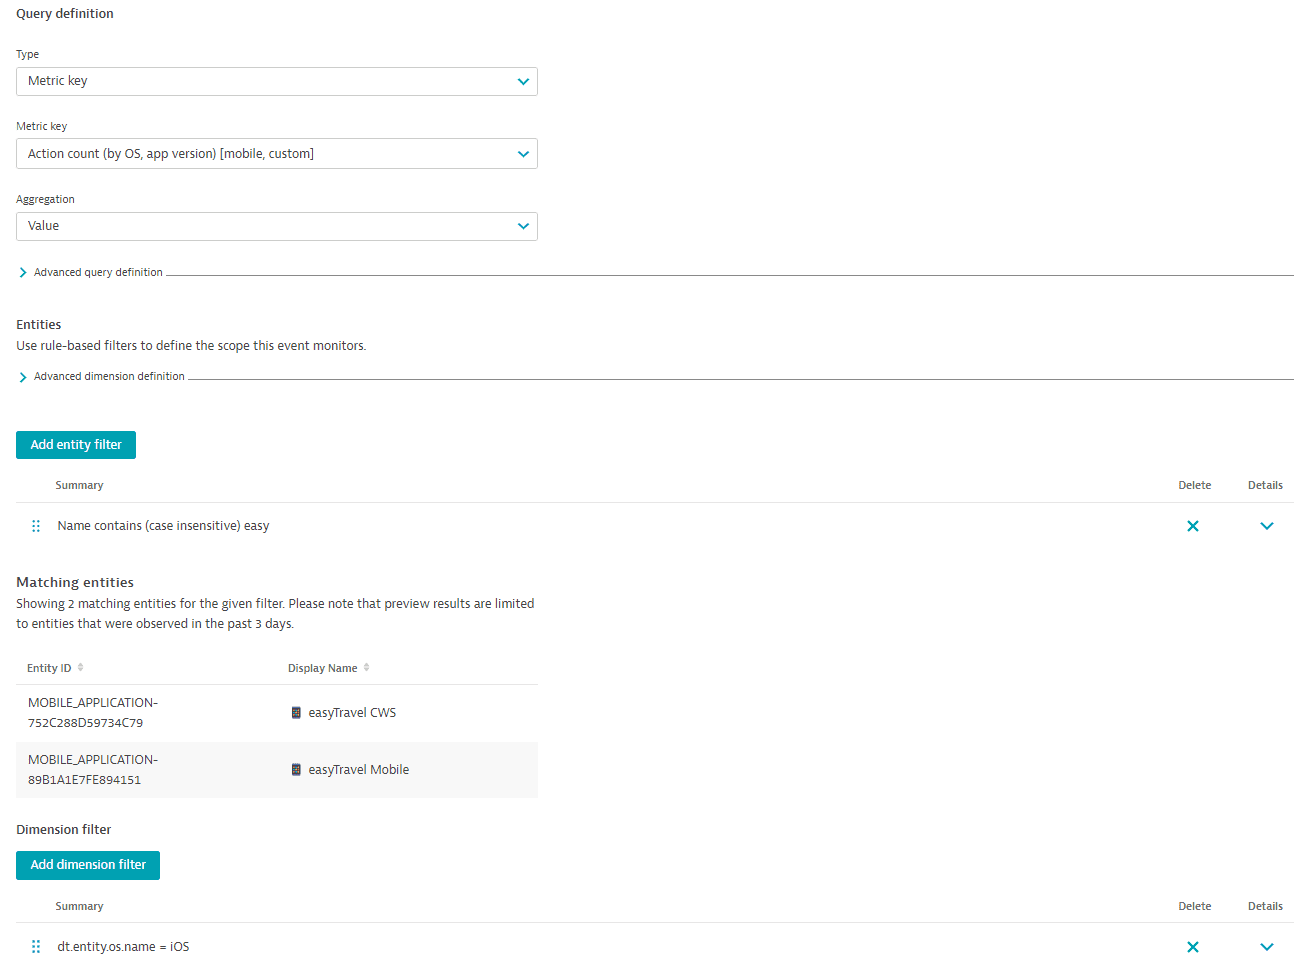
Create a metric key event
-
Go to Settings > Anomaly Detection > Metric events and select Add metric event.
-
In the Summary field, provide a short meaningful description of the event.
-
In the Query definition section, configure the metric query:
- Select the Metric key type of the query.
- Select the metric for your metric event. You can provide the key or the display name of a metric. Start typing to see the list of suggestions.
- Select a type of aggregation for the metric (where applicable).
- Select a management zone. Only data coming from this zone is evaluated for the metric event. Omit this field to use all the data provided by the metric.
-
Optional In the Advanced query definition section, specify the query's offset (in minutes).
You need the offset for metrics with latency; otherwise, the metric event might produce false alerts. -
Optional Add rule-based entity filters.
-
Optional Select the dimensions to be considered by the event.
-
Define the monitoring strategy. For metric key queries, only static thresholds are available.
- Specify the threshold value. Select Use suggested threshold to use a value based on the previous data.
- If applicable, select the threshold unit.
- Select the alert condition: alert if the metric is above or below the threshold.
Alerting on missing data is not supported for metric key events. If you want to alert on missing data, select a metric selector event instead.
- Optional In the Advanced model properties section, configure the evaluation window:
- Violating samples: The number of one-minute samples within the evaluation window that must violate the threshold to trigger an event.
- Sliding window: The number of one-minute samples that form the sliding evaluation window. You can set a sliding window of up to 60 samples.
- Dealerting samples: The number of one-minute samples within the evaluation window that must return to normal to close the event.
-
Check the preview for your alert and evaluate how effective your configuration is.
- Select the dimension values that you want to see on the preview.
- Select the timeframe of the preview. You can receive alerts for one, three, or seven days.
-
Provide a title for your event. The title should be a short, easy-to-read string describing the situation, such as
High network activityorCPU saturation. -
In the Description section, create a meaningful event message. Event messages help you understand the nature of the event. You can use the following placeholders:
{alert_condition}—the condition of the alert (above/below the threshold).{baseline}—the violated value of the baseline.{dims}—a list of all dimensions (and their values) of the metric that violated the threshold. You can also specify a particular dimension:{dims:dt.entity.<entity>}. To fetch the list of available dimensions for your metric, query it via the GET metric descriptor request.{entityname}—the name of the affected entity.{metricname}—the name of the metric that violated the threshold.{missing_data_samples}—the number of samples with missing data. Only available if missing data alert is enabled.{missing_data_samples}in the event descriptionWe recommend including the
{missing_data_samples}placeholder in the event description to see whether the problem is raised due to missing data samples or threshold violations.{severity}—the severity of the event.{threshold}—the violated value of the threshold.
-
Select the type for triggered events.
-
Define the merge strategy for triggered events.
If the merge is allowed, Davis® AI will try to merge this event into existing problems; otherwise, a new problem is raised each time. -
Optional Set additional key-value properties to be attached to the event.
-
Select Save changes.