Examples of anomaly detection on Grail
- Latest Dynatrace
- Tutorial
- 3-min read
These examples show how to use DQL to transform data from Grail into time series or match data records and use them as an input for anomaly detection analyzers.
Timeseries data type
You can use DQL to transform data into timeseries to use them as an input for detecting threshold and pattern violations. To learn more, see Timeseries data type.
Detect anomalies in seasonal time series
Suppose you want to use anomaly detection to receive alerts on abnormal network load.
An auto-adaptive or static threshold will do the job when your normal load is homogenous, but what if there's seasonality in the normal behavior?
- A static threshold would generate false positives on spikes.
- A dynamic threshold might miss an anomaly in the lower end of the wave because it adapted to the spike.
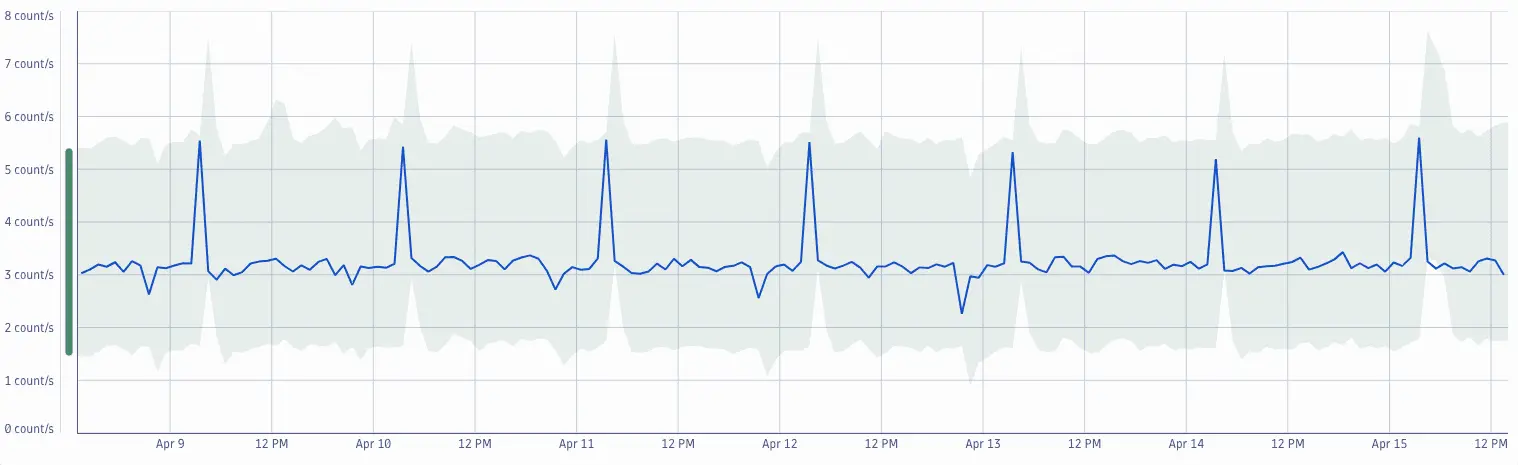
This is where a seasonal baseline comes in handy, as it adapts the baseline according to the seasonality of your data.
In this example, Dynatrace Intelligence built a baseline for the average network load with a seasonal pattern. We used this DQL query to obtain the data:
timeseries avg(dt.process.network.load)
Identify anomalies in number of events or problems
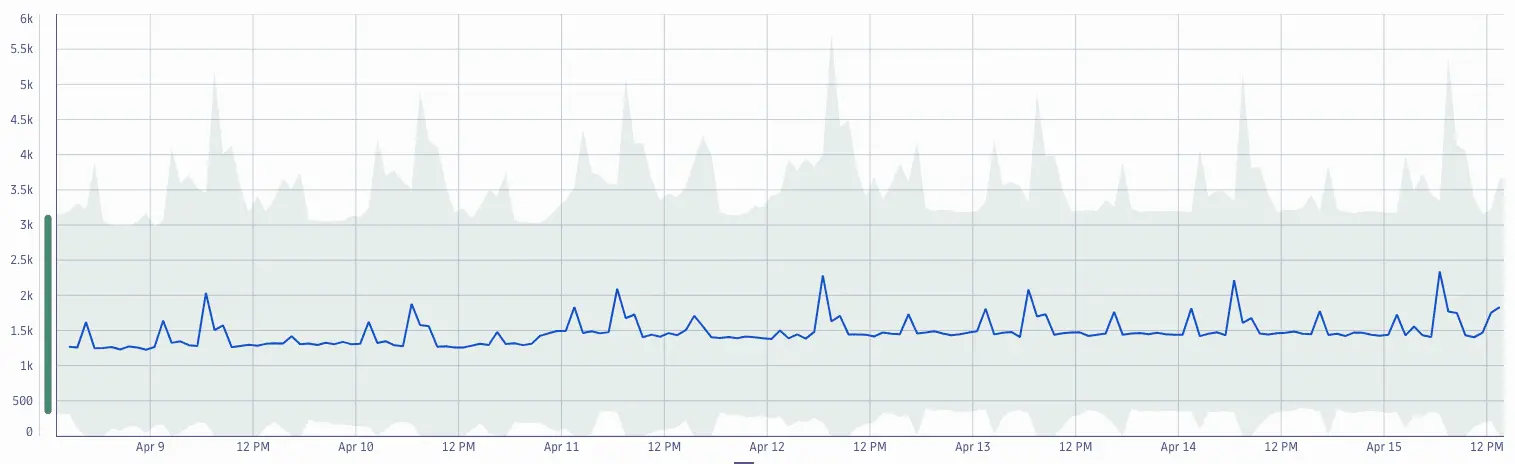
Sometimes it's important to understand if the number of detected events or problems is aligned with our expectations. DQL allows you to transform any set measurements into a time series that you can use as input for anomaly detection.
In this example, DQL creates a time series from the count of events and feeds it into the anomaly detection analyzer.
fetch events| filter event.kind == "DAVIS_EVENT"| makeTimeseries count(), time:{timestamp}
Detect anomalies within a log pattern
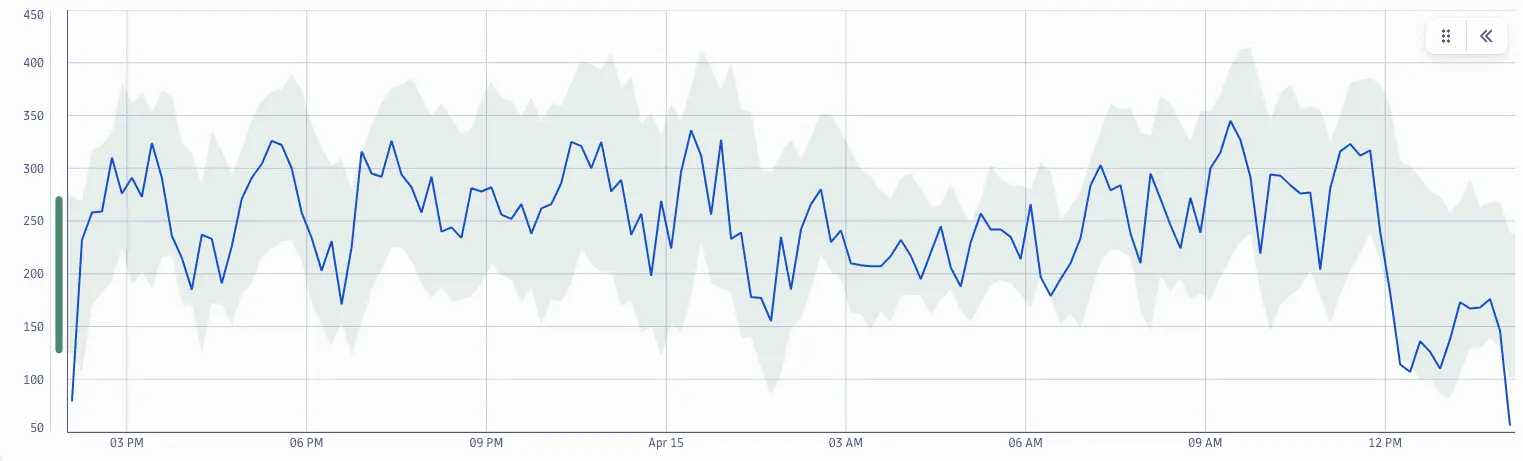
Logs that your systems produce contain valuable information, for example, critical crash information or the count of failed login attempts. With logs stored in Grail, DQL allows you to extract records into time series by pattern.
In this example, DQL creates a time series from a count of No journey found log patter occurrences and feeds it into the anomaly detection analyzer.
fetch logs| filter contains(content, "No journey found")| makeTimeseries count(), time:{timestamp}
Remove extreme outliers from training data
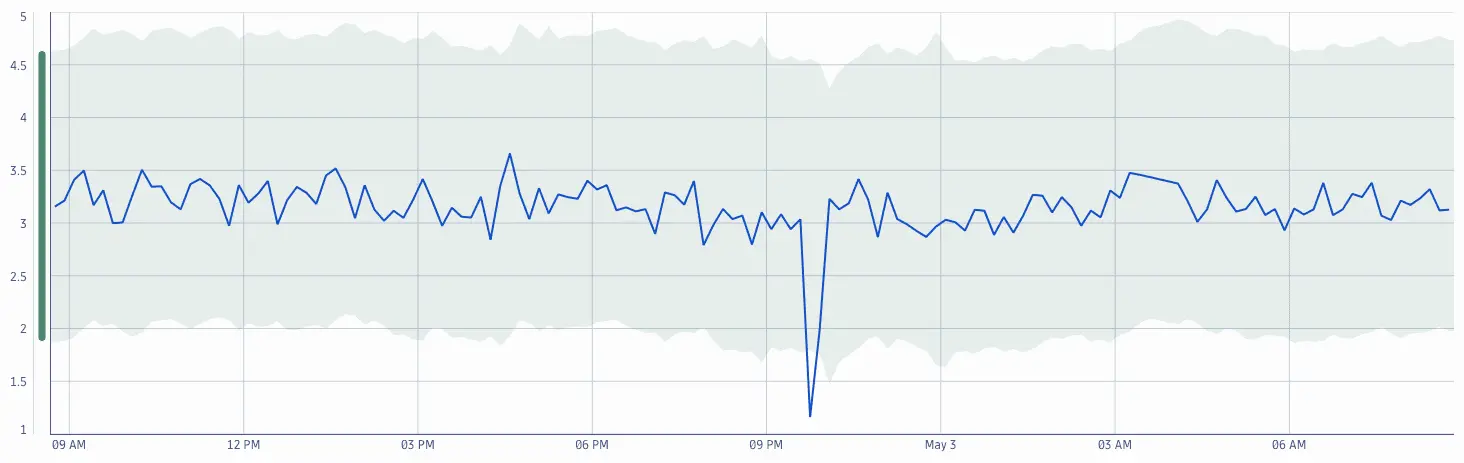
Dynatrace Intelligence automatically removes outliers from training data to ensure a stable run of the algorithm. Large segments of outliers, however, cannot to be removed automatically. For data sets with significant outliers, DQL allows you to sanitize the data before feeding it into the anomaly detection analyzer.
timeseries load = avg(dt.process.network.load)| fieldsAdd load_cleaned = iCollectArray(if(load[] < 4, load[]))| fieldsRemove load
Detect anomalies from different timeseries
By using DQL, you can detect anomalies from different time series regardless of their origin, whether they have been generated from events, business events, logs, or other sources.
The following example creates a time series based on a defined if condition that joins two different timeseries.
timeseries cpu=max(dt.host.cpu.usage), by:{dt.source_entity},interval:1m| join [timeseries memory=max(dt.host.memory.usage)],on:{interval}, fields:memory| fieldsAdd condition=if(cpu[] > 90 and memory[] > 40, 1, else: 0 )| fields dt.source_entity,timeframe,interval,condition
Records data type
You can use DQL to sort records data by a set of filters and use matched results for detecting anomalies. To learn more, see Records data type.
If you don't define a timeframe in the query (for example, from: -48h), the default 2-hour timeframe (from: -2h) is used.
Track your business orders
Using Dynatrace, you can keep track of your business orders and plan restocks in a timely manner. You can identify top markets and demand trends by checking the number of orders per country, which allows you to prepare in advance and ensure that your supplies are always stocked up.
timeseries order = sum(bizevents.astroshop.order.count, default: 0), by:{shippingAddressCountry}, from: -7d| fieldsAdd total_orders = arraySum(order)| filter total_orders > 5000
Missing backups
Some failures don't result in errors, spikes, or exceptions—instead, the expected activity simply stops. For example, suppose you know a backup is done every 48 hours, but the exact moment of a backup isn't fixed in time. In this case, you might want to be alerted if no backup data is received for a period longer than 48 hours.
fetch events, from: -48h| filter event.name == "backup successful"| summarize events = count()| fieldsAdd has_backup_events = if(events > 1, "YES", else: "NO")| filter has_backup_events == "NO"
 Anomaly Detection