Metric selector events
- Dynatrace Classic
- How-to guide
- 4-min read
The metric selector is a powerful instrument for specifying which data you want to read for the metric event evaluation. It provides you with two major possibilities:
- Metric transformations for transforming the data you're reading.
- Metric expressions for combining one or more metrics into a different result using simple mathematics.
With the metric selector, Davis can access the historic data of the metric and can learn the normal behavior of your environment, enabling you to use auto-adaptive thresholds in your metric event. However, some limitations apply:
- 100,000 monitored metric dimensions per environment
- 10,000 metric events configurations (both metric key and metric selector) per environment
- 1,000 monitored dimensions per metric event configuration (static or auto-adaptive threshold)
- 500 monitored dimensions per metric event configuration (seasonal baseline)
- 100 metric selectors per monitoring strategy. You can have 100 configurations with an auto-adaptive threshold and 100 with a static threshold.
Scope of metric selector events
The selector itself defines the scope of a metric selector event. It is important to understand the implications when configuring a selector consisting of measurements from thousands of individual sources. Dynatrace applies safety limits to anomaly detection in terms of the number of metric dimensions that can be observed within one monitoring environment to avoid any operational issues. To learn how to narrow down the scope of your configuration, see Filter transformation.
Combining metrics
With the power of a metric expression, you can implement alerting with a top-down view of a situation rather than alerting on each component.
For example, you can observe log patterns across multiple hosts. By calculating the total count of observed log patterns across all relevant log files, Dynatrace can detect pattern anomalies on the accumulated log stream rather than on the individual counts per log file. If there are sparse counts across many entities (for example, an error count across multiple processes of the same type), aggregated top-down anomaly detection is much more resilient against false-positive alerts than detection on an individual error count per process.
Create a metric selector event
-
Go to Settings > Anomaly Detection > Metric events and select Add metric event.
-
In the Summary field, provide a short meaningful description of the event.
-
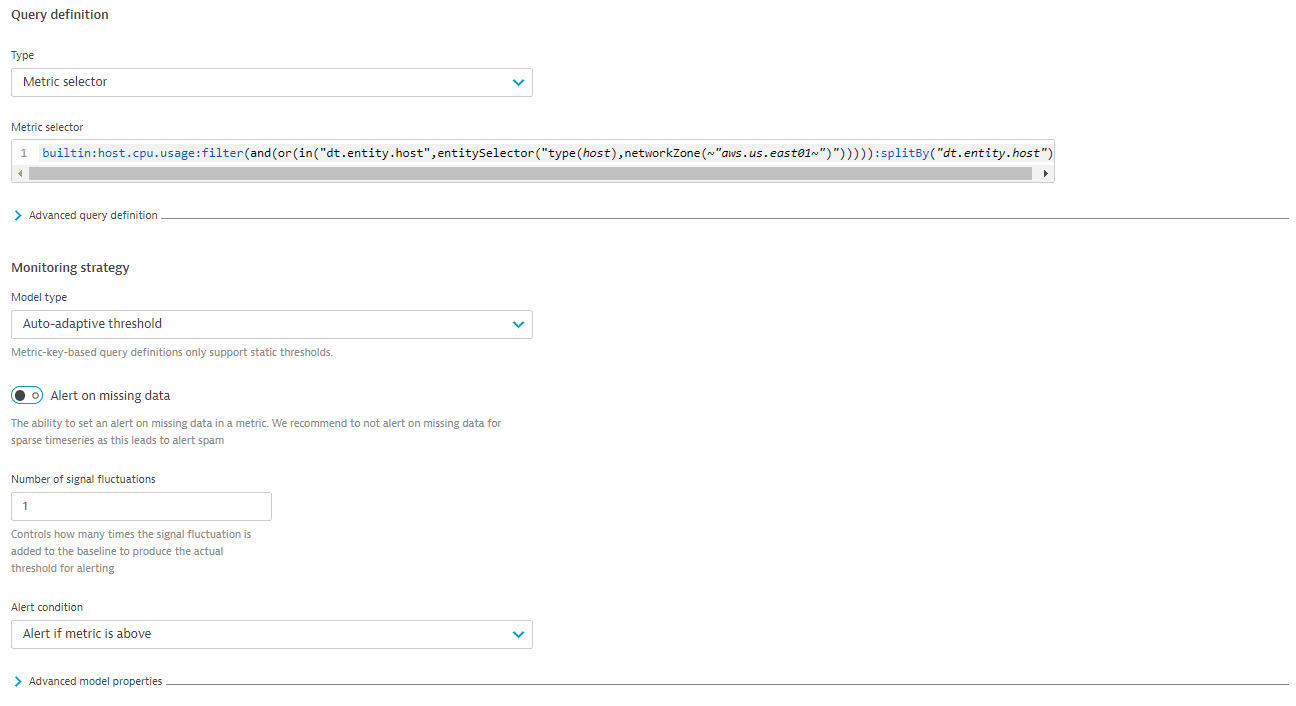
In the Query definition section, configure the metric query:
- Select the Metric selector type of the query.
- Specify the required metric selector.
-
Select a management zone. Only data coming from this zone is evaluated for the metric event. Omit this field to use all the data queried by the metric selector.
-
Optional In the Advanced query definition section, specify the query's offset (in minutes).
You need the offset for metrics with latency; otherwise, the metric event might produce false alerts. -
Define the monitoring strategy
- Choose the model type:
- Auto-adaptive threshold—Dynatrace calculates the threshold automatically and adapts it dynamically to your metric's behavior.
- Static threshold—the threshold that doesn't change over time.
- Seasonal Baseline—Dynatrace creates a confidence band on a metric with seasonal patterns
- For the static threshold, specify the threshold. Select Use suggested threshold to use a value based on the previous data.
- Choose the missing data alert behavior.
If the missing data alert is enabled, it is combined with the threshold condition by the OR logic. - Select the alert condition: alert if the metric is above, below, or outside of the threshold.
- Optional In the Advanced model properties section, specify a sliding window for comparison.
The sliding window defines how often the threshold—whether it is automatically calculated or manually specified—must be violated within a sliding window of time to raise an event (violations don't have to be successive). This helps you to avoid overly aggressive alerting on single violations. You can set a sliding window of up to 60 minutes.
- Choose the model type:
-
Check the preview for your alert and evaluate the effectiveness of your configuration.
- Select the dimension values that you want to see on the preview.
- Select the timeframe of the preview. You can receive alerts for one, three, or seven days.
-
Provide a Title for your event. The title should be a short, easy-to-read string describing the situation, such as
High network activityorCPU saturation. -
In the Description section, create a meaningful event message. Event messages help you understand the nature of the event. You can use the following placeholders:
{alert_condition}—the condition of the alert (above/below the threshold).{baseline}—the violated value of the baseline.{dims}—a list of all dimensions (and their values) of the metric that violated the threshold. You can also specify a particular dimension:{dims:dt.entity.<entity>}. To fetch the list of available dimensions for your metric, query it via the GET metric descriptor request.{entityname}—the name of the affected entity.{metricname}—the name of the metric that violated the threshold.{missing_data_samples}—the number of samples with missing data. Only available if missing data alert is enabled.{missing_data_samples}in the event descriptionWe recommend including the
{missing_data_samples}placeholder in the event description to see whether the problem is raised due to missing data samples or threshold violations.{severity}—the severity of the event.{threshold}—the violated value of the threshold.
-
Select the Event type for triggered events.
-
Turn Allow merge on or off to define the merge strategy for triggered events.
If Allow merge is turned on, Davis AI will try to merge this event into existing problems; if it's turned off, a new problem is raised each time. -
Optional Set additional key-value properties to be attached to the event.
-
Select Save changes.