Monitor suspicious sign-in activity with Dynatrace
- Latest Dynatrace
- Tutorial
As organizations embrace cloud technologies, monitoring sign-in logs is crucial for detecting anomalies, investigating suspicious activities, and ensuring regulatory compliance. Real-time visibility into login behavior helps rapidly address security risks, protect user identities, and safeguard critical resources. It also provides actionable insights into compromised accounts, malicious insiders, and user behavior patterns, aiding strategic decisions on access management, device policies, and application usage.
While the following scenario focuses on Microsoft Entra ID logs as an example, the described approach is universally applicable to any cloud, access, or identity provider integrated with Dynatrace. This is made possible through Semantic Dictionary and the standardized data mapping to the defined semantic model.
As long as sign-in logs from a supported identity provider are ingested into Dynatrace, you can follow the steps outlined below to monitor these logs effectively.
Target audience
Security administrators and security teams responsible for safeguarding their organization’s cloud environment and user activity.
Scenario
Your organization relies on Microsoft Entra ID as a centralized identity provider, granting users single-sign-on (SSO) access to various company applications and services. Microsoft Entra ID sign-in logs are forwarded to Dynatrace and stored in Grail to gain deeper visibility into user activity, creating a unified data hub for monitoring and analysis.
As a security administrator, your responsibility is to
-
Safeguard user identities belonging to your organization
-
Monitor user access and track patterns to spot unusual behavior quickly
-
Identify and investigate potential threats or anomalous sign-in events
-
Start incident response activities promptly to minimize damage if a user account gets compromised
Goals
-
Achieve comprehensive visibility over the cloud environment and user activity through a single pane of glass.
-
Demonstrate how to monitor Microsoft Entra ID sign-in logs and user activity to detect potential security issues and anomalous behaviors.
Prerequisites
-
Knowledge of Dynatrace Query Language and how to use DQL queries.
-
Send Microsoft Entra ID sign-in logs to Dynatrace. There are two options to stream logs:
-
Follow the instructions in Create a pipeline for processing to configure the OpenPipeline environment. Select Azure Entra ID Audit Logs as the built-in processor.
Get started
1. Import dashboard
Use our sample dashboard to view user sign-in activities within your cloud environments.
-
Download the sample dashboard from GitHub.
-
Open
 Dashboards, select
  Upload, then select the downloaded file.
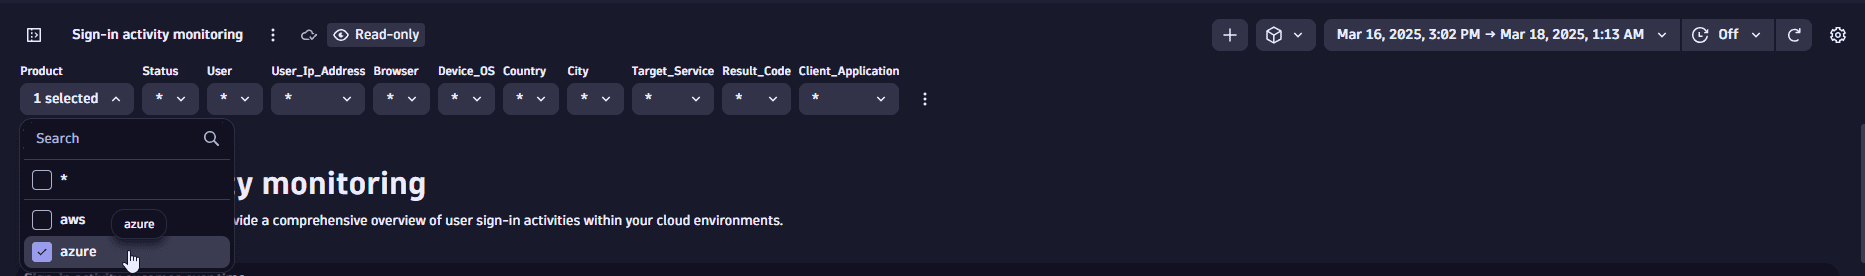
2. Set up filters
-
In Product, filter for
Azureto display Microsoft Entra ID sign-in logs coming from the connected Azure environment. -
Use the timeframe selector to narrow down your investigation to relevant incidents, identify trends or anomalies within that window, and efficiently monitor user activities or suspicious behavior during critical times.
 filtering
 -
To fine-tune your investigation, consider setting up additional filters. For example:
-
User, to analyze individual sign-in trends, devices, and locations for specific users, helping you to identify unusual access patterns or targeted attacks.
-
User IP address, to investigate activities from particular IP addresses, detecting repeated failed sign-ins or unusual access origins.
-
Device OS, to track the operating systems used during sign-ins, helping you to spot outdated or unauthorized devices.
-
Country, to examine sign-ins by geographic location to detect access from unexpected or restricted regions.
-
Target service, to identify which services or applications are being accessed, useful for monitoring sensitive resources.
-
Result code, to review the outcomes of sign-in attempts to detect anomalies, such as excessive failed attempts indicating potential brute-force attacks.
-
Client application, to determine which applications are being used to sign in, useful for identifying unauthorized or suspicious app usage.
-
3. Review activity and trends
In the Sign-in activity monitoring section, you can
- Analyze sign-in trends
- Identify peak activity periods
- Investigate access patterns by location or IP address
This enables you to gain a clear understanding of user distribution and quickly spot irregular activities from unexpected regions, helping you enhance security and respond to potential risks effectively.
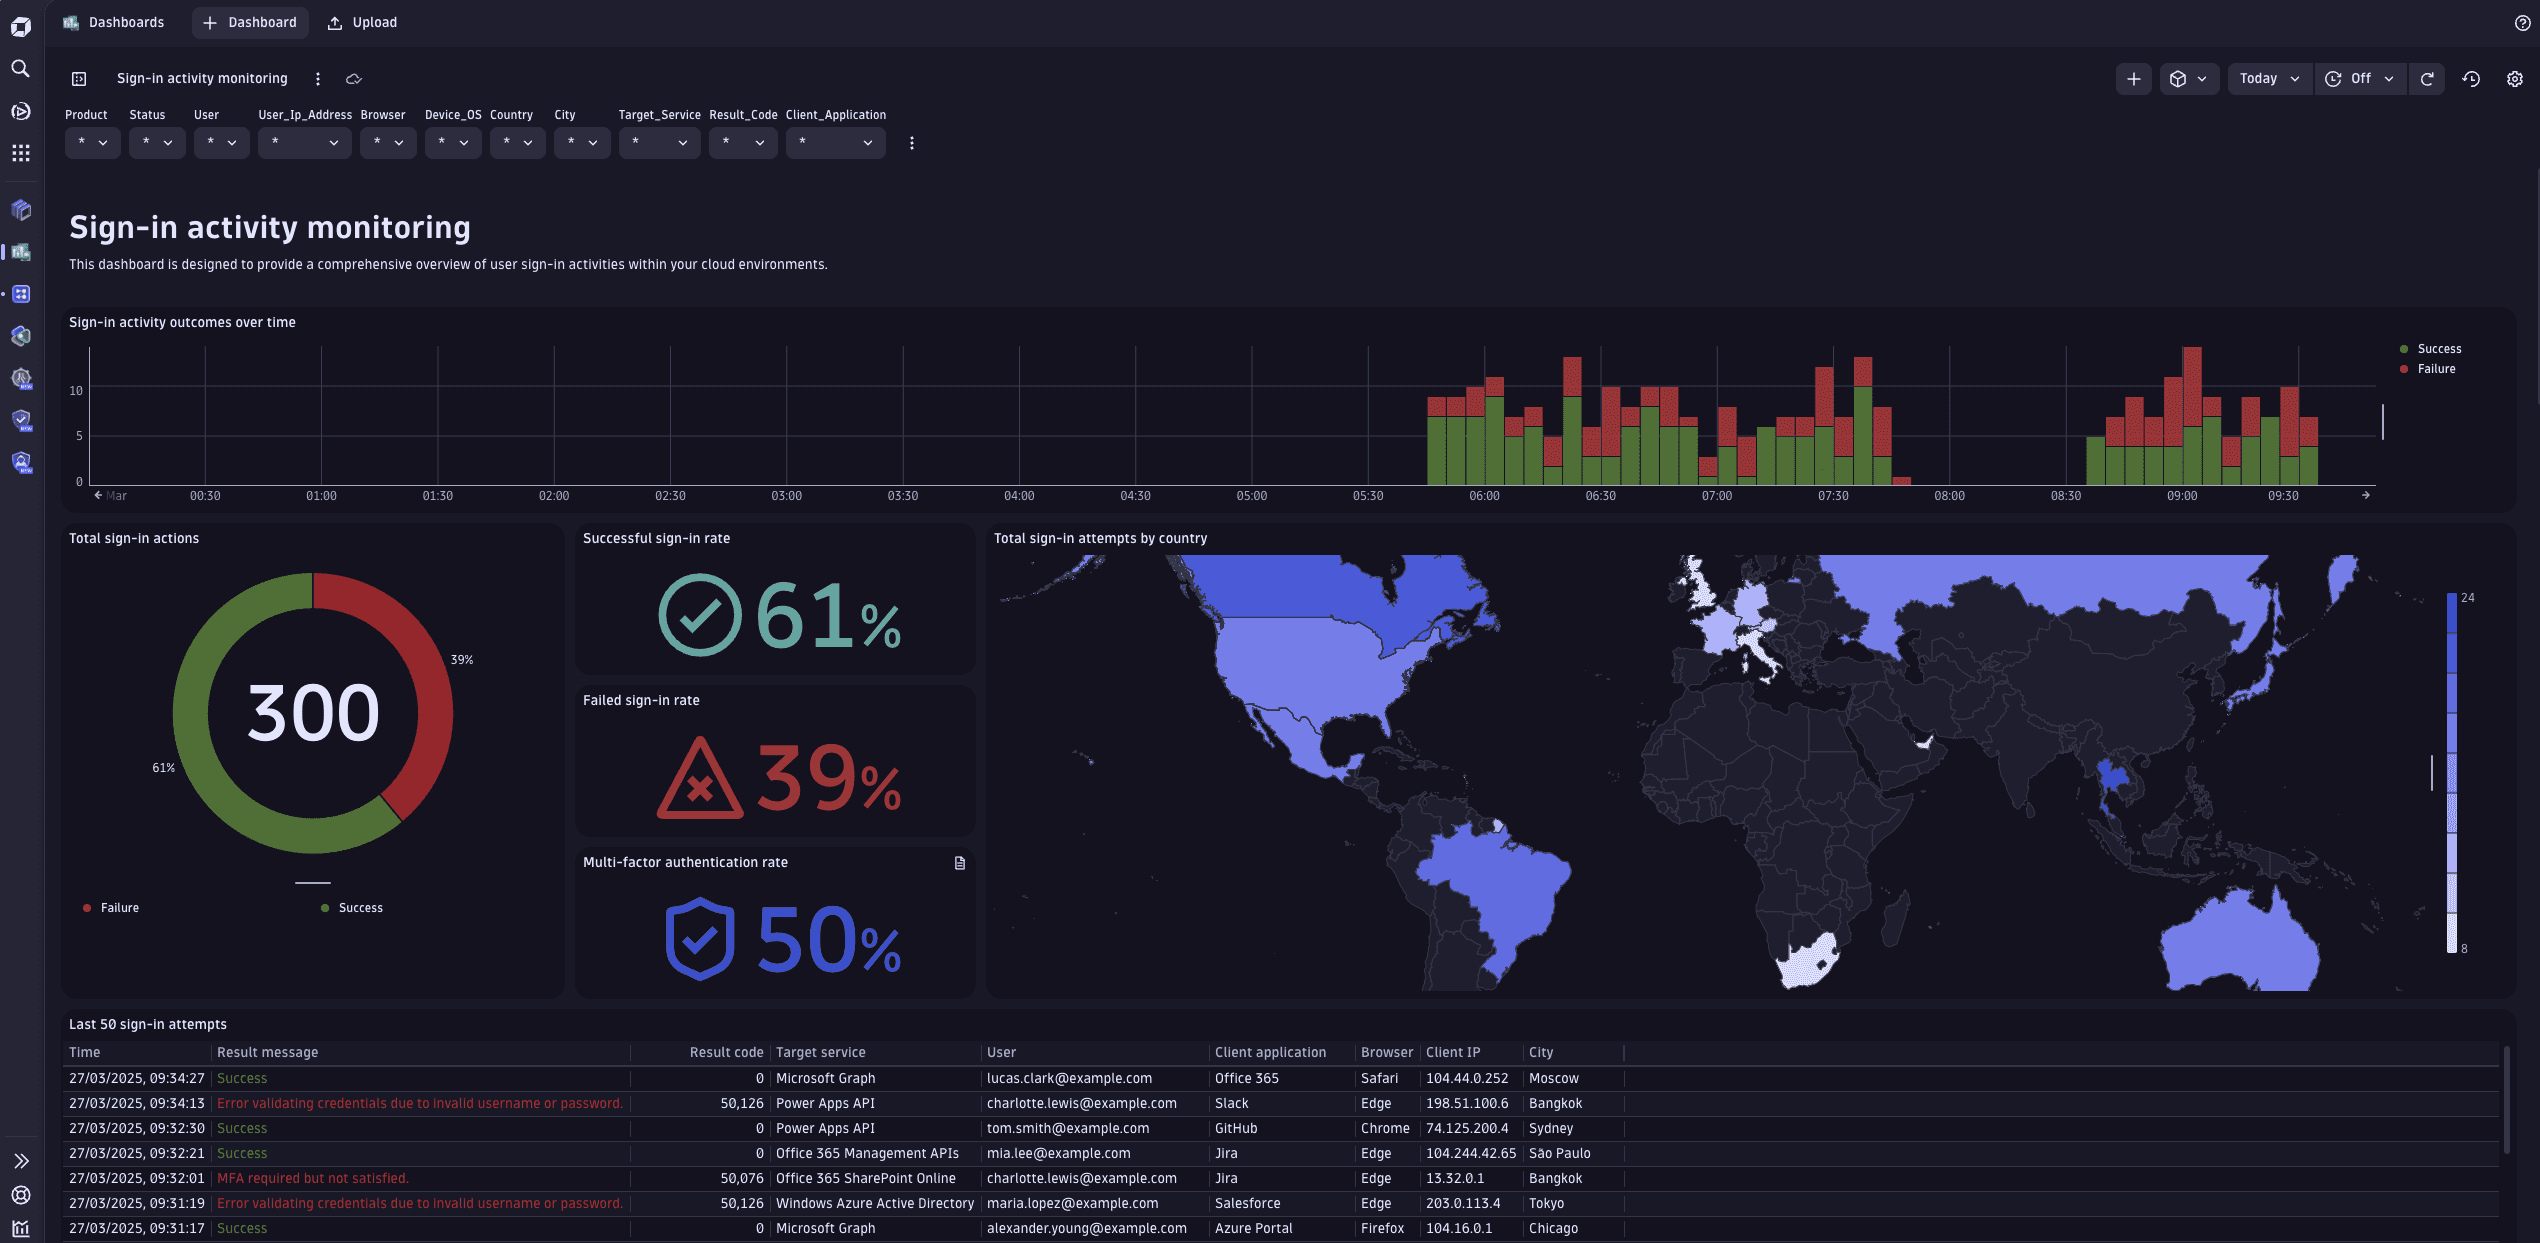
You can reproduce the Sign-in activity outcomes over time chart in  Investigations or
  Notebooks with the following DQL snippet:
fetch logs| filter isNotNull(audit.action) and isNotNull(authentication.is_multifactor)| makeTimeseries {Success = countIf(audit.result=="Succeeded", default:0),Failure = countIf(audit.result!="Succeeded", default:0)}, time:audit.time
4. Drill down
In the Top sign-in activity breakdown section, you can explore detailed insights into user and IP-based sign-in activities.
Example 1: In Top 10 sign-in users, you can identify
- Anomalies such as account lockouts or potential brute-force attacks
- Users with the highest number of sign-in attempts, categorized by successful and failed attempts
- Users with the most failed attempts, with associated IP addresses and client applications
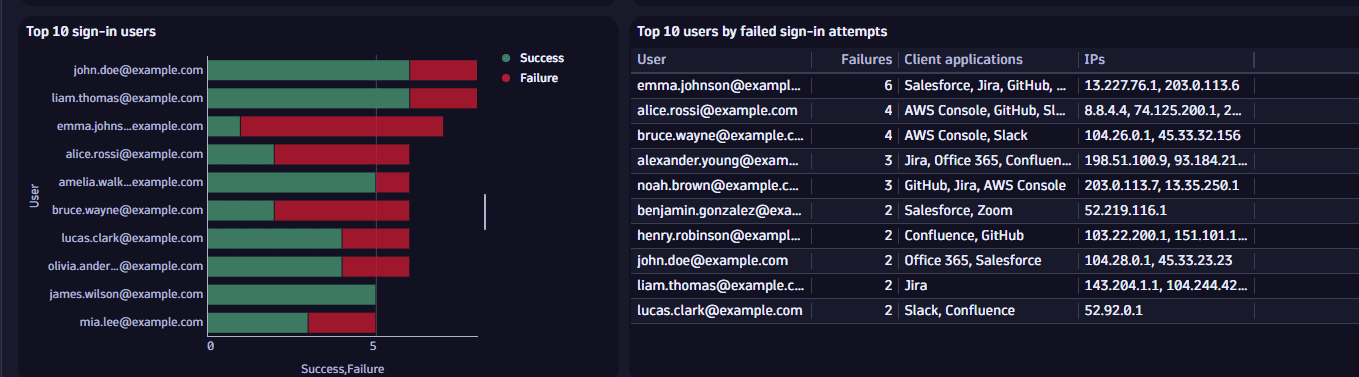
You can reproduce the Top 10 sign-in users chart in Investigations or Notebooks with the following DQL snippet:
fetch logs| filter isNotNull(audit.action) and isNotNull(authentication.is_multifactor)| summarize {Success = countIf(audit.result=="Succeeded" or isNull(result.code)),Failure = countIf(audit.result!="Succeeded", by:{User=audit.identity}| sort Success+Failure desc| limit 10
Example 2: In Top 10 sign-in IPs, you can
- Uncover unusual patterns which may indicate malicious activity, such as repeated failed attempts from a single IP or multiple users accessing from the same IP
- View rankings of IP addresses with the most sign-in attempts, along with those linked to multiple users or services
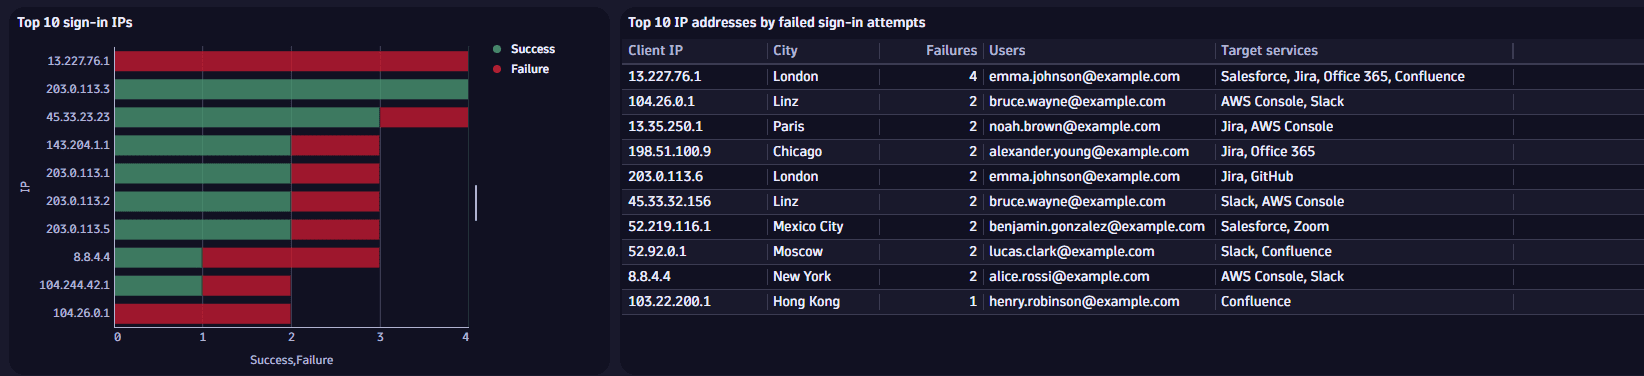
You can reproduce the Top 10 sign-in IPs chart in Investigations or Notebooks with the following DQL snippet:
fetch logs| filter isNotNull(audit.action) and isNotNull(authentication.is_multifactor)| summarize {Success = countIf(audit.result=="Succeeded" or isNull(result.code)),Failure = countIf(audit.result!="Succeeded")}, by:{IP=client.ip}| sort Success+Failure desc| limit 10
5. Analyze data
Dynatrace Intelligence automatically identifies anomalous trends and deviations in sign-in logs, significantly enhancing your organization's ability to detect potential threats swiftly. Dynatrace Intelligence continuously analyzes user sign-in patterns, providing proactive alerts when anomalies are detected.
To detect anomalous peaks within the observed sign-in logs with Dynatrace Intelligence
-
Select any of the time-based charts, then select Open with.
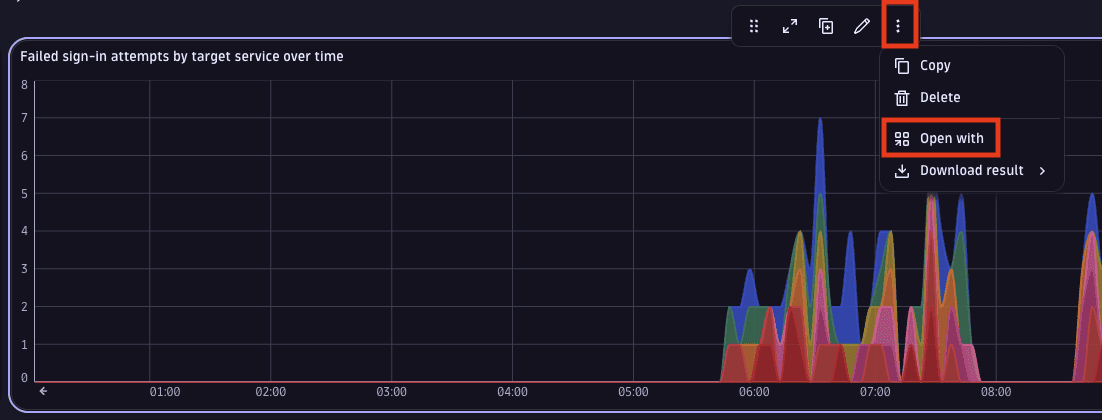 open-with
 -
Select Notebooks.
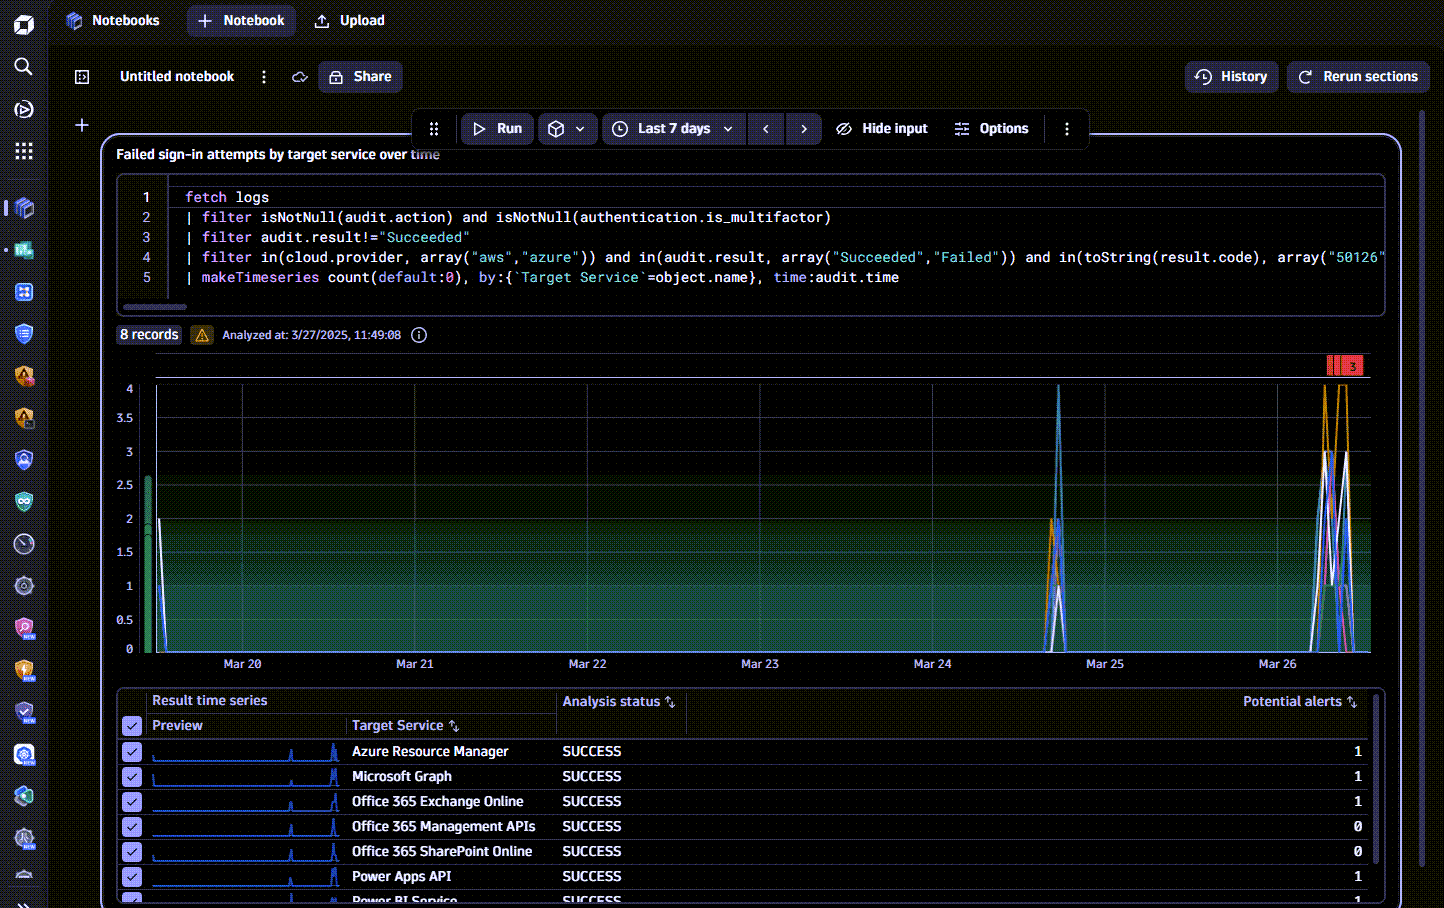
-
In the notebook document that opens, select Options.
-
In the Options panel, select Analyze and alert and activate the analyzer.
-
Select an analyzer and configure its parameters.
-
Select Run analysis.
For example, you can select an auto-adaptive threshold to apply a dynamic approach based on the past sign-in trends.
Summary
Monitoring sign-in activities in cloud environments is essential for detecting anomalies, protecting critical resources, and ensuring compliance. Integrating sign-in logs into the Dynatrace platform centralizes visibility into user access patterns. By analyzing metrics like top users, IP addresses, client applications, and locations, security teams can swiftly identify suspicious behavior and address potential threats. The dashboard’s filtering options allow targeted investigations, enhancing threat detection and accelerating incident response.
 OpenPipeline