Process logs with technology bundle parsers
- Latest Dynatrace
- Tutorial
- 3-min read
OpenPipeline offers pre-defined technology bundles. These are libraries of parsers (processing rules), to structure technology-specific logs according to the Dynatrace Semantic Dictionary. The parser library supports a broad range of technologies—including well-known data formats, popular third-party services, and cloud providers—such as, AWS Lambda, Python, Cassandra, and Apache Tomcat.
Parsers help you to improve filtering, troubleshooting, metrics, alerts, and dashboards by efficiently extracting log levels and relevant attributes. You can also use technology bundles to structure logs from technologies that are not supported by Dynatrace out of the box.
Who this is for
This article is intended for administrators and app users.
What you will learn
In this article, you will learn how to parse logs with technology bundle in OpenPipeline and analyze them in Notebooks.
Before you begin
Prerequisites
- Latest Dynatrace environment
- License Dynatrace license with Log Analytics overview (DPS) capabilities
Steps
1. Create a pipeline for processing
- Go to
 Settings > Process and contextualize > OpenPipeline: > Logs > Pipelines.
 - To create a new pipeline, select Pipeline and enter a name—for example,
Syslog - Pipeline. - To configure processing, go to Processing > Processor > Technology bundle and choose the necessary bundle. For example, the Syslog bundle.
You can add multiple technology bundles on one pipeline, so you don't have to create a pipeline and a dynamic routing each time.
- Copy the technology matching condition.
You can customize the technology matching condition to match your needs through OpenPipeline. See Configure a processing pipeline.
- Select Save.
You successfully configured a new pipeline with a processor to structure syslog logs according to pre-defined rules that match Dynatrace Semantic Dictionary. The new pipeline is in the pipeline list.
2. Route data to the pipeline
-
Go to
Settings > Process and contextualize > OpenPipeline: > Logs > Dynamic routing. -
To create a new route, select Dynamic route and enter:
- A descriptive name—for example,
Syslog - The matching condition you copied. This matching condition is customizable. For example, you can set it as
trueand all logs will go through that pipeline, if it's well positioned on the list. - The pipeline containing the processing instructions (
Syslog - Pipeline)
- A descriptive name—for example,
-
Select Add.
-
Make sure to place the new route in the correct position on the list. Routes are evaluated from top to bottom. Data is dynamically routed into a pipeline according to the first applicable matching condition. Routed data is not evaluated against any subsequent conditions.
-
Select Save.
You successfully configured a new route. All syslog logs are routed to the pipeline for processing. The new route is in the route list.
To learn more about dynamic routing, see Route data.
3. Analyze structured logs
Once logs are processed according to the technology bundle, several attributes are extracted from the log content into new fields that match Dynatrace Semantic Dictionary. On top of that, technology bundles extract other attributes from logs so you can build your own Custom alerts, Metrics, and Dashboards.
Using parsers helps you to better structure and enrich your logs. See this comparison:
Without parsing
{"dt.openpipeline.source": "extension:syslog","content": "<24>1 2025-08-06T14:50:30.123Z core-router-01.example.com kernel 9999 ID01 Critical system failure: Kernel panic detected, immediate attention required!"}
With parsing
{"syslog.severity": 0,"syslog.version": 1,"syslog.priority": 24,"syslog.facility": 3,"syslog.message": "Critical system failure: Kernel panic detected, immediate attention required!","content": "<24>1 2025-08-06T14:50:30.123Z core-router-01.example.com kernel 9999 ID01 Critical system failure: Kernel panic detected, immediate attention required!","syslog.proc_id": "9999","dt.openpipeline.source": "extension:syslog","loglevel": "EMERGENCY","syslog.message_id": "ID01","syslog.hostname": "core-router-01.example.com","syslog.appname": "kernel","timestamp": "2025-08-06T14:50:30.123000000Z","status": "ERROR"}
You can easily filter logs by status, application, or attributes specific to the technology, as shown in the examples below.
-
Go to
 Notebooks and open a new or existing notebook.
 -
Select
 > DQL and enter one of the following queries
-
Fetch syslog warn logs
fetch logs| filter dt.openpipeline.source == "extension:syslog"| filter status == "WARN"| sort timestamp descResult:
timestamp syslog message status syslog.appname syslog.priority 2024-10-01T11:56:27.743113056+02:00TCP: eth0: Driver has suspect GRO implementation, TCP performance may be compromised.WARN
kernel
4
2024-10-01T11:56:15.248382315+02:00Network latency exceeded threshold: 250msWARN
net-monitor
4
2024-10-01T11:52:32.464416725+02:00Disk space usage exceeded 80% on /dev/sda1WARN
disk-monitor
28
-
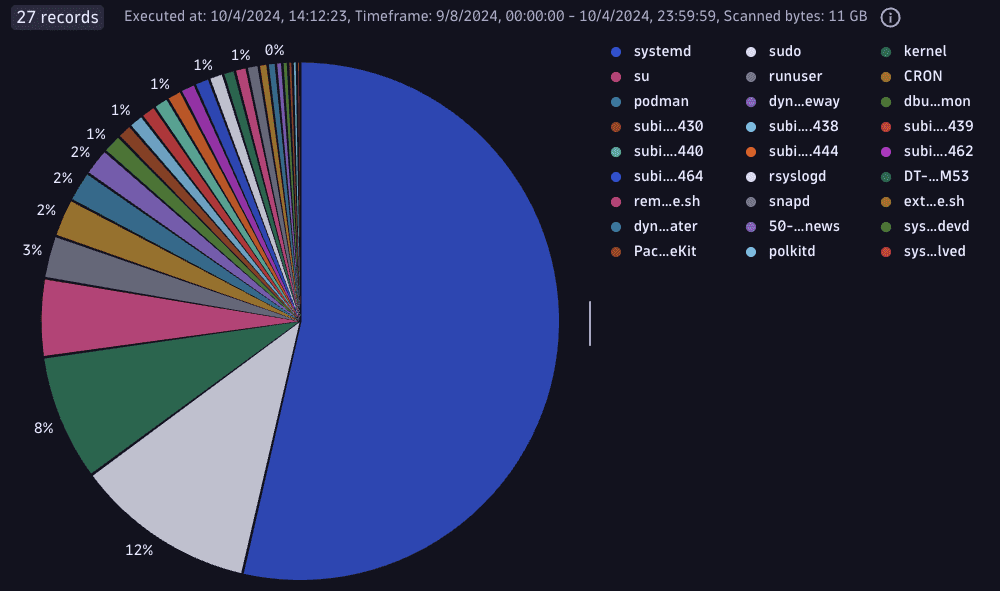
Group syslog logs by application
fetch logs| filter dt.openpipeline.source == "extension:syslog" and isNotNull(syslog.appname)| summarize totalCount = count(), by: {syslog.appname}| sort totalCount descResult:
 Group syslog logs by application
 -
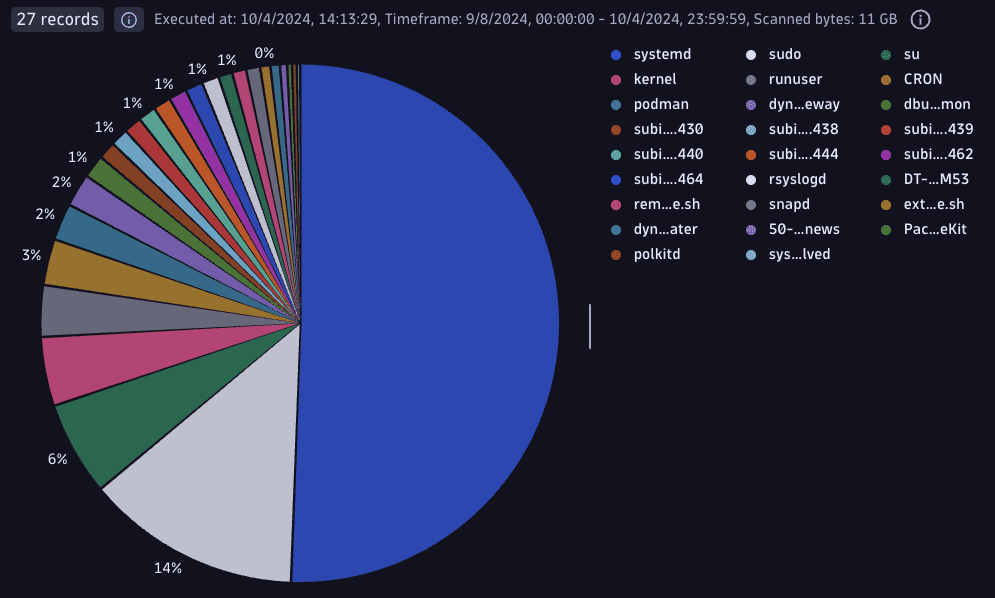
Sort applications by the percentage of syslog error logs
fetch logs| filter dt.openpipeline.source == "extension:syslog" and isNotNull(syslog.appname)| summarize TotalCount = count(), Count = countIf(status == "ERROR"), by: {syslog.appname}| fieldsAdd Percentage = (Count * 100 / TotalCount)| sort Count desc| fieldsRemove TotalCountResult:
 Sort applications by the percentage of syslog error logs
-
To see the results of the queries, you need to have everything configured correctly.
Conclusion
You successfully structured syslog logs according to pre-defined processing rules in OpenPipeline. Incoming records that match the routing conditions are routed to the syslog pipeline, where new attributes specific to the syslog technology are extracted. The new attributes match Dynatrace Semantic Dictionary allowing for smooth analysis. You can filter syslog logs in Notebooks and get the most out of your structured logs.
Related topics
 OpenPipeline