Processing in OpenPipeline
- Latest Dynatrace
- Explanation
- 4-min read
Dynatrace OpenPipeline can reshape incoming data for better understanding, processing, and analysis. OpenPipeline processing is based on rules that you create and offers a flexible way of extracting value from raw records.
Key terms
- Ingest sources
Source of ingestion for a configuration scope, collecting data from the provider into Dynatrace Platform, for example, API endpoints or OneAgent.
- Routing
Assignation of data to a pipeline, based either on matching conditions (dynamic) or direct assignation (static).
Pipeline
Once data is ingested and routed, OpenPipeline processing occurs in pipelines. Each pipeline contains a set of processing instructions (processors) that are executed in an ordered sequence of stages and define how Dynatrace should structure, separate, and store your data. After a record is processed, it's sent to storage and is available for further analysis.
Processing is based on available records and doesn't take into account record enrichment from external services.
Types
Pipelines can be of a custom or built-in type.
Custom pipeline
You can create new custom pipelines and modify them to group processing and extraction according to the relevant technology or team. By adding custom pipelines per team, you can manage them via owner-based access control.
Built-in pipeline
Built-in pipelines are provided out of the box. They are essential for OpenPipeline operation and generally cannot be modified within OpenPipeline. Access to these pipelines is intentionally restricted to preserve their configuration.
Default pipeline
The default pipeline is a built-in pipeline that processes unassigned incoming data for storage. It's unique to the configuration scope and ensures that records are assigned to the default bucket and not unintentionally dropped. It's available to all users in view-only mode. It's not available for log and business event configuration scopes where the Classic pipeline is available.
Route as much data as feasible to custom pipelines using explicit matching conditions; limit the use of the default pipeline to monitoring unassigned incoming data.
Classic pipeline
The Classic pipeline is a built-in pipeline specific to the log and business event configuration scopes. It represents and serves as an entry point to the rules you set in Settings Classic for log or business event processing via the classic pipeline.
If you use log processing via the classic pipeline, migrate your rules to OpenPipeline custom pipelines.
Use cases
- Prepare, transform, and store data in Grail.
- Grant access to specific records.
Stage
A stage is a phase in a pipeline sequence that focuses on a task, such as masking, filtering, processing, or extraction. Stages contain a predefined list of configurable processors, which define the task of the stage.
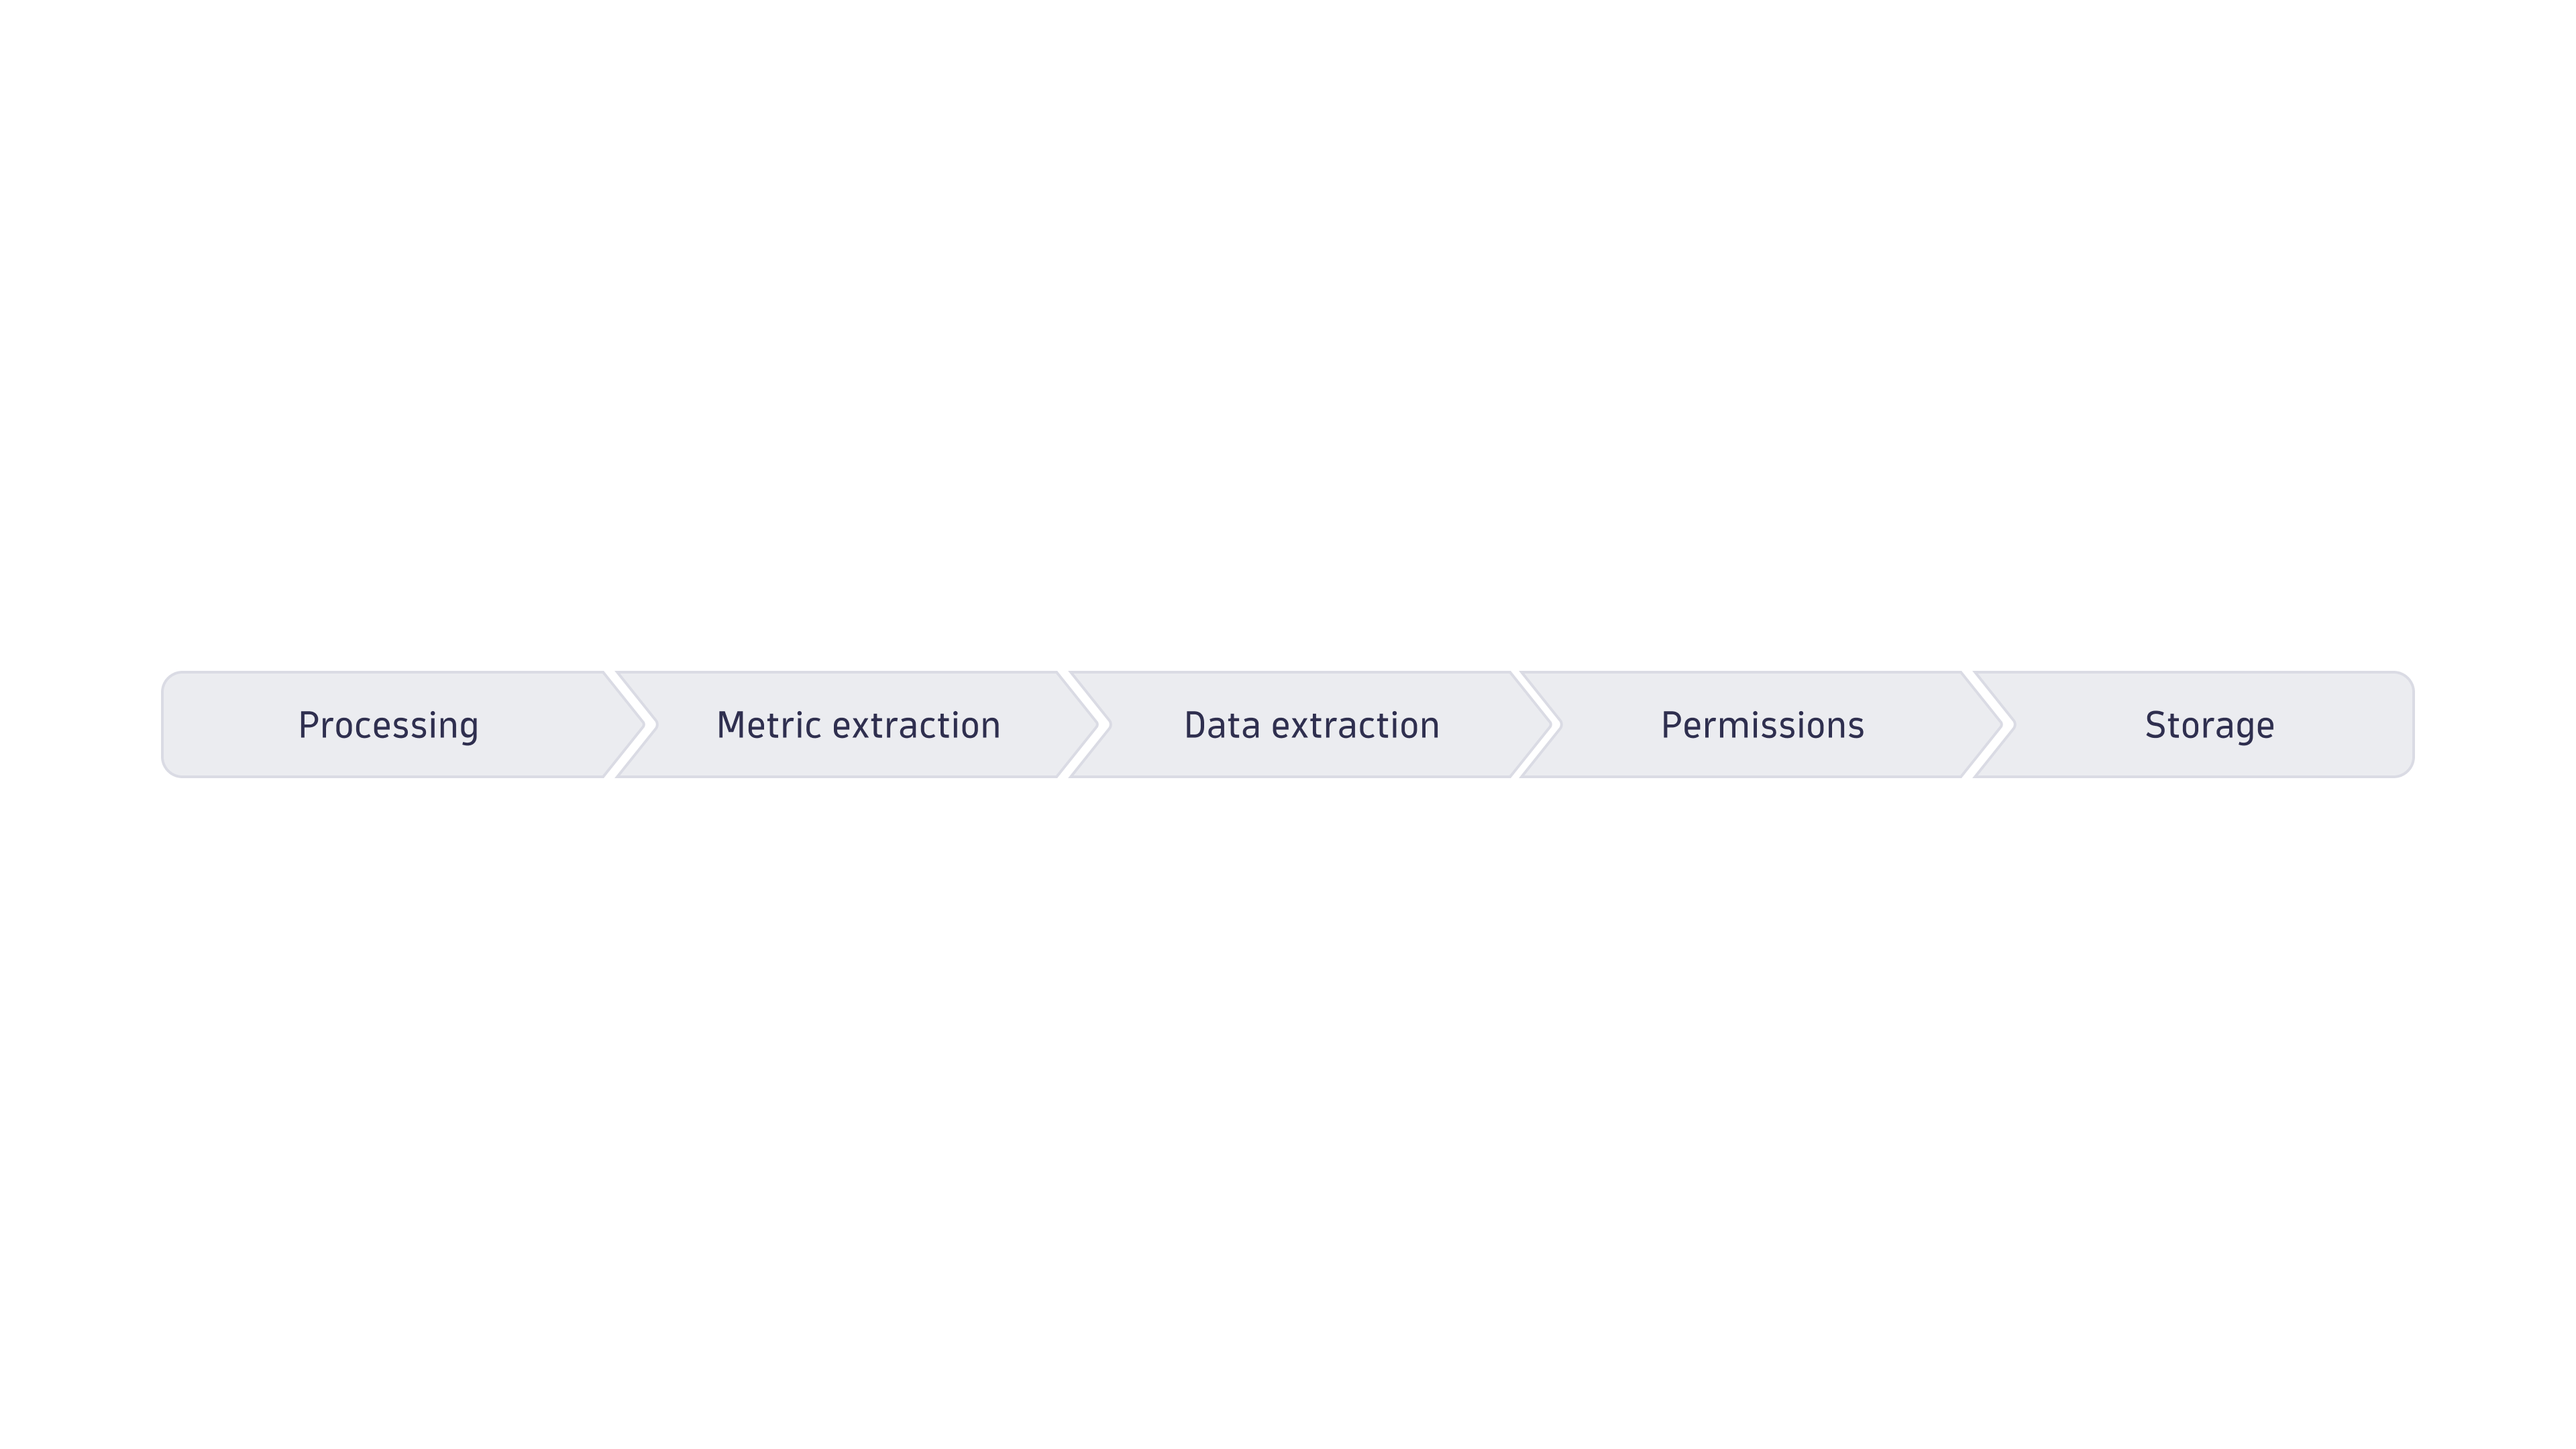
The following table is a comprehensive list of stages, ordered in the pipeline sequence of execution, specifying which processors are available and executed for each stage, for the supported configuration scopes.
Specific fields are excluded from matching and processing or restricted. To learn more, see Limits specific to fields.
| Stage | Description | Processors in the stage | Executed processors | Supported data types |
|---|---|---|---|---|
Processing | Prepare data for analysis and storage by parsing values into fields, transforming the schema, and filtering the data records. Fields are edited, and sensitive data is masked. |
| All matches | Logs, Events—Generic, Events—Davis events, Events—Davis, Events—SDLC events, Security events (new) 1, Business events, Spans1 , Metrics, User events, User sessions |
Metric extraction | Extract metrics from the records that match the query. |
| All matches | Logs, Events—Generic, Events—SDLC events, Security events (new)1, Business events, System events, User events, User sessions |
Smartscape Node Extraction | Extract Smartscape nodes for the records that match the query. |
| All matches | Logs, Events—Generic, Events—SDLC events, Security events (new)1, Business events, System events, Spans1, User events, User sessions, Metrics |
Smartscape Edge Extraction | Extract Smartscape edges for the records that match the query. |
| All matches | Logs, Events—Generic, Events—SDLC events, Security events (new)1, Business events, System events, Spans1, User events, User sessions, Metrics |
Metric extraction | Extract metrics from the records that match the query. |
| All matches | Spans |
Data extraction | Extract a new record from a pipeline and re-ingest it as a different data type into another pipeline. |
| All matches | Logs, Events—Generic, Events—SDLC events, Security events (new)1, Business events, System events, Spans1, User events, User sessions |
Davis | Extract a new record from a pipeline and re-ingest it as a Davis events into another pipeline. |
| All matches | Logs, Events—Generic, Events—SDLC events, Security events (new)1, Business events, System events, Spans1 |
Cost allocation | Advanced option to assign cost center usage to specific records that match a query. Make sure to review Cost Allocation documentation when choosing the best approach for your environment. |
| First match only | Logs, Spans1 |
Product allocation | Advanced option to assign product or application usage to specific records that match a query. Make sure to review Cost Allocation documentation when choosing the best approach for your environment. |
| First match only | Logs, Spans1 |
Permissions | Apply security context to the records that match the query. |
| First match only | Logs, Events—Generic, Events—Davis events, Events—Davis, Events—SDLC events, Security events (new)1, Business events, Spans1, Metrics, User events, User sessions |
Storage | Assign records to the best-fit bucket. |
| First match only | Logs, Events—Generic, Events—Davis events, Events—Davis, Events—SDLC events, Security events (new)1, Business events, Spans1 |
The data remains in its original, structured form. This is important for detailed analysis and troubleshooting, as it ensures that no information is lost or altered.
Extracted metrics are sent to Grail only, except for the security events (new) and span configuration scopes.
Processor
A processor is a pre-formatted processing instruction that focuses either on modifying (for example, by renaming or adding a new field) or extracting data (for example, by creating an event from a log line or extracting metrics).
While the processor format is predefined, it contains a configurable matcher and processing definition.
- The matcher defines the target of a processor via a DQL query. It narrows down the available data to the specific set you want to process.
- The processing definition instructs Dynatrace on how to transform or modify the data filtered by the matcher.
The following table lists alphabetically all available processors in a pipeline.
| Processor | Description |
|---|---|
Add fields | Adds fields with name and value. |
Bucket assignment | Assigns a Grail bucket. |
Business event | Extracts fields into a new record and sends it to the business event table. |
Counter metric | Returns the number of occurrences of a metric, from the records that match the query. |
Davis event | Extracts fields into a new record and sends it to an event table. |
DQL | Processes a subset of DQL. The output is formatted to string, number, bool, duration, timestamp, and respective arrays of those. |
DPS Cost Allocation - Cost Center | Assigns cost center usage to a record via |
DPS Cost Allocation - Product | Assigns product or application usage to a record via |
Drop record | Drops a record. The record is not retained. |
Early Access GeoIP lookup | Enriches a record with geolocation attributes derived from an IP address field, including country, city, region, and coordinates. |
Histogram metric | Produces histogram metrics that capture a distribution. Histogram metrics can be used to calculate percentiles using the |
No storage assignment | Skips storage assignment. The record is not retained. |
Sampling aware counter metric | Sampling might be applied to trace data before it's processed, according to Adaptive Traffic Management for distributed tracing. This span-specific processor supports sampling awareness when returning the number of metric occurrences, from the span records that match the query. Span aggregation and sampling awareness are configurable for all fields available in field extraction, except duration—aggregation of duration is automatically detected and handled. |
Sampling aware histogram metric | Sampling might be applied to trace data before it's processed, according to Adaptive Traffic Management for distributed tracing. This span-specific processor supports sampling awareness when producing histogram metrics that capture a distribution. Span aggregation and sampling awareness are configurable for all fields available in field extraction, except duration—aggregation of duration is automatically detected and handled. Histogram metrics can be used to calculate percentiles using the |
Sampling aware value metric | Sampling might be applied to trace data before it's processed, according to Adaptive Traffic Management for distributed tracing. This span-specific processor supports sampling awareness when returning the aggregated values of a metric, from the span records that match the query. Span aggregation and sampling awareness are configurable for all fields available in field extraction, except duration—aggregation of duration is automatically detected and handled. |
Set dt.security_context | Sets the proper record-level access via |
Smartscape node |
|
Smartscape edge | Extracts Smartscape edges and assigns specified key-value pairs for the fields: source type, source ID, edge type (pre-defined or custom), target type, and target ID. To learn more about Smartscape edges, see Smartscape on Grail. |
Software developement lifecycle event | Extracts fields into a new record and sends it to the SDLC event table. |
Technology bundle | Matches records for the selected technology and processes them according to predefined context-sensitive processing statements. |
Remove fields | Removes fields from the record. |
Rename fields | Changes the name of fields. |
Value metric | Returns the aggregated values of a metric from the records that match the query. |