Upgrade to the latest Dynatrace
- Dynatrace Classic
- 20-min read
With the latest Dynatrace, you gain significant improvements in storing and analyzing observability, security, and business data.
To leverage these improvements, you need to adapt the data retention, data access, and segmentation configuration. This article walks you through the best practices for configuring data retention and data access control on Grail.
What you will learn
This guide is intended for Dynatrace SaaS admins with environments on AWS or Azure.
With this guide, a Dynatrace admin can configure Dynatrace and Grail and get their teams started with new functionalities like AppEngine, AutomationEngine, or Notebooks.
Please note that these adaptations only apply to the usage of new and improved functionality referred to as "Latest Dynatrace". Existing functionality is not affected by these adaptations.
What you need to know first
Before you can get started, you need to familiarize yourself with concepts that provide the new value we refer to as the latest Dynatrace.
The latest Dynatrace is a combination of intertwined new features that provide improvements in storing and analyzing observability, security, and business data.
Grail
One of the major changes is the introduction of Grail as a new unified data lakehouse. Grail gives you significant improvements in data ingestion, retention, and analytics. Later on, you'll learn how to configure data retention and data access control on Grail.
For more information, see Grail.
Dynatrace Query Language
Grail not only stores all the observability and security data but also enables access to that data with Dynatrace Query Language (DQL). Access to all data through the query language is new to Dynatrace and goes far beyond data access through APIs and UIs we have offered up to now.
For more information, see Dynatrace Query Language
Multiple ways to access and analyze data
Together with the introduction of Grail, Dynatrace has also released a set of major improvements to user interfaces, APIs, and services.
The introduction of the Notebooks, Workflows, and new Dashboards enables you to access data in Grail in various ways. This ranges from consuming views sourced from Dynatrace or peers to constructing highly specialized views. Moreover, you can implement your own logic using fully customized apps running on the AppEngine. Every conceivable operation on Dynatrace data becomes possible.
Before non-admin users can use the latest Dynatrace functionalities, however, a few administrative steps are needed to manage data access. These are explained below.
Switch to the new interface
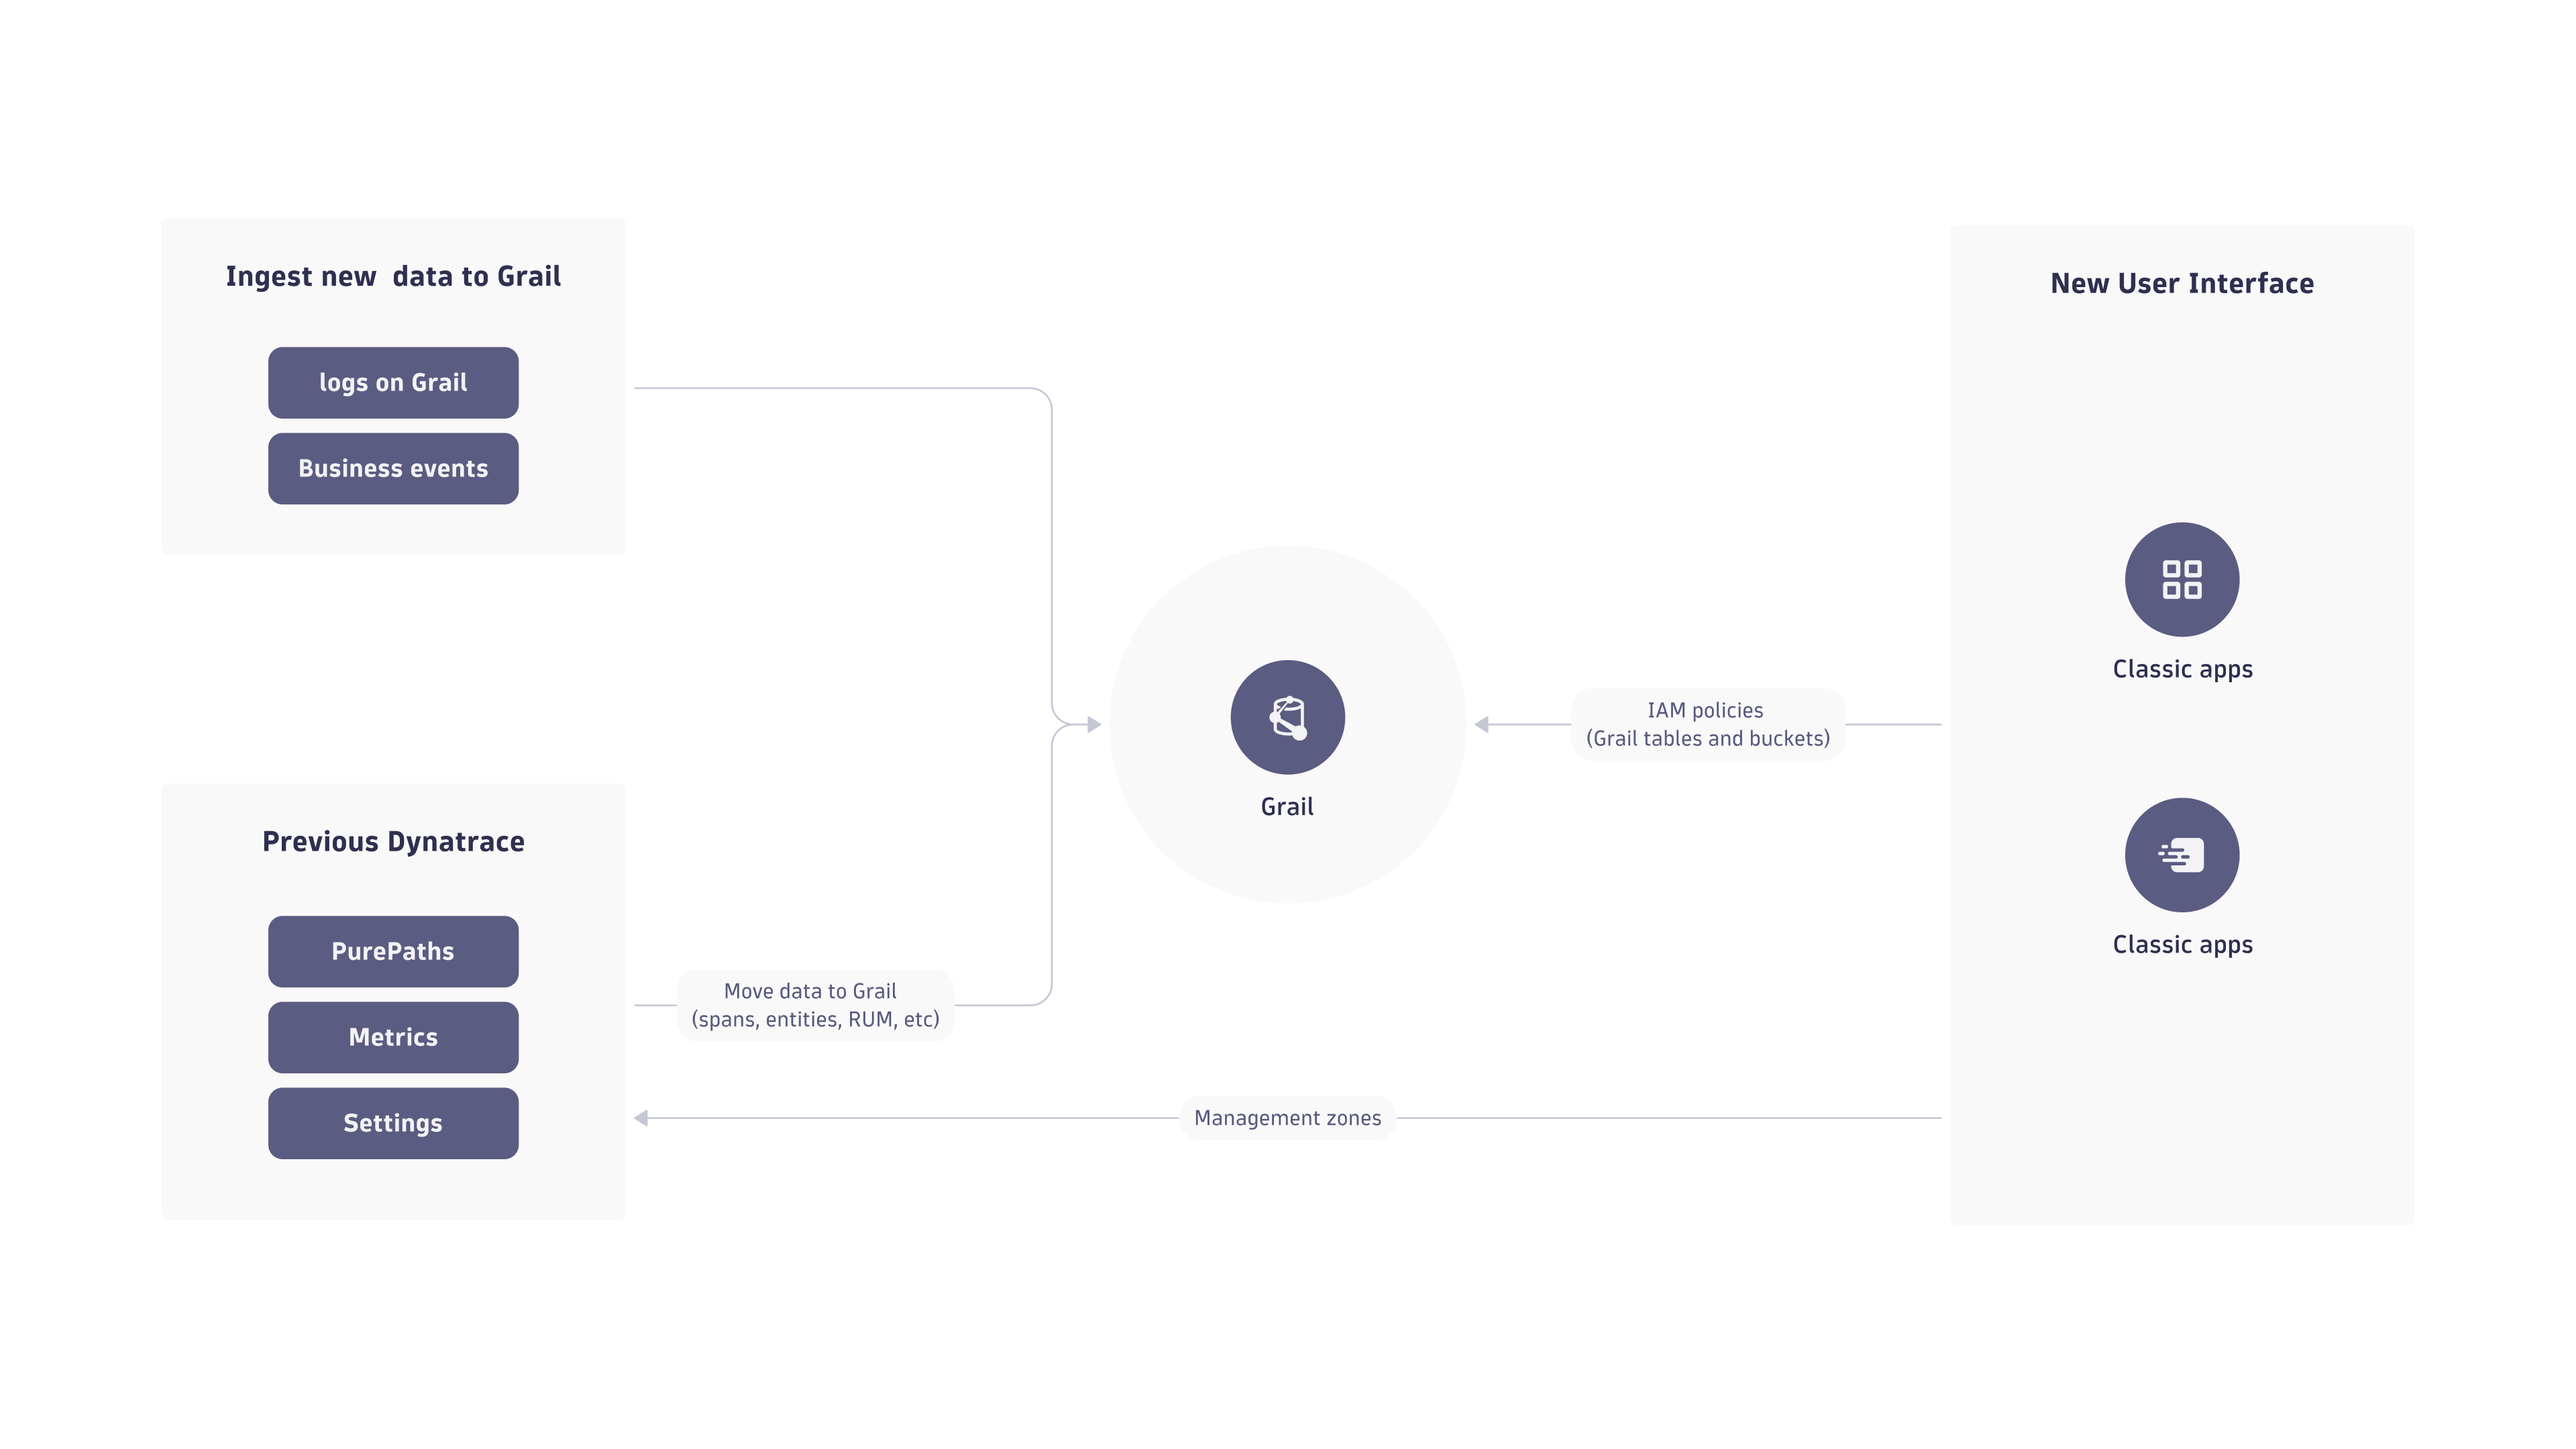
Your users already have the option to switch to the new user interface, though most of its functionality is derived from existing views that still rely on the current management concepts: management zones and permissions.
Access control
What is the difference between management zones and new IAM policies?
- Current management zone concept
Indirectly control access to monitoring data (distributed traces and metrics) based on entity IDs.
- Security policies for data access in Grail
Control access to monitoring data based on permission-relevant fields and the newly introduced security context.
While management zones are a very versatile tool for setting up complex permissions, this flexibility also turned out to be a bottleneck in large enterprise environments that store large amounts of data. To successfully use management zones, the ingested data needs to be related to a monitored entity. Data access management with Grail is based on data, data type, and data organization. Security policies can be defined to allow access only to specific data even without any entity relation.
Out-of-the-box permission-relevant fields can be used in most cases for access control. Additionally, we've added the dt.security_context field, which is reserved for environment-specific details. All Dynatrace components will ensure that these table-relevant permission fields are available on each record (event, log, span) or metric. This allows for a consistent permission concept for the entire environment.
| Field name | IAM condition | Supported IAM tables |
|---|---|---|
|
|
|
|
|
|
|
|
|
|
|
|
|
|
|
|
|
|
|
|
|
|
|
|
|
|
|
|
|
|
For more information, see Identity and access management (IAM).
Data in Grail
The Grail data model consists of Grail buckets, tables, and views.
- Tables describe the observability data type.
- Grail buckets are the storage containers, like a folder on a file system.
- Each bucket is assigned to a table, so a table group has several buckets. Fetching records from a table means that all buckets are queried.
A fresh Dynatrace environment comes with a couple of default buckets. These buckets are prefixed with default_ and cannot be modified. In the process of customizing the environment, users can define custom buckets (as explained later).
The ingestion of data to Grail starts with OneAgent or one of our ingest APIs:
Access Grail-stored data via DQL
Data stored in Grail can be accessed via DQL. The easiest way to take a first look at your data is by using Notebooks.
Logs, Events, and Business Events
Logs, Events, and Business Events use their own tables with default buckets and 35 days of retention. You can access them by using these commands in the DQL sections of a notebook:
fetch logs
fetch events
fetch bizevents
Traces
Traces are defined by spans, and spans are the default bucket for spans kept for 10 days. Look at the notebook code snippets section for an easy start, or explore using:
fetch spans
Spans are in preview release and not available on every environment immediately.
Topology
Topology (monitored entities) is not yet stored in Grail. Instead, the classic entity storage can be accessed via DQL through predefined views that are all prefixed with dt.entity.
fetch dt.entity.process_group
fetch dt.entity.host
Metrics
Many metrics are already by default stored in Grail. The list will grow every month. Metrics are retained for 15 months. You can access them easily via the notebook metric explorer or using the timeseries command as in the examples below:
timeseries avg(dt.host.cpu.load)
timeseries sum(dt.host.disk.util_time)
Dynatrace system data
Grail also stores Dynatrace system data that you can explore. For example, you can see which tables and buckets are defined, and check system events such as audit events.
dt.system.data_objectslist all tables and views.dt.system.bucketsdisplays all defined buckets.dt.system.eventscontains environment-generated events like audit events.dt.system.query_executionsis a view ondt.system.eventsfor quick access to query executions. It allows admins to see by whom and which queries are executed.
Who can access the data?
Data access is controlled through security policies instead of management zones. Generally, there are two layers of access control: bucket access and table access. For a user to fetch a record, they will need access to the bucket that stores the record and the table to which the bucket is assigned.
For example, a user who wants to access log records from the default_logs bucket requires the following two permissions:
ALLOW storage:logs:readALLOW storage:buckets:read WHERE storage:bucket-name = "default_logs"
Administrators receive automatically assigned policies that allow them to use the new platform and query all data via notebooks. For other users, an administrator first must assign policies accordingly (for example, by applying the AppEngine User to access notebooks and Storage All Grail Data Read to get data). Depending on the data in your environment, as a first step, you could use the default policies for this.
Built-in policies
Dynatrace comes with a set of built-in policies for data access. They are all prefixed with Storage:
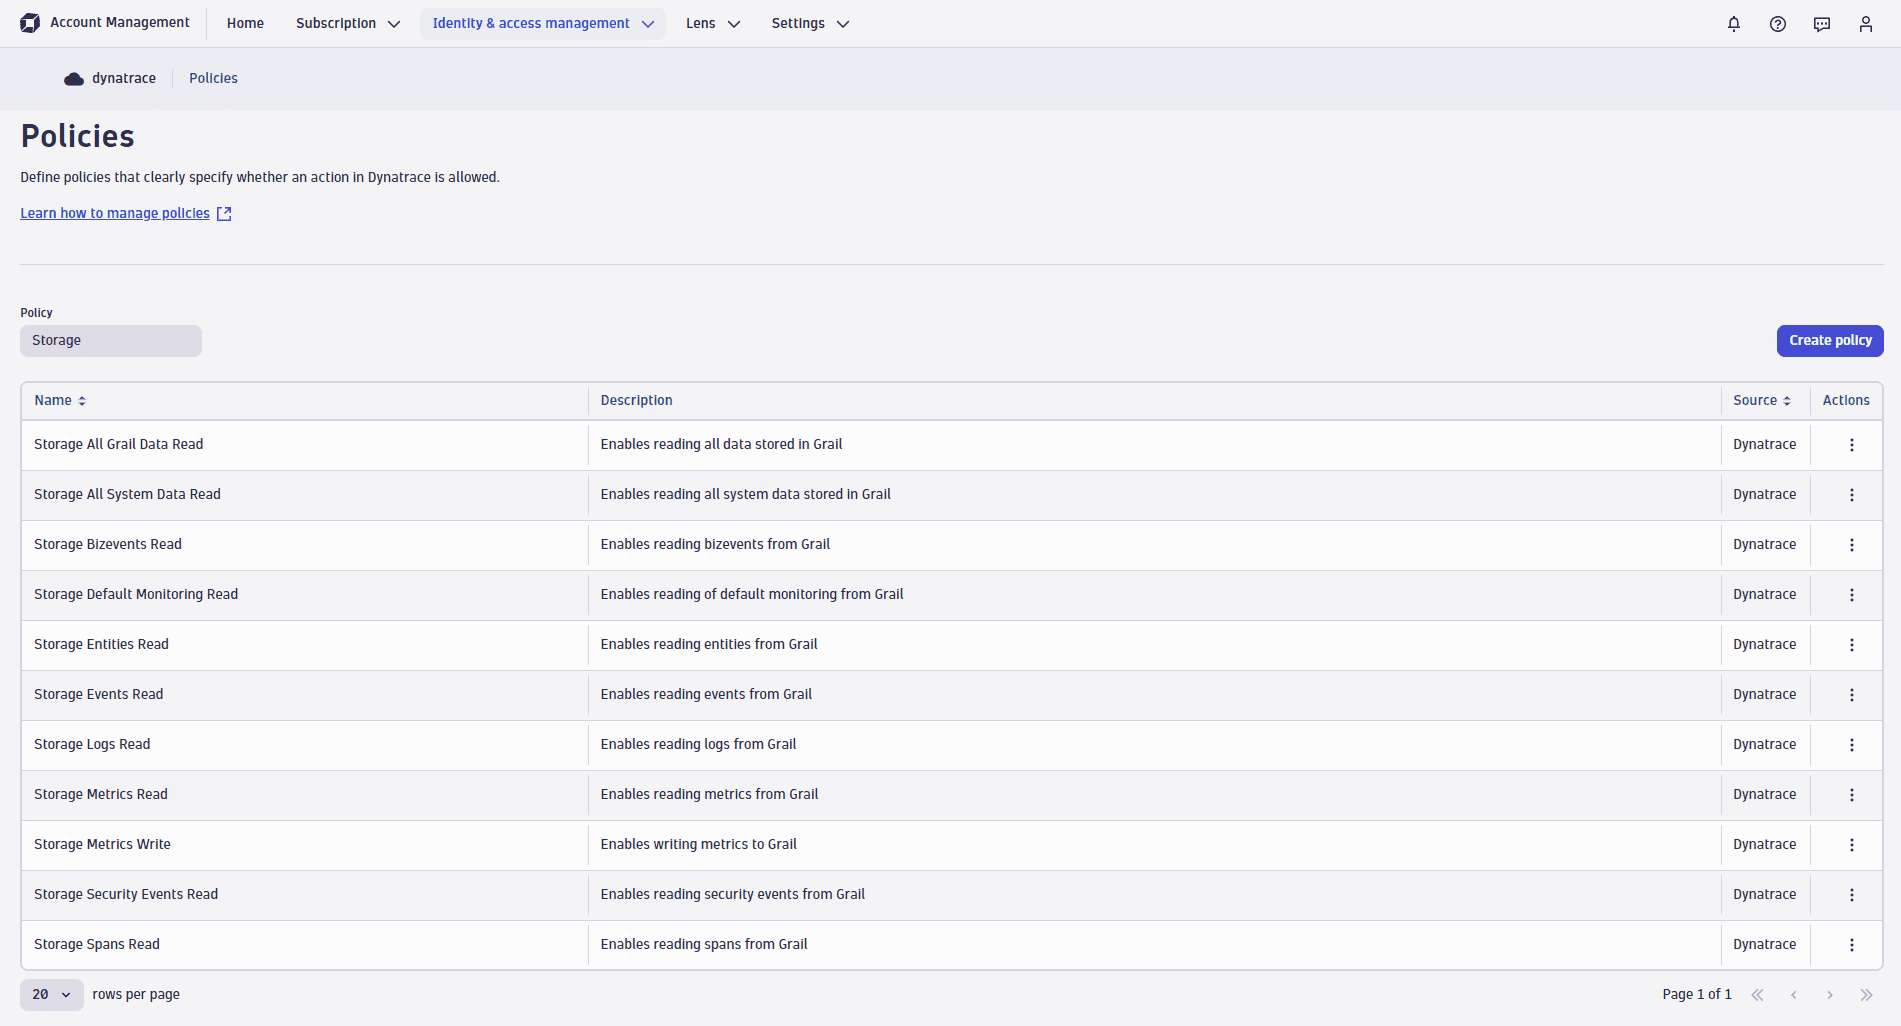
For example, have a look at the Storage Default Monitoring Read policy, which provides the following two permissions:
ALLOW storage:buckets:read WHERE storage:bucket-name STARTSWITH "default_;"ALLOW storage:events:read,storage:logs:read,storage:metrics:read,storage:entities:read,storage:bizevents:read,storage:spans:read;
This grants the user access to all tables and to all default buckets (which are prefixed with _default). Once custom buckets are created, users must get explicit access to access them.
Note: Built-in policies all provide unconditional table access. Once you start adopting record-level permissions, you'll need to replace the default policies with your own policies.
Record level permissions
Data access can be further restricted based on the permission fields. This can be achieved by adding a WHERE clause to the table permissions. For example, giving a user access only to logs of a certain host group can be achieved by providing the following permission:
ALLOW storage:logs:read WHERE storage:dt.host_group.id = "myhostgroup"
Be aware that all permissions that a user is assigned will be evaluated.
If a user has already received access to all logs via an unconditional ALLOW storage:logs:read; permission, this takes precedence, and the record level permission will have no effect.
Learn more about record-level permissions:
Security context
The field dt.security_context is not filled automatically by Dynatrace components. It can be used freely to add a custom dimension to record-level permissions that is not reflected by any of the other permission fields. If you need to restrict access on fields that are not in the supported fields table, you have to set dt.security_context on ingest.
Let's get to work: Implement your data access control
Implementing the data access control requires these two sets of actions:
- Plan your data access permissions by identifying the details on which you can base your access control concept.
- Organize your data into buckets for further access control and custom retention periods.
Plan data access permissions for your environment
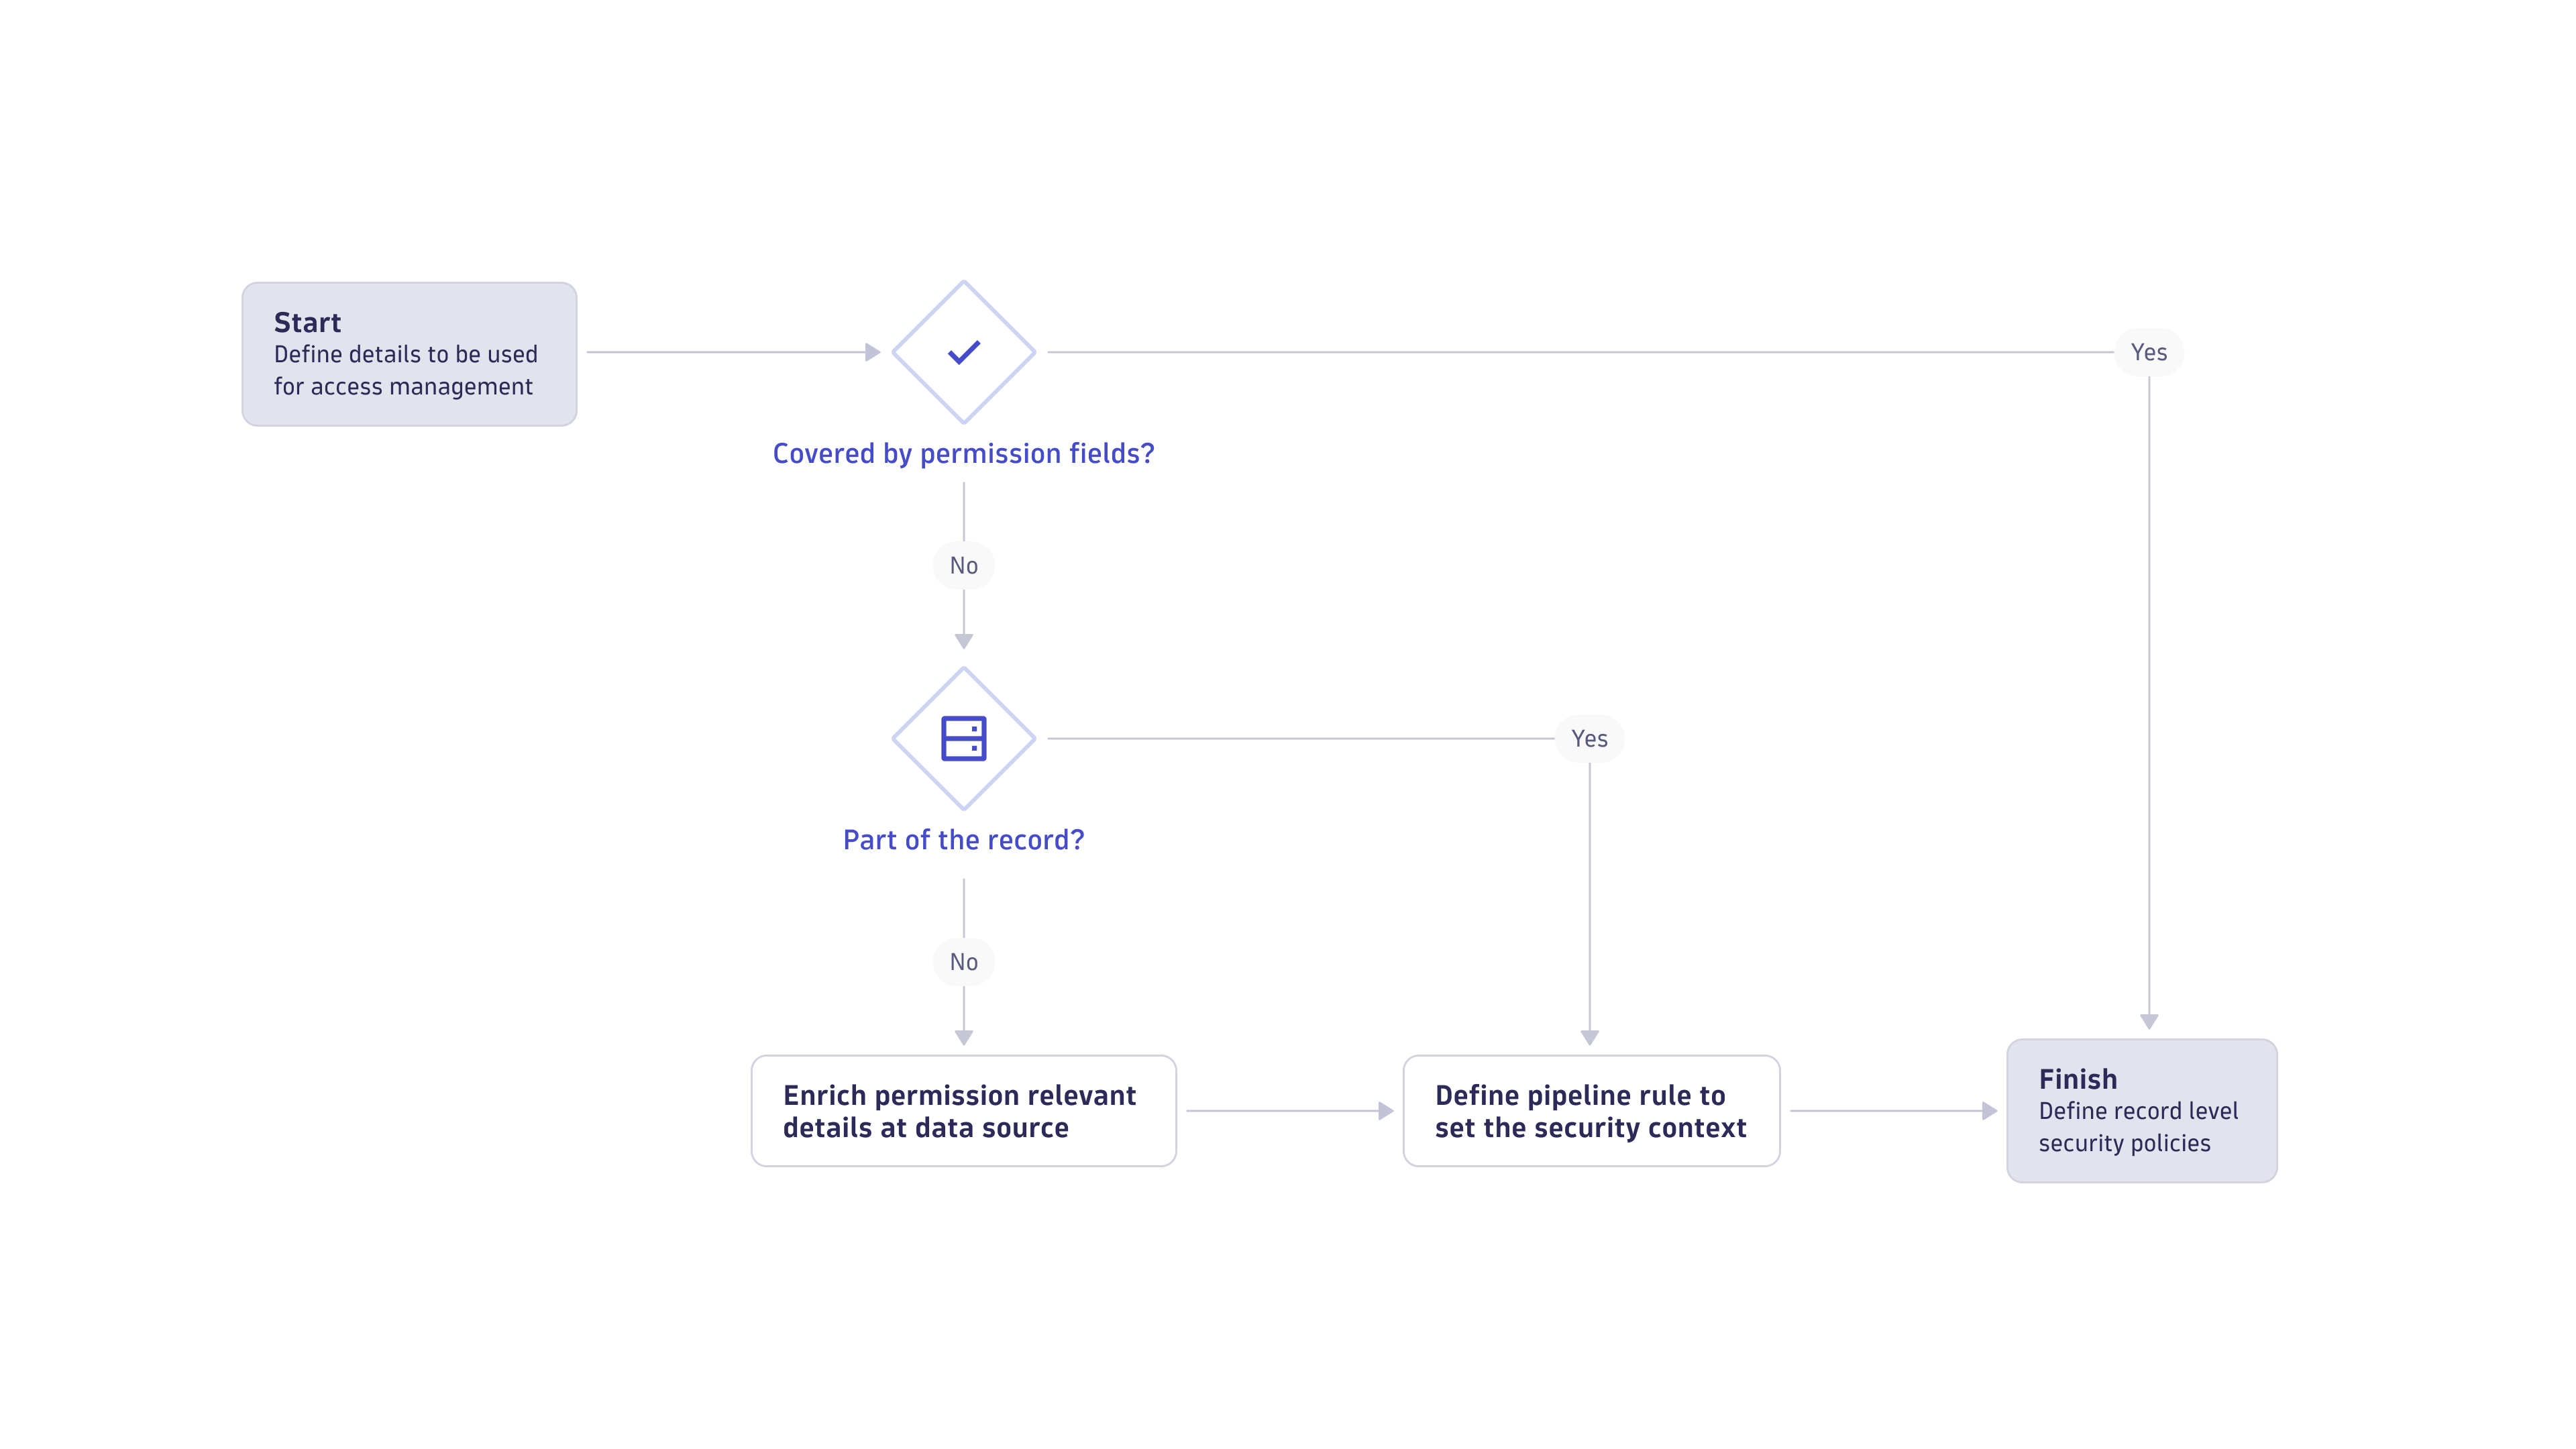
First, you need to identify the details that you'll use for access control. Examples could be product IDs or names, teams, or other organizational details. Typically these details are already modeled via, for example, Dynatrace host groups or Kubernetes namespaces. The following flow chart shows how to figure out the permission concept for your data.
 Control access through IAM conditions
If the permission fields already cover your required details, you can move on to defining record-level permissions.
| Field name | IAM condition |
|---|---|
|
|
|
|
|
|
|
|
|
|
|
|
|
|
|
|
|
|
|
|
 Control access through the record
Very often, the details are already available in the record, but not in one of the permission fields.
For example, log files might contain the details in their content. In these cases, you can leverage the ingest pipeline to set a security context based on any details of the incoming record. The following illustration shows how to use a DQL matching expression on the log content to determine a security context based on it.
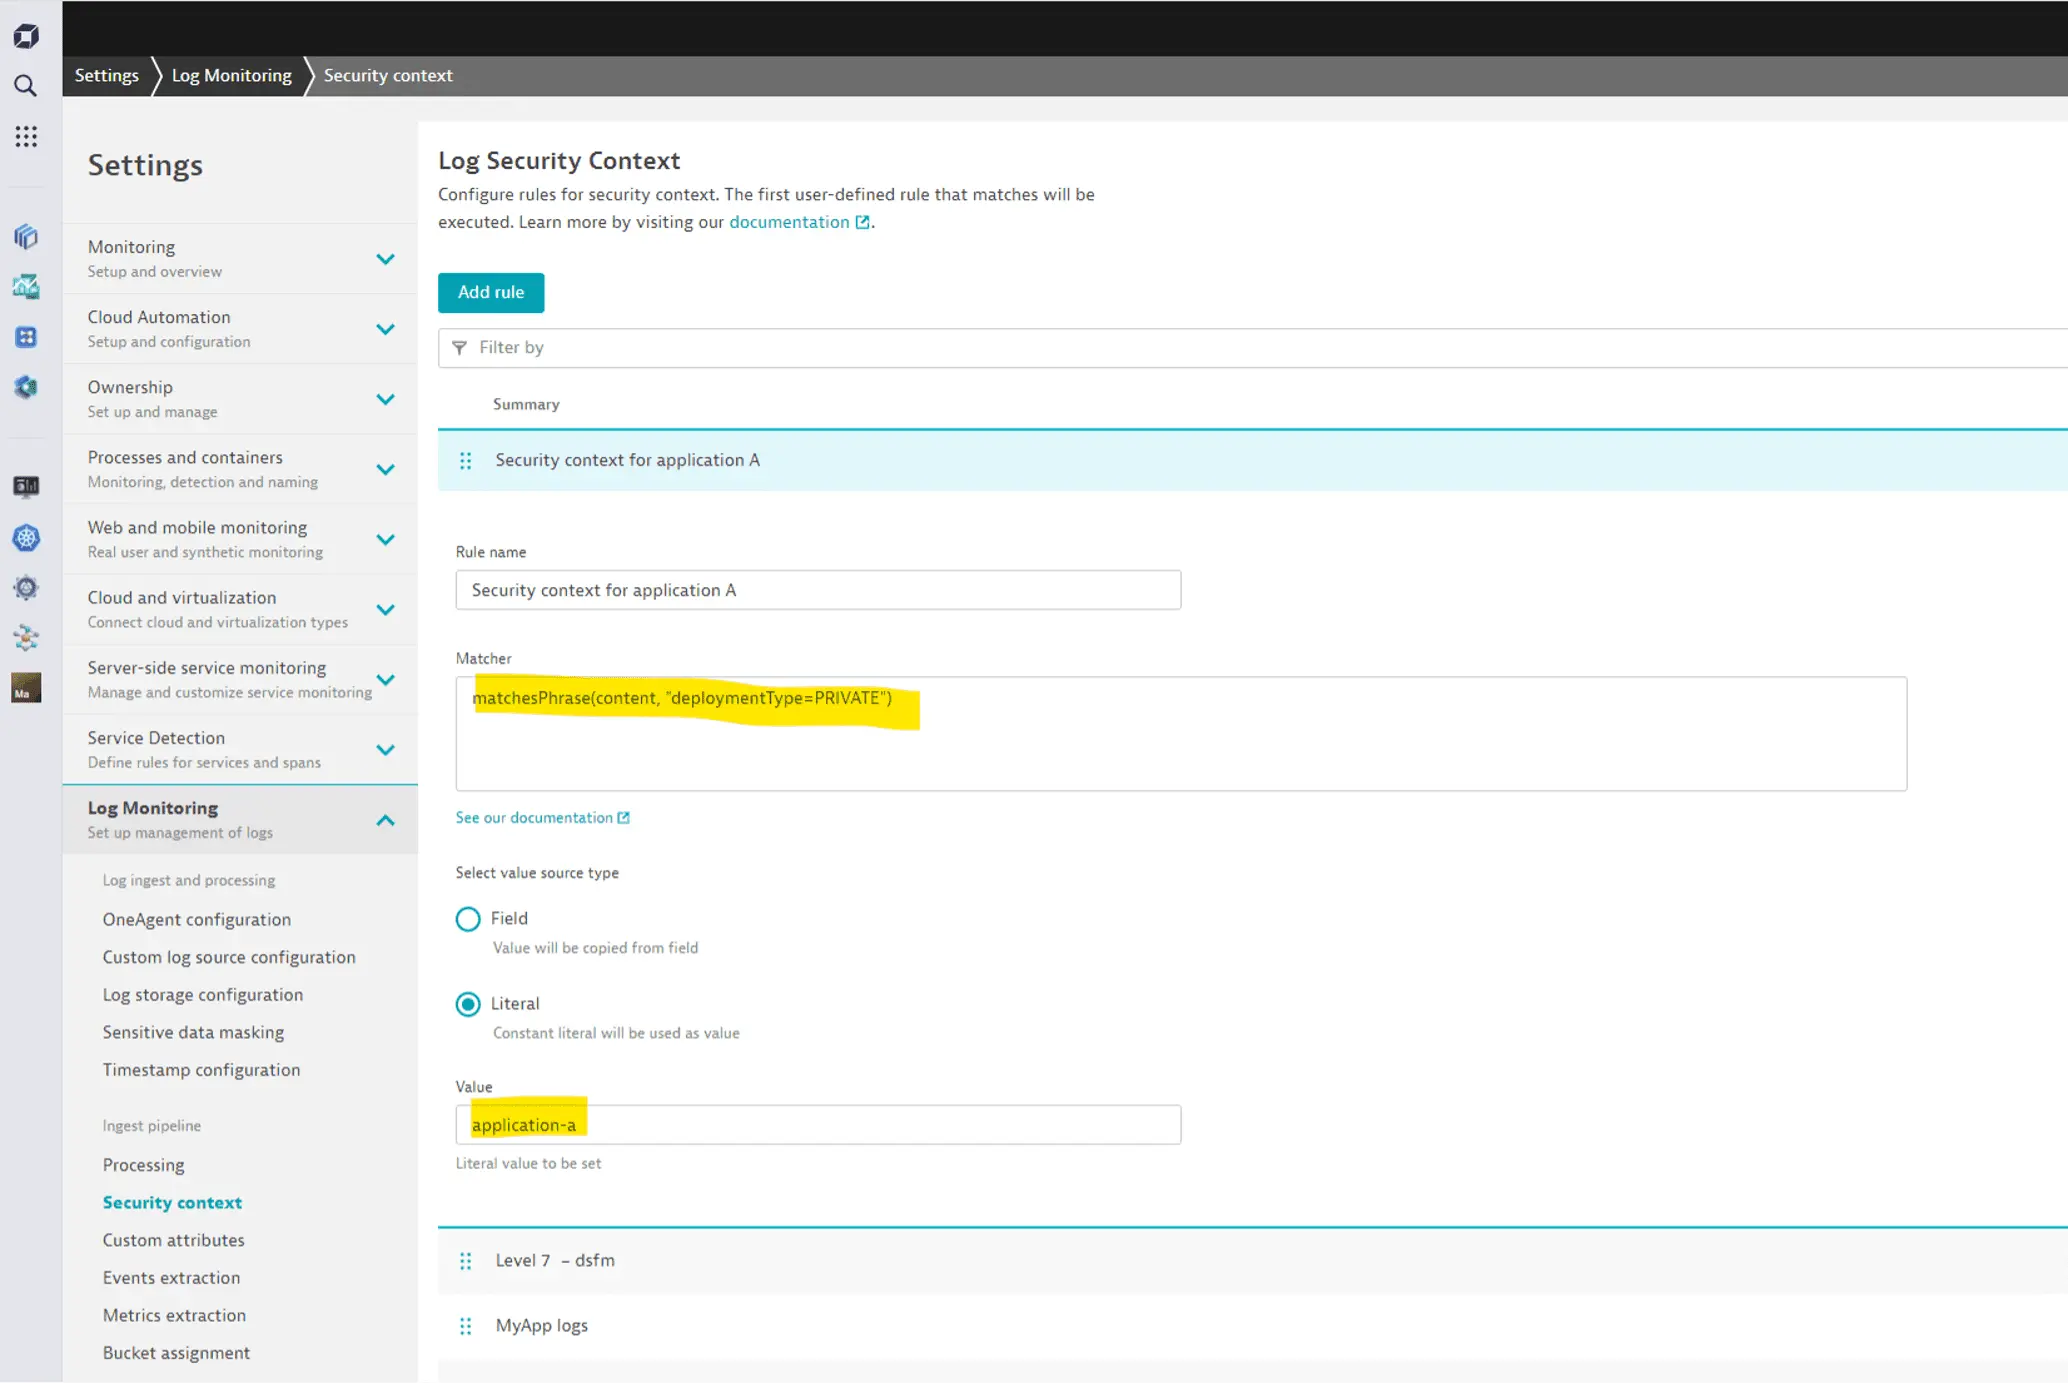
For more information, see Set up Grail permissions for logs.
 Control access details through custom details
In cases where the details are not yet part of the record, you will need to modify the data source.
You have two options:
- Set the security context field directly at the source.
- Include the detail in any other form and use a pipeline rule to set the security context field.
Organize your data
To unlock the full power of Grail, you can also use custom buckets to manage your monitoring data. Custom buckets serve the following purposes:
- Data retention: different retention times need different buckets.
- Data separation and access control: storing your data into different buckets is comparable to storing the data on different disks. Access control is available on the bucket level. Depending on your data volume and your data, searching data in a smaller bucket with less data will be faster.
See the following sections for details on these two purposes.
When should I create custom buckets and how can I allow access to them?
Start by thinking about the retention times per data type for your use cases. Your application troubleshooting use cases might only require 14 days of logs, whereas audit logs might have to be retained for multiple years.
We'll look at logs as an example data type, but these tips also apply to all other data types. Only metrics are different, and we will take a look at metrics later.
Most of your log data might be needed for troubleshooting, and you don't want to store this mass data for a very long time. Try to store these logs as briefly as possible. This reduces costs and makes troubleshooting faster and cheaper. Typically, 14 days might be enough. So how to do it best?
-
Create a custom bucket.
You can create a custom bucket via the Grail – Storage Management API or use the Grail Storage Management App.
To create custom Grail buckets, your group needs to be bound to the policy with the following statements:
ALLOW storage:bucket-definitions:read,storage:bucket-definitions:write,storage:bucket-definitions:truncate,storage:bucket-definitions:delete;We called our first custom bucket
log_sec_dev_troubleshoot_14d. Custom bucket
 -
Send the data.
After the Grail bucket is created, it's time to bring data in. You need to create or adjust a log bucket assignment rule to store troubleshooting logs in that new bucket. You have two possibilities:
- Send only specific logs to the new log bucket by adding bucket assignment rules.
- Send all logs by default to the 14-day bucket and add assignment rules for other retentions.
Let's create a new default rule to store all logs for only 14 days, with one exception, in which we store them in the default 35-day bucket.
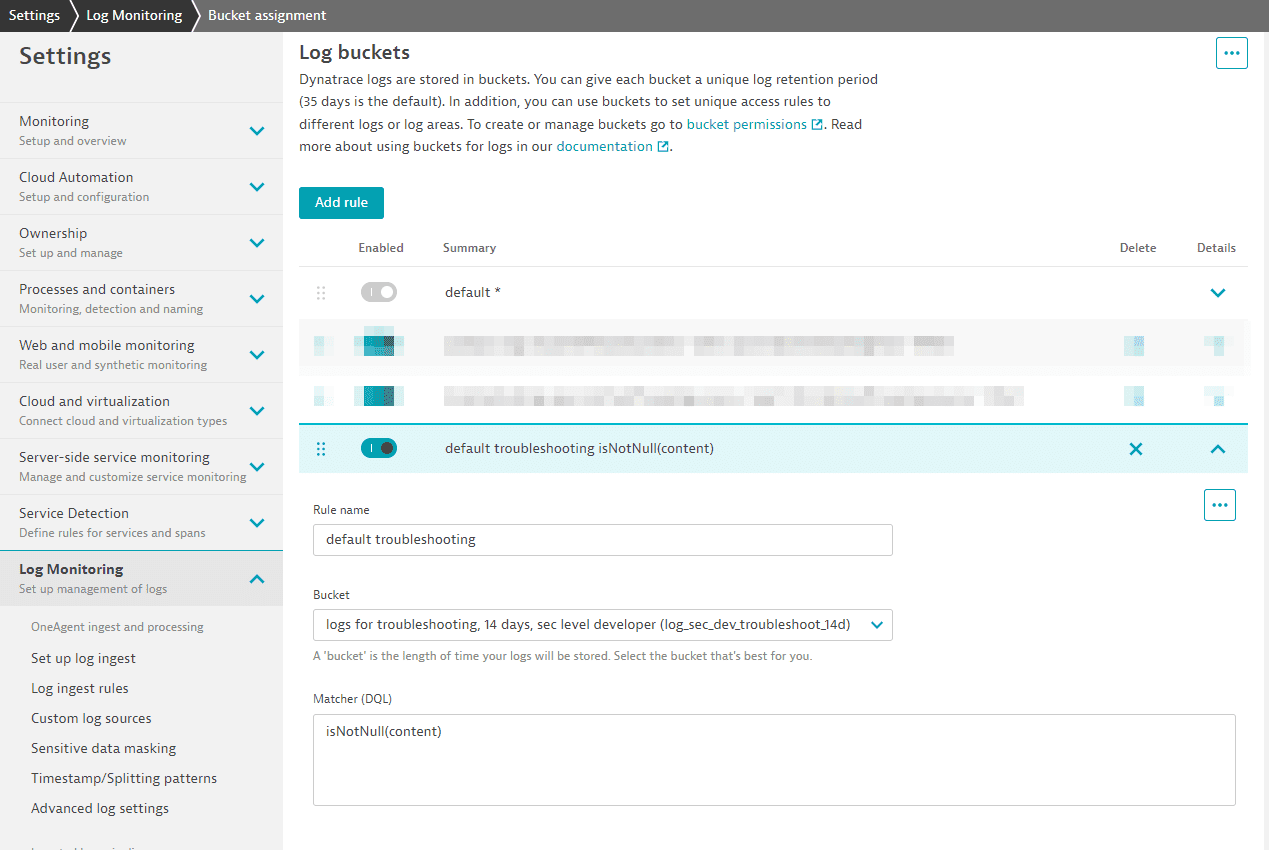 Log bucket rule
The matcher for logs will always be true and therefore match any log line. This will be improved soon by just adding "true" to the matcher. This rule must be the last one in the list. This ensures that every log line not matching before is stored in the bucket for 14 days.
This second rule stores logs from a booking app with the term
b-apporhttpin the log source in our default log bucket for 35 days: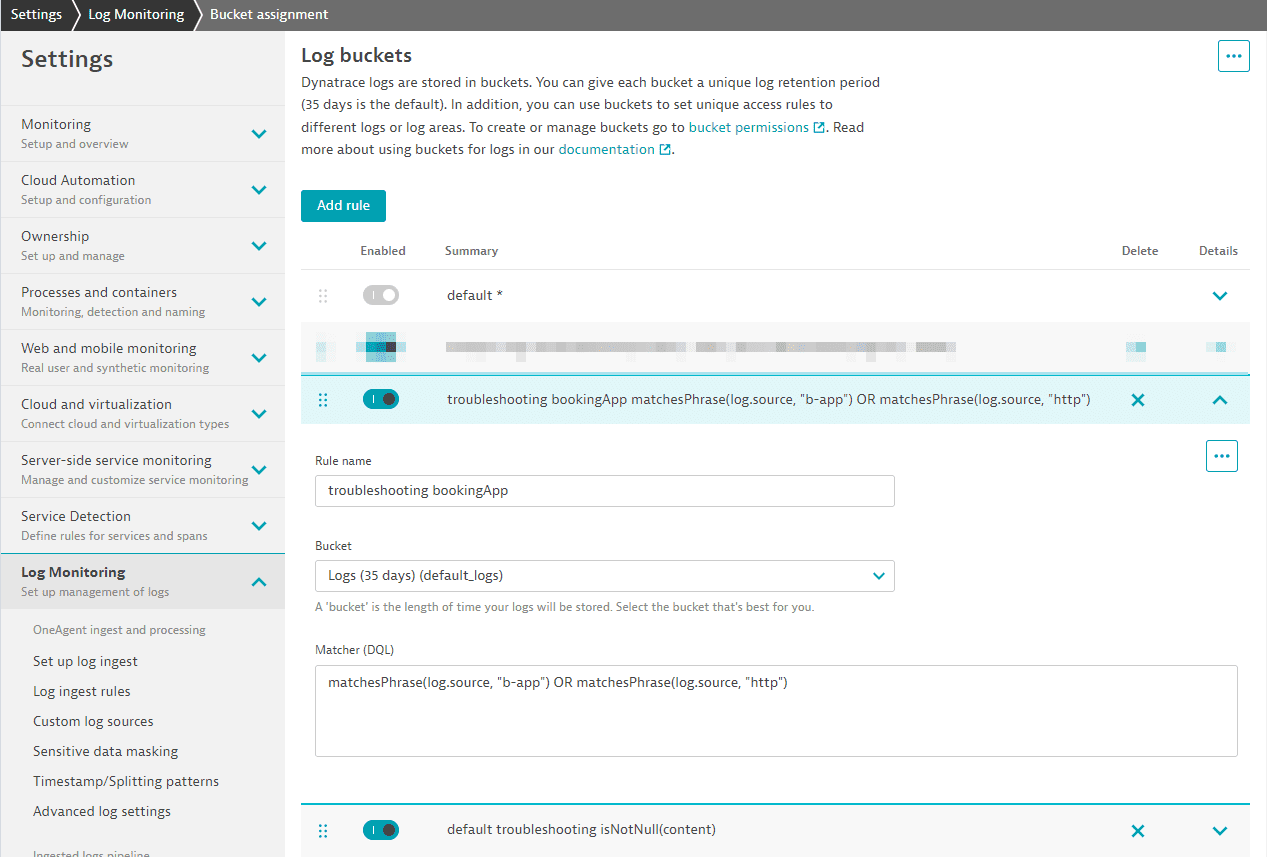 Log bucket rule
Note: the old default rule will not match anymore. It is always executed last and, because we have a new catch-all rule, it will not be used anymore.
-
Create a longer retention bucket for analytic data.
Before we're done, we need another bucket for log information that we need to keep much longer for analytic use cases.
This log contains technical information on product usage combined with technical information. We want to store them in a separate bucket with a longer retention time. This log analytics bucket can be used for all your log lines needed for analytics use cases as long as the retention is not different.
We need to repeat the steps and create a new log bucket and a bucket assignment rule. The 1-year log bucket is called
log_sec_dev_analytics_1y. 1-year log bucket
The analytics log lines can be easily identified, as there is a company-wide agreement that all analytic log lines have log-level
INFOand contain the termapp_analytics.We add a bucket assignment rule with the following matcher:
matchesPhrase(content, "app_analytics") and matchesValue(loglevel,"INFO")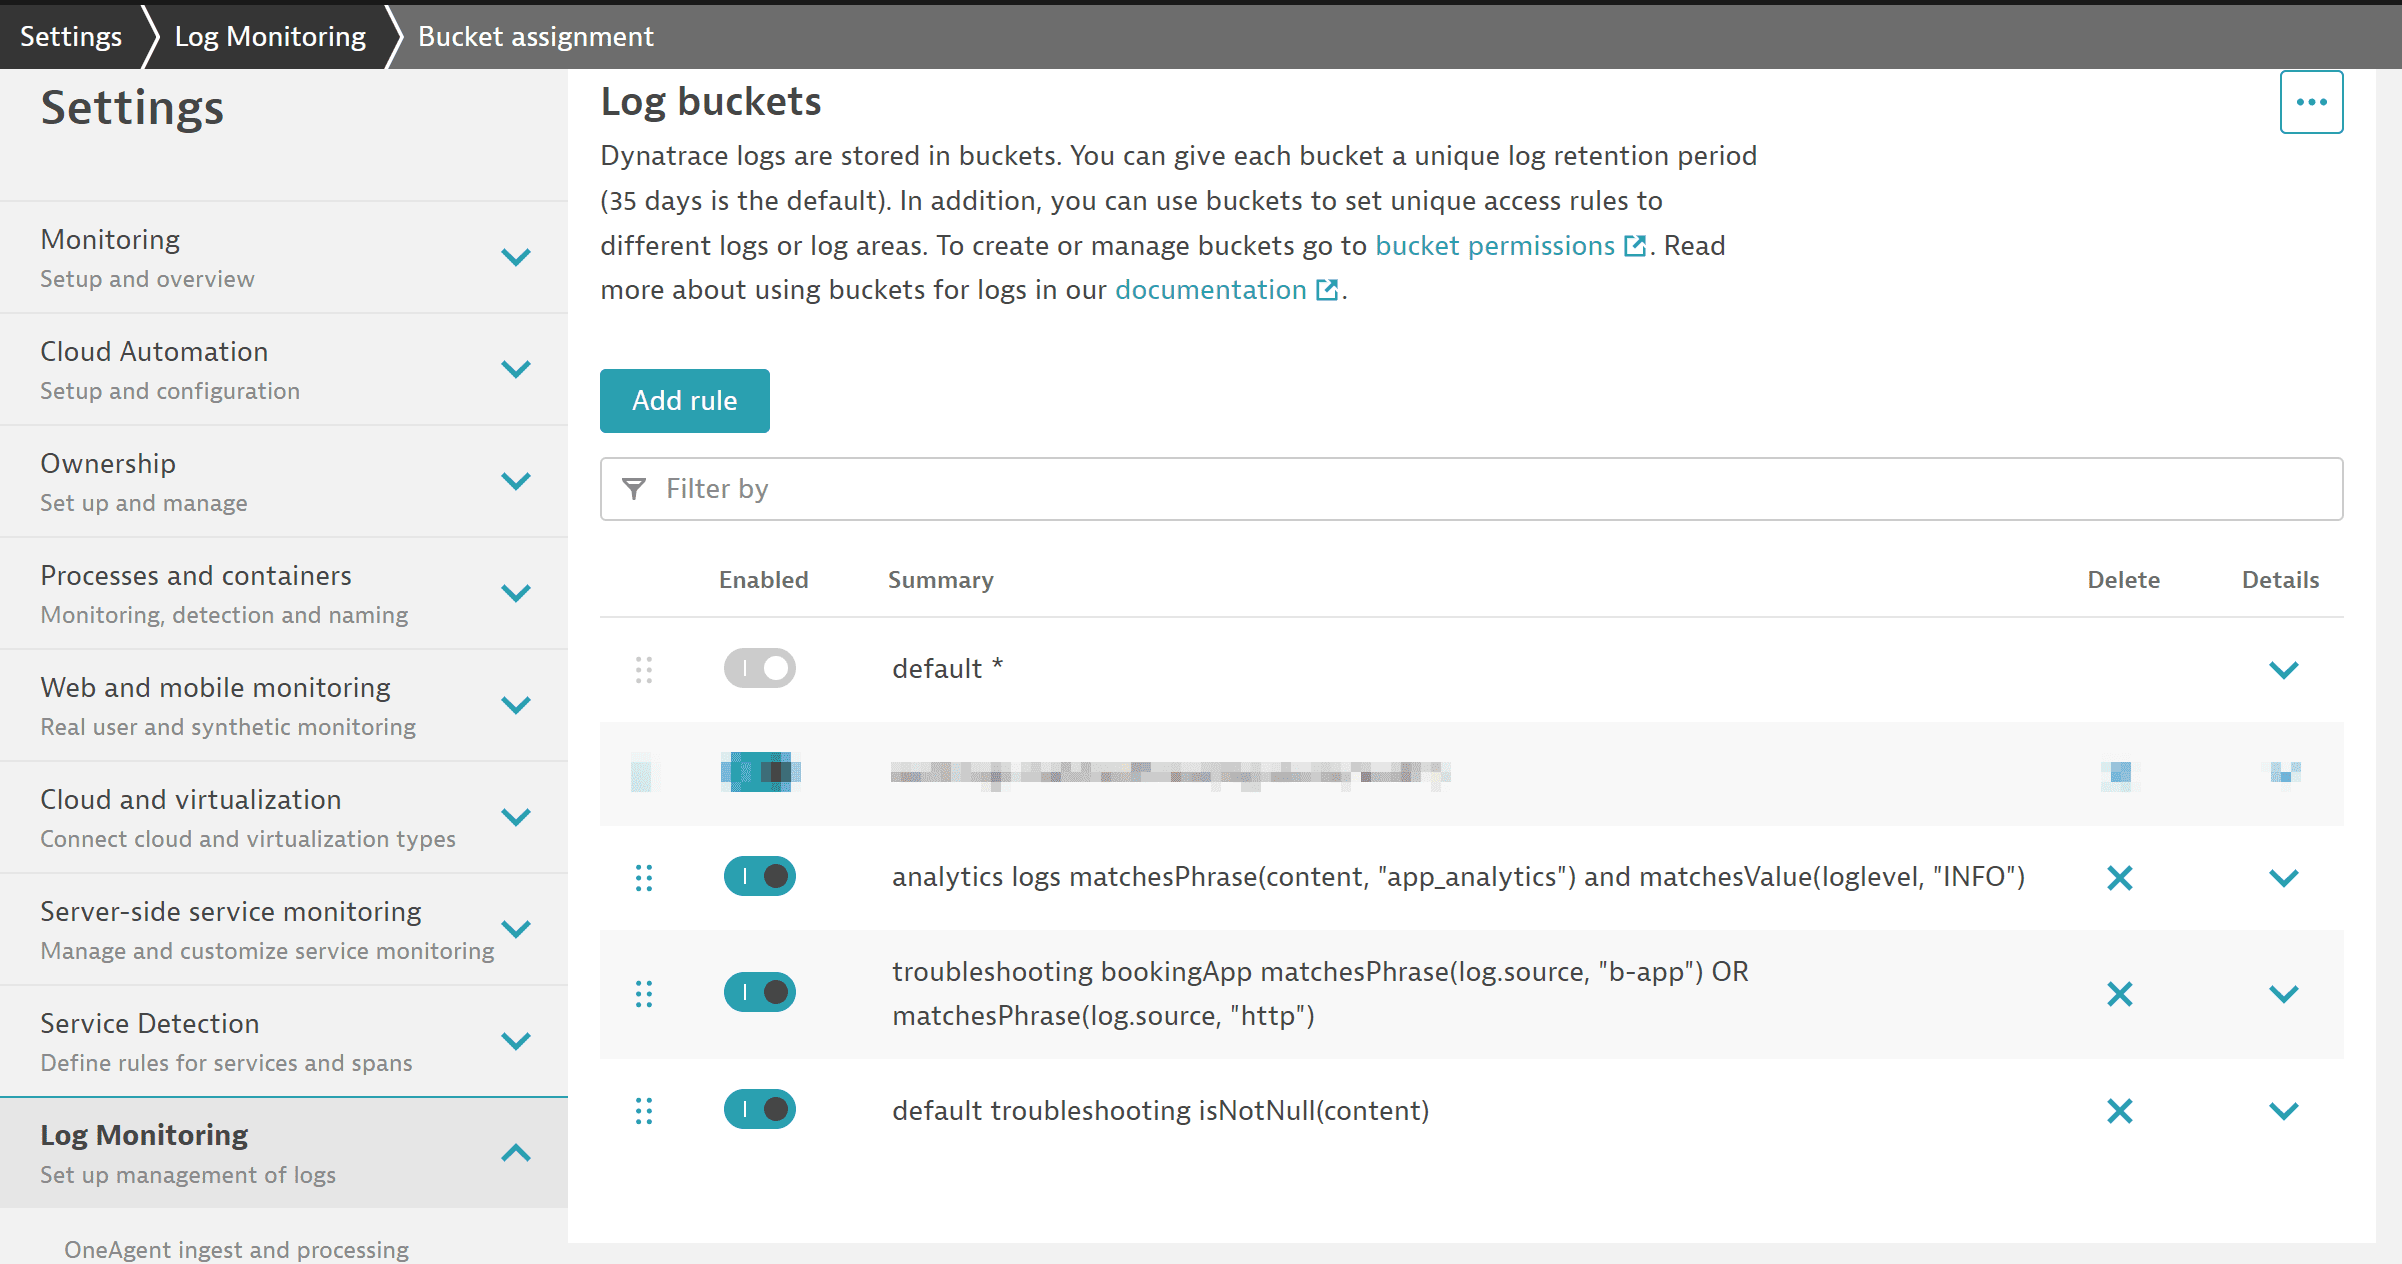 Log bucket
The log files stored in our three buckets (two custom buckets plus the default log bucket) can be accessed by all developers, and we need to set the right permissions to access these buckets.
This is the needed policy:
ALLOW storage:buckets:read WHERE storage:bucket-name STARTSWITH "log_sec_dev";ALLOW storage:buckets:read WHERE storage:bucket-name = "default_logs";ALLOW storage:logs:read;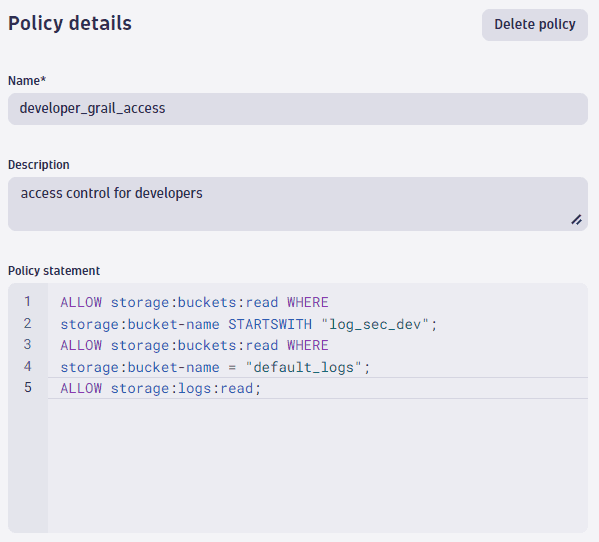 Policy
If you look to the policy statement, you can identify the
STARTSWITHcondition. The naming pattern we used for our buckets starts with the data typelogfollowed by the security level, wheresec_devis for developers. In that way, can reduce the different policies needed.Suppose you also have event, span, and even business event data, and you allow all developers to access this data. By removing the data type
log_from the bucket name, you can write a simple policy allowing access to all buckets that start withsec_dev.How whould you deal with log lines to which only specific persons should have access, and you need it for even a longer period? A typical example would be access logs.
Once again, we create a bucket for 3 years and a log matcher for storing these specific logs in the bucket and we create a policy for data access.
- Bucket name:
log_sec_high_3y(sec_highis the naming pattern for high security) - Assignment rule for our audit logs:
matchesPhrase(log.source, "audit")
- Policy:
ALLOW storage:buckets:read WHERE storage:bucket-name STARTSWITH "log_sec_high";
- Bucket name:
Data segmentation
What's the difference between management zones and new segments?
- Current management zone concept
Indirectly filter monitoring data based on entity IDs of precalculated management zones.
- Segments for structuring data in Grail
Segment data through reusable filter conditions to analyze monitoring data in real-time.
After having organized monitoring data in Grail buckets and mastered the setup of IAM policies, giving users access to data they need, the final step is to understand how monitoring data can be filtered in the latest Dynatrace.
Segments mirror management zones in some ways, in that they allow you to abstract complex filter conditions and perform lookups to the monitored entity model. Segments, however, are no longer precalculated attributes, but query-time filter conditions instead. This solves the performance bottleneck of management zones, making it possible to both ingest and analyze several orders of magnitude higher volumes of monitoring data in the latest Dynatrace.
For more information, see Segments.
FAQ
When we store our data now in four buckets, how does this affect my users? Do they need to know the buckets?
As described in the Grail Data Model reference, buckets are assigned to tables. Because our four custom buckets with log data are assigned to the log table, you can access all data in this table via fetch logs. There is no need for a user to select a bucket (or, as in other products, an index). Developers will of course get only data from the buckets log_sec_dev_analytics_1y,log_sec_dev_troubleshoot_14d, and default_logs, and not from log_sec_high_3y because of our policy definitions.
Is there a value in filtering on a bucket, and how can it be done?
Yes, it is always good practice to narrow down the data you want to analyze or search for specific terms.
Adding a bucket filter is an effective way to speed up a query and reduce the scanned bytes. Depending on your data volume this might not always be perceptible.
To filter on our troubleshooting logs, we can add this filter criteria:
fetch logs| filter dt.system.bucket == "log_sec_dev_troubleshoot_14d"
Are there any other reasons why I need different log buckets?
Grail is built for storing and querying the data with hyper-scale data processing. If you use bucket filters for your data queries, it will speed up queries, but the number of buckets is limited per environment to 80.
Data can't be moved between buckets. Keep this in mind if:
- There is any reason to physically separate data and ensure that the cost of queries must be divided and managed across multiple subdivisions/departments.
- Your organization is split into different business units with hard requirements to manage and observe the usage and cost of each dedicated business unit.
- There are different deployment stages for a large system.
- There is data that needs to be deleted together or data where you might need to delete specific records on request like "Data Subject Rights".
Example:
- Business units A and B each deliver independent value to your customers/users.
- Both are composed of DevSecOps teams as well as pure consumers of reports/dashboards.
- The departments should be isolated in terms of data access and product usage, and must not see each other's data.
To ensure that data ingestion from unit A does not affect the query costs or performance of unit B, set up dedicated buckets for each business unit.
You should not use Grail buckets for data separation on dynamic dimensions, such as creating buckets for host groups or teams. You can filter the data on other dimensions.
If you need to restrict access within buckets, you can use record-level permissions.
Is there a way to restrict access within buckets or even tables?
Record permissions are the right way to implement fine-grained access control and restrict data access further. You can either use the defined dedicated fields, like event.kind or k8s.namespace.name, for creating policies, or you can add a field/dimension dt.security_context for access control on any values such as team names.
If you look back at our examples, we defined a policy that allows every developer to access logs stored in the default bucket and buckets starting with the naming pattern: log_sec_dev.
Suppose a new external team will work for the next 18 months on a project and you only want to expose logs that are tagged with their team name: extDev. To do so, make sure that the dt.security_context is set on their log lines, and create an additional statement:
ALLOW storage:buckets:read WHERE storage:bucket-name STARTSWITH "log_sec_dev";ALLOW storage:buckets:read WHERE storage:bucket-name = "default_logs";ALLOW storage:logs:read;ALLOW storage:logs:read WHERE storage:dt.security_context=`"extDev";
You can use OneAgentCtl to set dt.security_context as a host tag on OneAgent-monitored hosts:
./oneagentctl --set-host-tag=dt.security_context=my_security_context
Can I also use the same concepts for metrics?
Custom buckets are currently not available for metrics, but they are planned. Today, metrics in Grail are always stored in the default bucket with a retention of 15 months. In the future, you will be able to extend the 15 months and be able to use custom buckets for metrics.
Record permissions can also be used for metrics on the supported fields
or by using the dt.security_context.
What's next?
After your environment is set up and ready for your teams, start exploring the new user interface, apps, and learn how to upgrade some of the current capabilities to the new platform.
Dynatrace UI
Apps
 Dashboards
  Notebooks
  Workflows
  Kubernetes
  Site Reliability Guardian
  DevSecOps Lifecycle Coverage with Snyk
  Investigations
  Business Flows
  Cost & Carbon Optimization
  Salesforce Insights
  Clouds
  Infrastructure & Operations
  Databases
 Upgrade
Additional resources
Check the following additional resources available across various Dynatrace self-service channels.
Dynatrace University
See some of the on-demand courses related to the latest Dynatrace. Login required,
Product news
Starting with DQL
For more videos, see the Learning Dynatrace Query Language playlist
What is Dynatrace and how to get started
For more videos, see Dynatrace Observability Clinics playlist
Dynatrace Playground environment
Go to the Dynatrace Playground environment and get a hands-on experience using the latest Dynatrace.