Visualize your environment topology through Smartscape
- 8-min read
- Published Jul 19, 2017
Smartscape, our near real-time environment-topology visualization tool, is one of the most powerful features of Dynatrace.
Smartscape auto-discovery delivers a quick and efficient visualization of all the topological dependencies in your infrastructure, processes, and services:
- On the vertical axis, it displays full-stack dependencies across all tiers
- On the horizontal axis, it visualizes all ingoing and outgoing call relationships within each tier
With just a few clicks, Smartscape gives you access to a detailed topological view of your entire environment, giving you more insight into and control over your environment.
- Make better decisions, such as adjusting your service architecture or infrastructure to improve application performance.
- Examine cross-tier and same-tier process, host, and service interdependencies to better understand how dependencies affect the performance of your applications.
- Drill down to gain clearer insight into problems. For example, Dynatrace might identify an issue with third-party dependencies and help you understand the impact of the issue on your application's performance.
Access Smartscape
To access the Smartscape environment-topology view, go to Smartscape Topology.
To start, select the view you want to see:
- Select Show problems to display a topology of problems
- Select Show third-party vulnerabilities and specify risk levels (you can select more than one) to display a topology of third-party vulnerabilities
Problems
When Show problems is selected, each Smartscape tier includes a dedicated tab with a health indicator. Select the tier at which you want to view the topology:
- Applications
- Services
- Processes
- Hosts
- Data centers
Each tier shows a different entity type: application, service, process, host, or data center.
- To view a different tier, select that tier's tab.
- To zoom in and out, use the +/- buttons at the top-right corner or rotate the mouse wheel.
- To shift your view to a different position, select and drag anywhere in Smartscape.
- To view the name of an entity, hover your cursor over the entity's symbol. While the name is displayed, you can select the arrow next to the entity name to go to that entity's overview page.
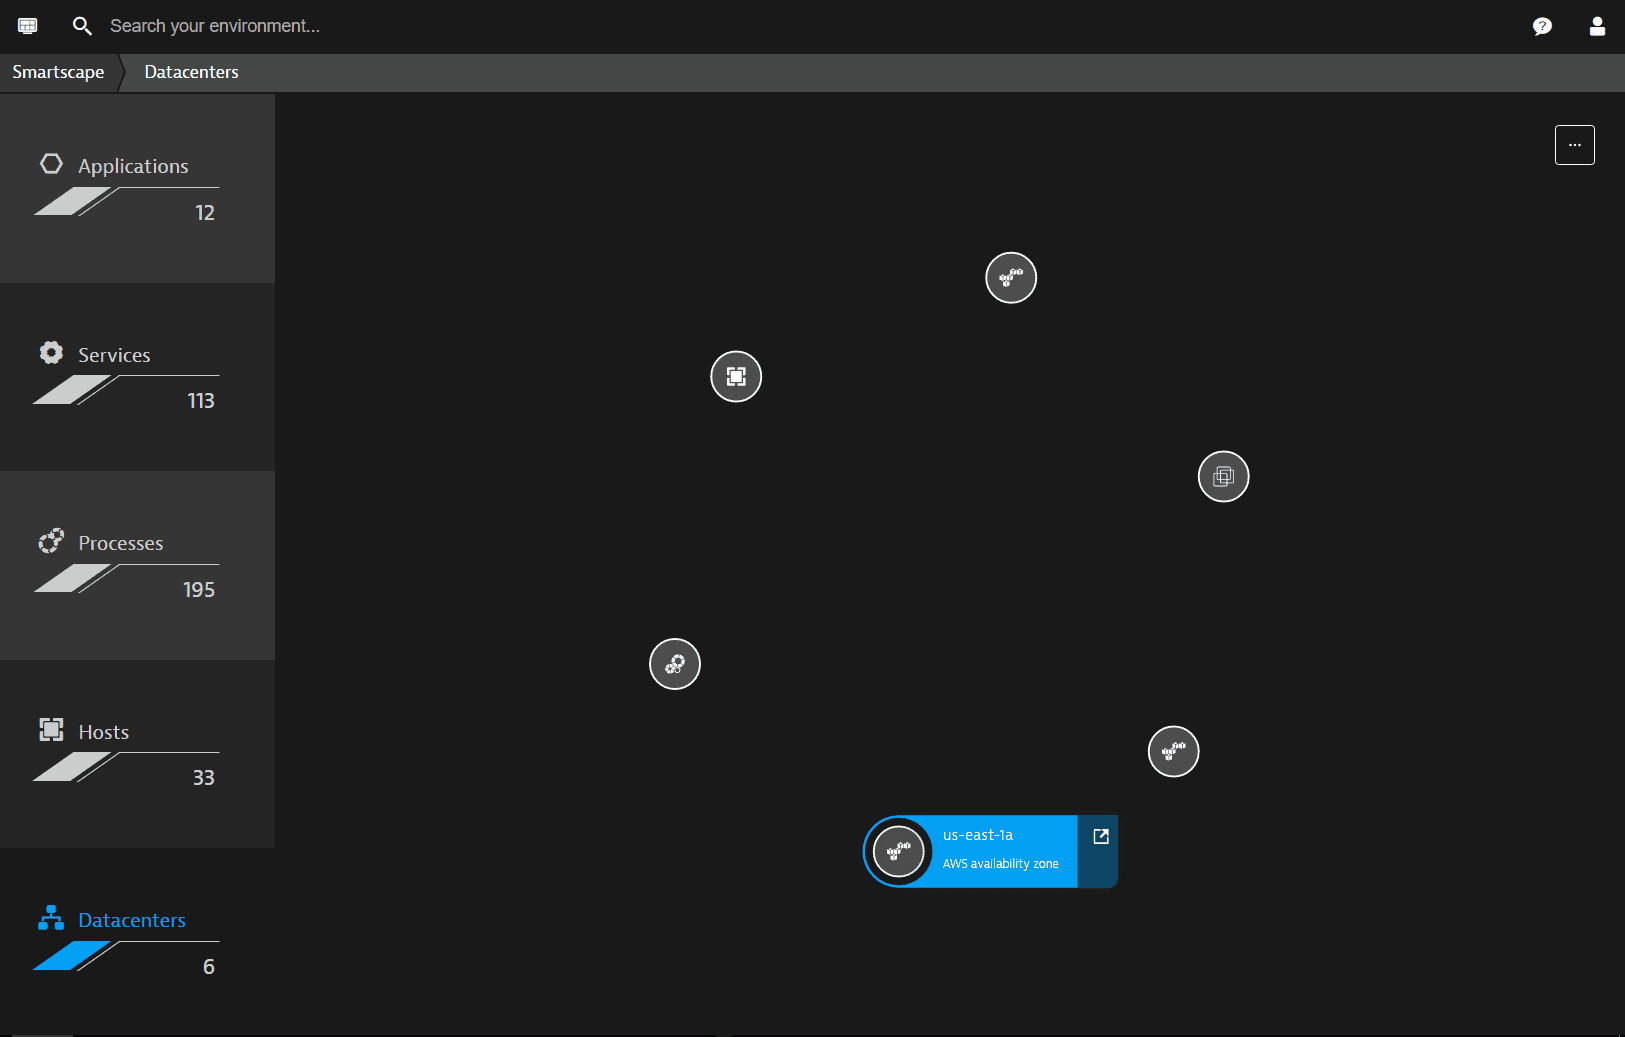
In the first example image below:
- The Hosts tier displays a health status of 1/33, meaning there are 33 monitored hosts and 1 of them has a problem.
- The other four tiers (Applications, Services, Processes, and Data centers) in this example show only the number of entities on each tier, because all the entities on those tiers are healthy.
Smartscape displays data from the past 72 hours and therefore can't be adjusted using the timeframe selector. To view the dependencies among entities of the same tier, just select the associated tab on the left.
Applications
In this example, the Applications tab is selected and the 12 detected applications in this environment are displayed on the right.
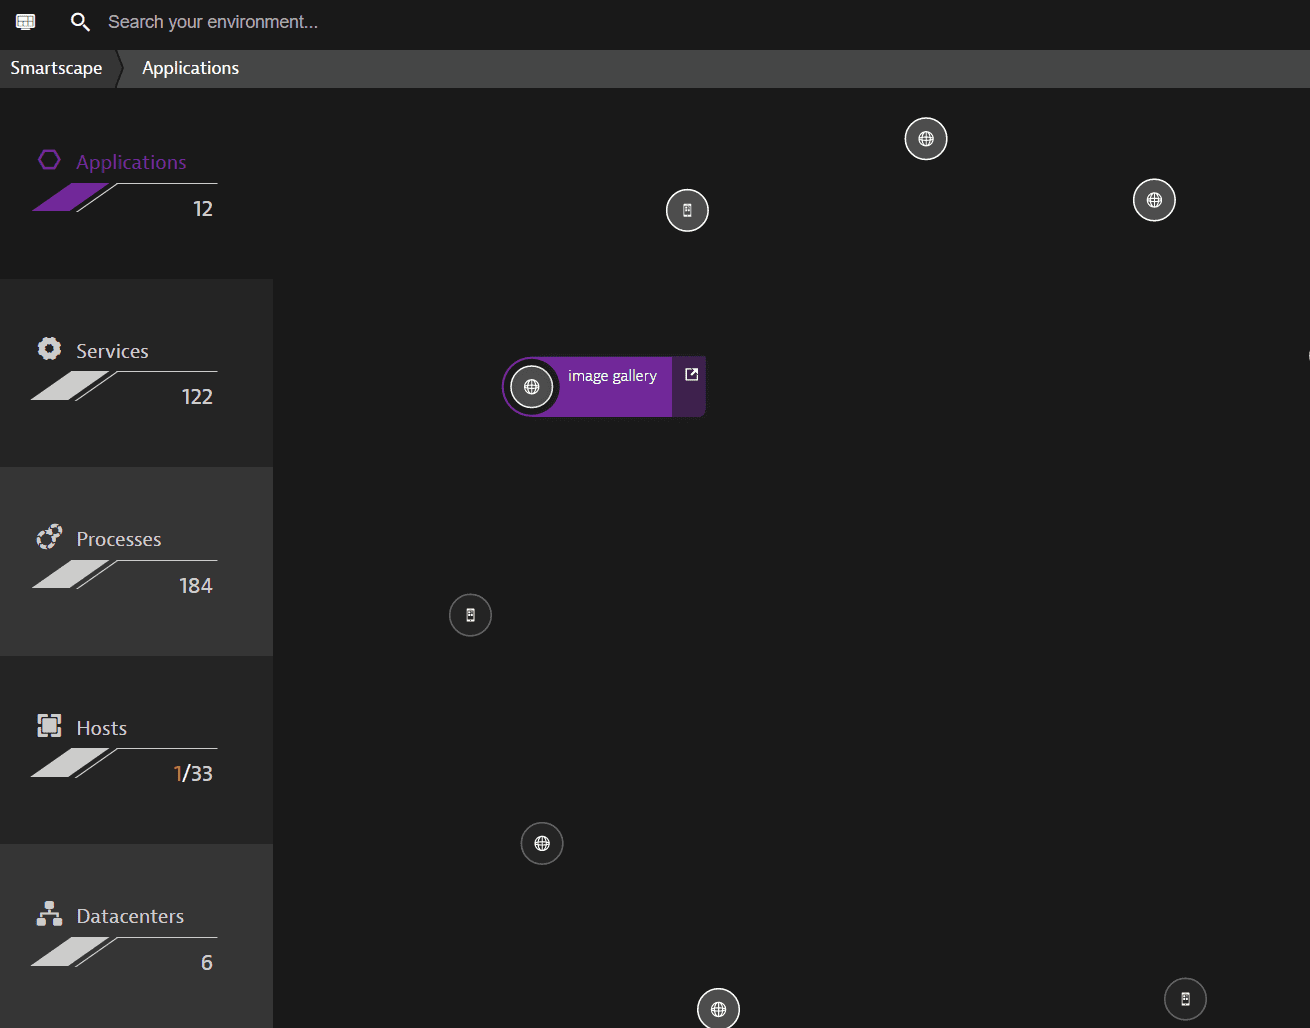
Dynatrace supports monitoring of web-based applications and mobile apps. The node symbols indicates the application type:
| Icon | Meaning |
|---|---|
 | Web application |
 | Mobile app |
There are no application connections or dependencies because, in Dynatrace, applications are viewed from the perspective of the user and therefore only constitute user endpoints. Therefore, multiple applications may use the same services, but applications can't be connected directly to one another.
Services
The Services tab displays the topology of all the services that are running in your environment.
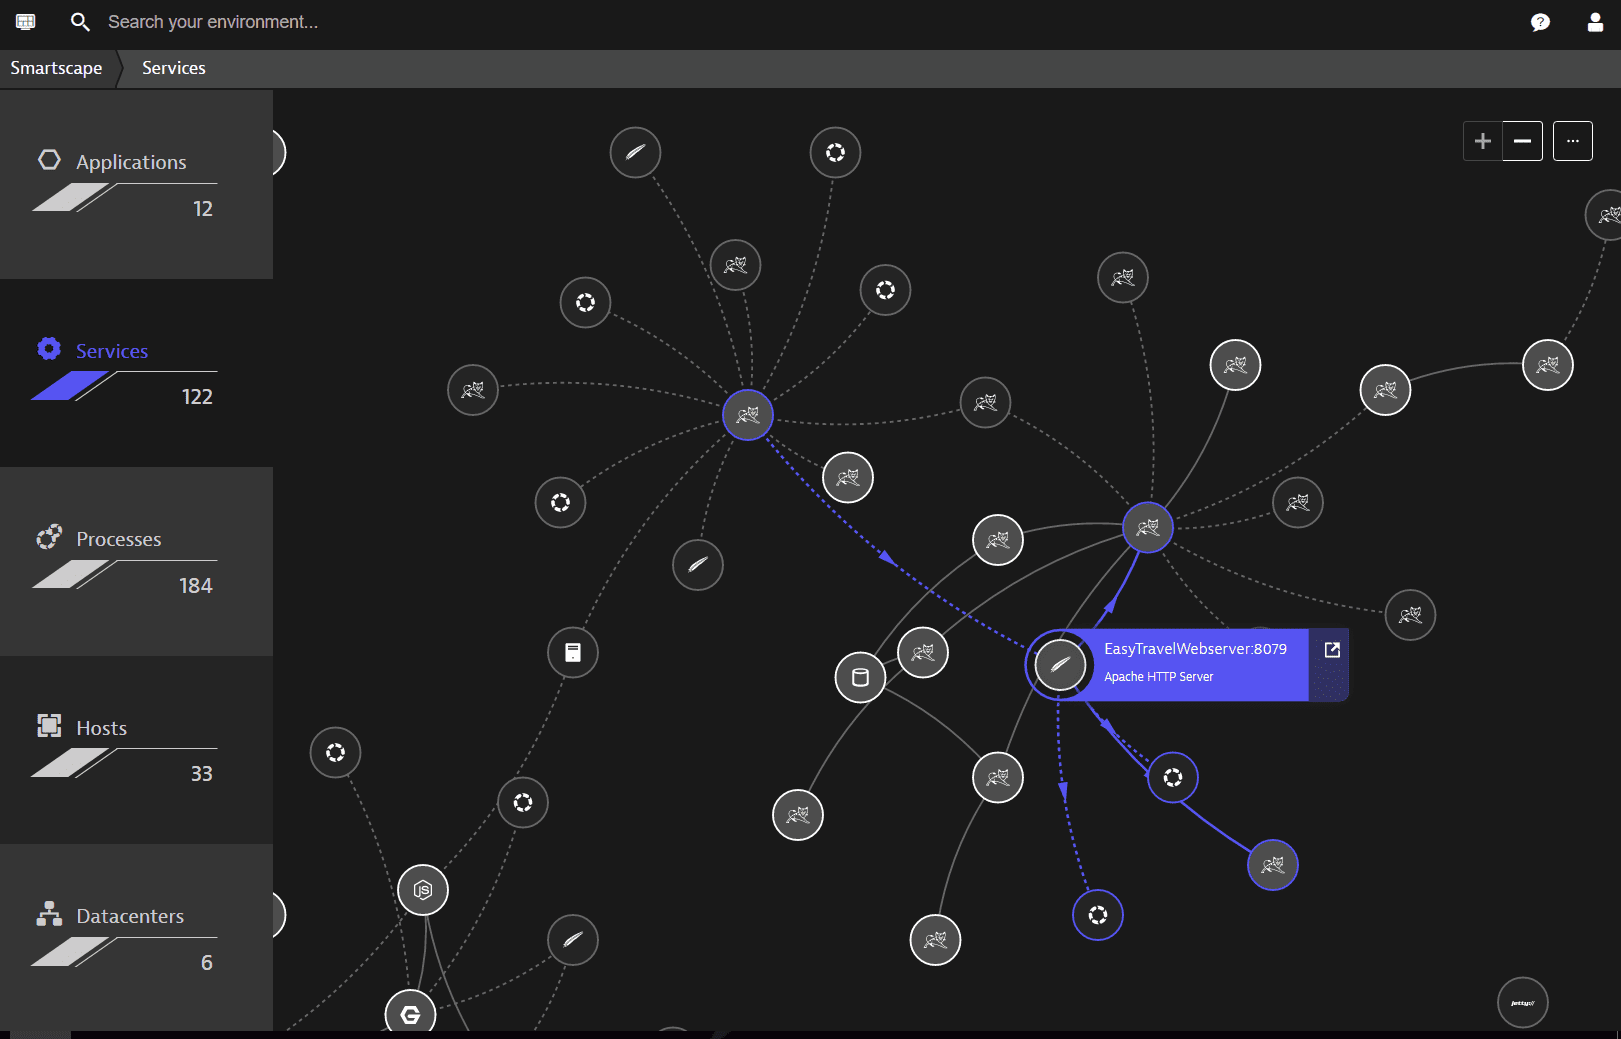
Nodes
Each node represents a different service with a symbol that signifies the underlying service type.
| Icon | Meaning |
|---|---|
| see example above | Commercial logos such as the MySQL dolphin, Apache feather, and Tomcat cat indicate service technologies supported by Dynatrace. |
 | Services of unrecognized technologies are depicted using a generic service symbol. These are typically opaque services. |
Connections
- Arrows on connection lines to and from the selected service indicate whether they're incoming or outgoing service calls.
- A dashed connection line indicates that there has been no request between the two services during the last two hours, or that a service hasn't forwarded or received anything during the last two hours.
- A connection ages out and is no longer shown in Smartscape if the connection has been inactive for more than 72 hours or if a service hasn't received any load during the last 72 hours.
Filtering your display
Open the Browse (…) menu in the upper-right corner of Smartscape to hide or show:
- Inactive requests
- Services that aren't connected to other services
Note that you might observe a difference in the number of services presented in Services tab of the Smartscape topology page versus the Services page. This is because Smartscape takes a broader scope of service categories into account.
Processes
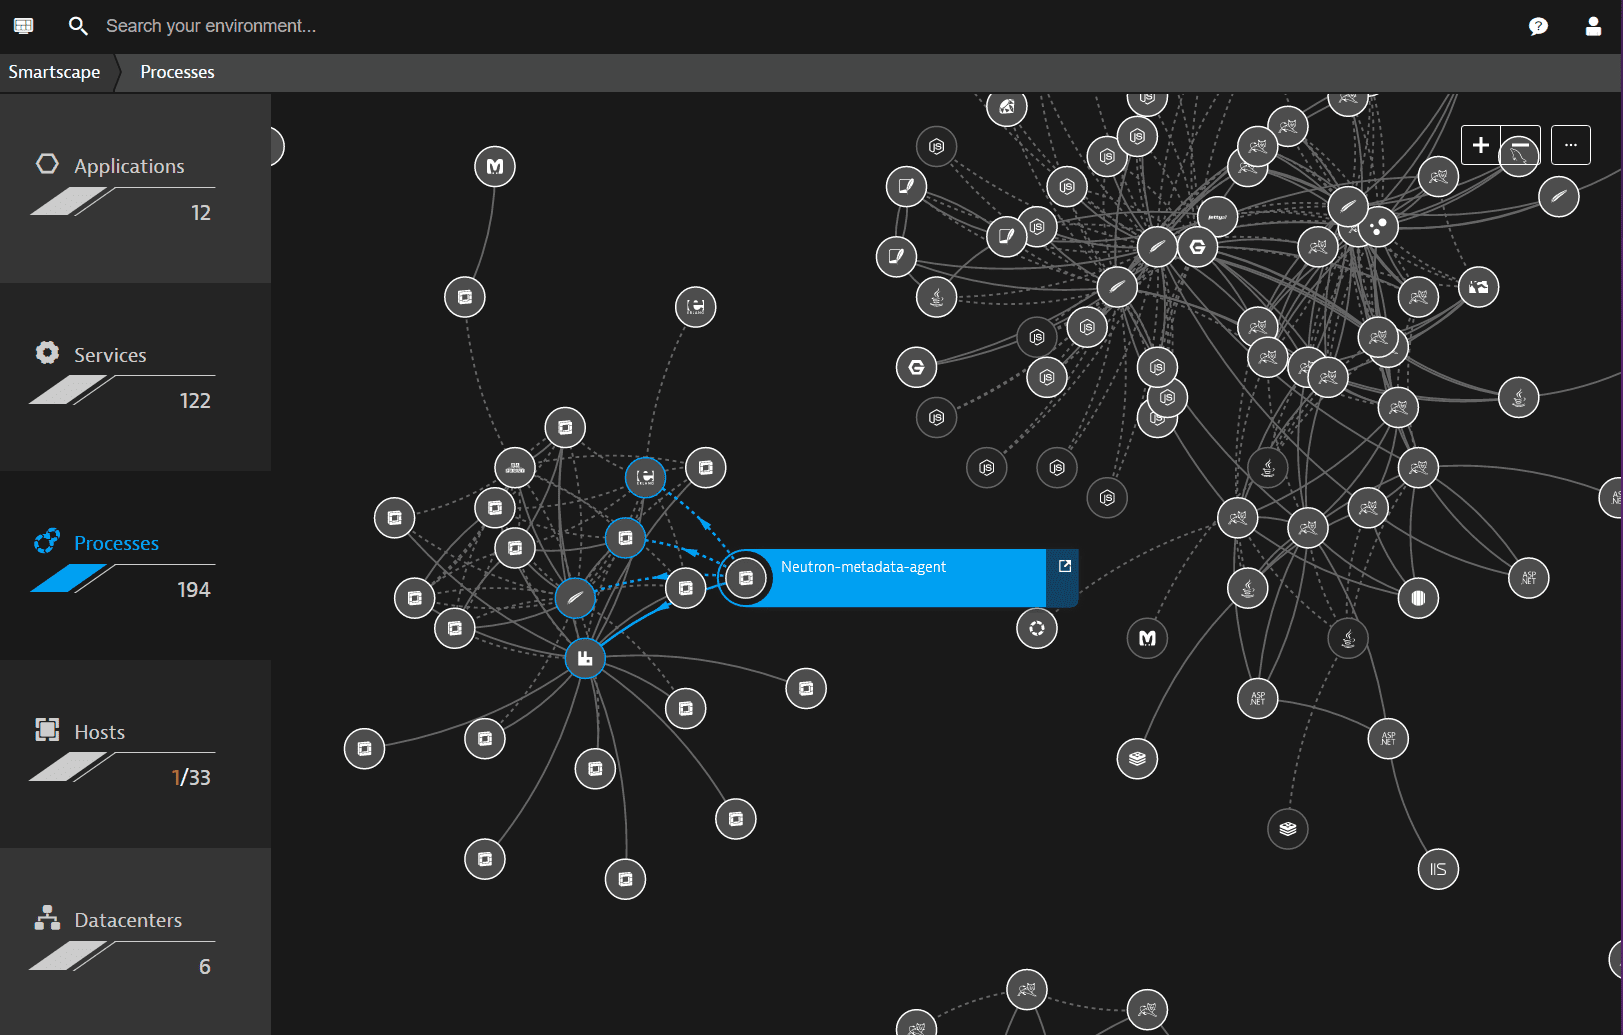
The Processes tab provides a visualization within which each node corresponds to a process and each connection represents a TCP/IP request.
- Not all processes running in your environment are shown because the number of running processes is often quite high. For clarity, only the most important processes are shown.
- Dashed lines show connections between processes that are inactive or have timed out.
Hosts
The Hosts tab shows the topology of your infrastructure from the perspective of your hosts.
- Connections represent TCP/IP requests.
- Hosts, whether physical or virtual machines, are signified with the commercial logos of the host operating systems.
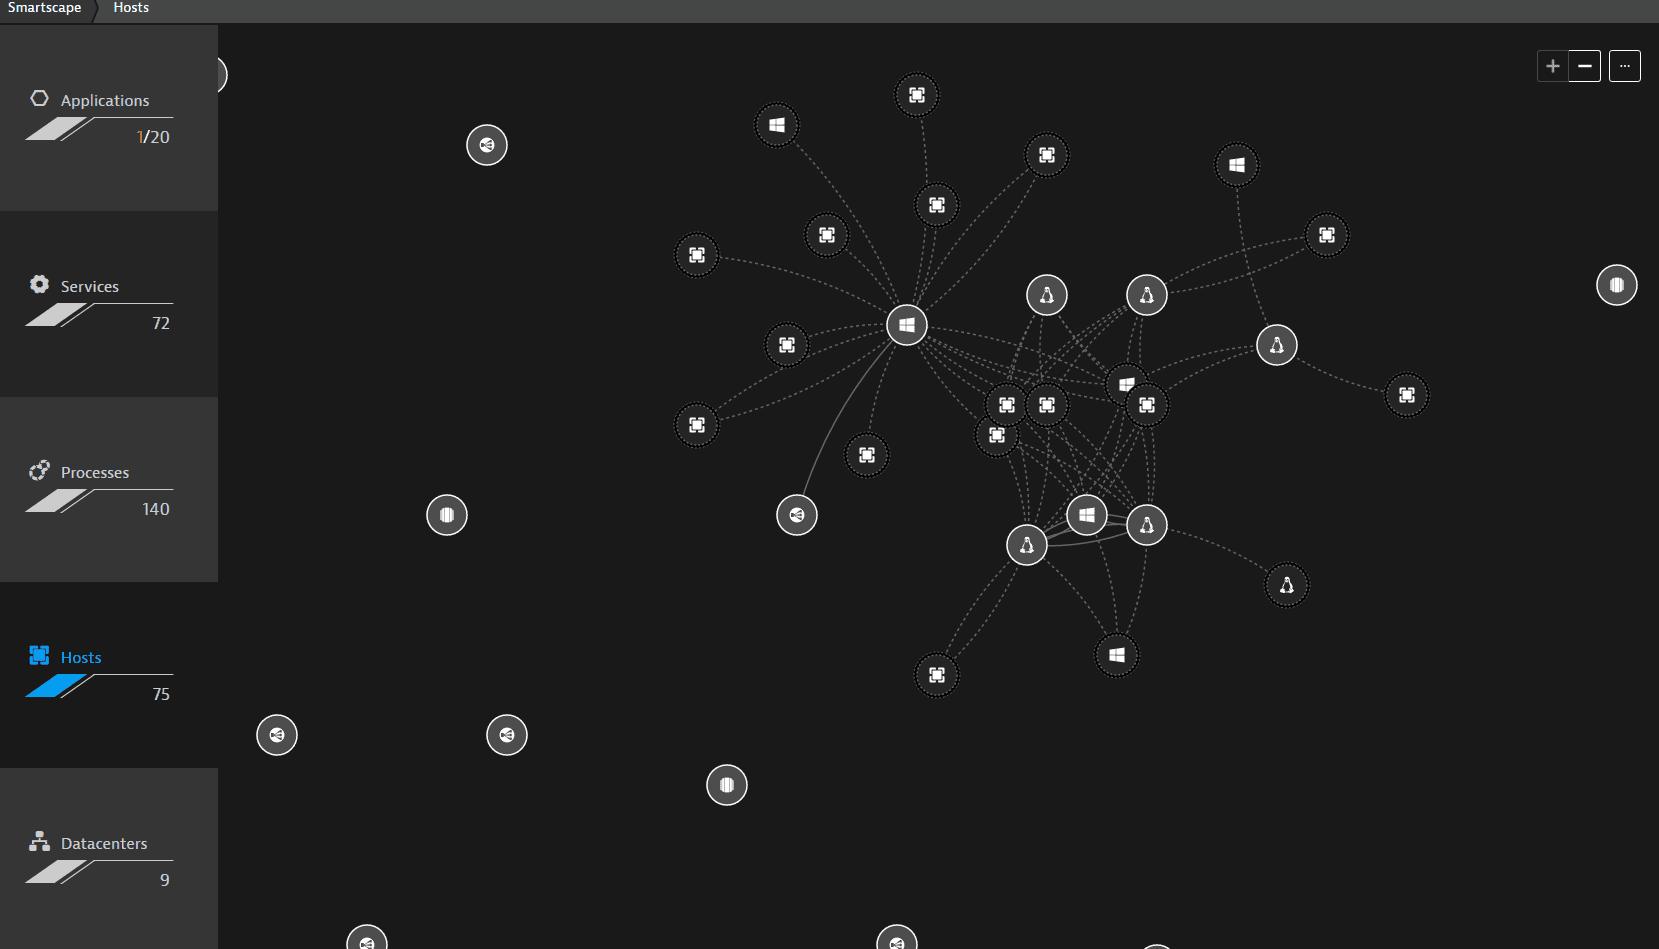
Generic host symbols are used to signify monitoring candidates (unknown hosts that are detected because they receive TCP/IP requests from monitored hosts). We recommend that you install Dynatrace OneAgent on monitoring candidates in your environment whenever possible.
| Icon | Meaning |
|---|---|
 | monitoring candidate |
Inactive monitoring candidates are monitoring candidates that haven’t communicated with a host. Inactive connections between hosts and connections that have timed-out are visualized with dashed lines.
Data centers
The Data centers tab displays nodes that indicate where your hosts reside. If you have physical servers in your infrastructure, the corresponding data center nodes indicate the cities where the data centers are located. These are signified with generic host icons.
If you use virtual servers or you have a PaaS-based infrastructure, the data center nodes will be labeled accordingly (for example, VMware data center, AWS Availability Zone, or Azure region) and visualized with the corresponding company logos.
Cross-tier interconnections
To view cross-tier connections, select any entity in any Smartscape tier. The vertical dependencies of the entity are then displayed on the left.
In this example, a web application called easytravel-dynatrace-dev is selected. On the left you can see how the application dependencies extend downward to the data centers tier.
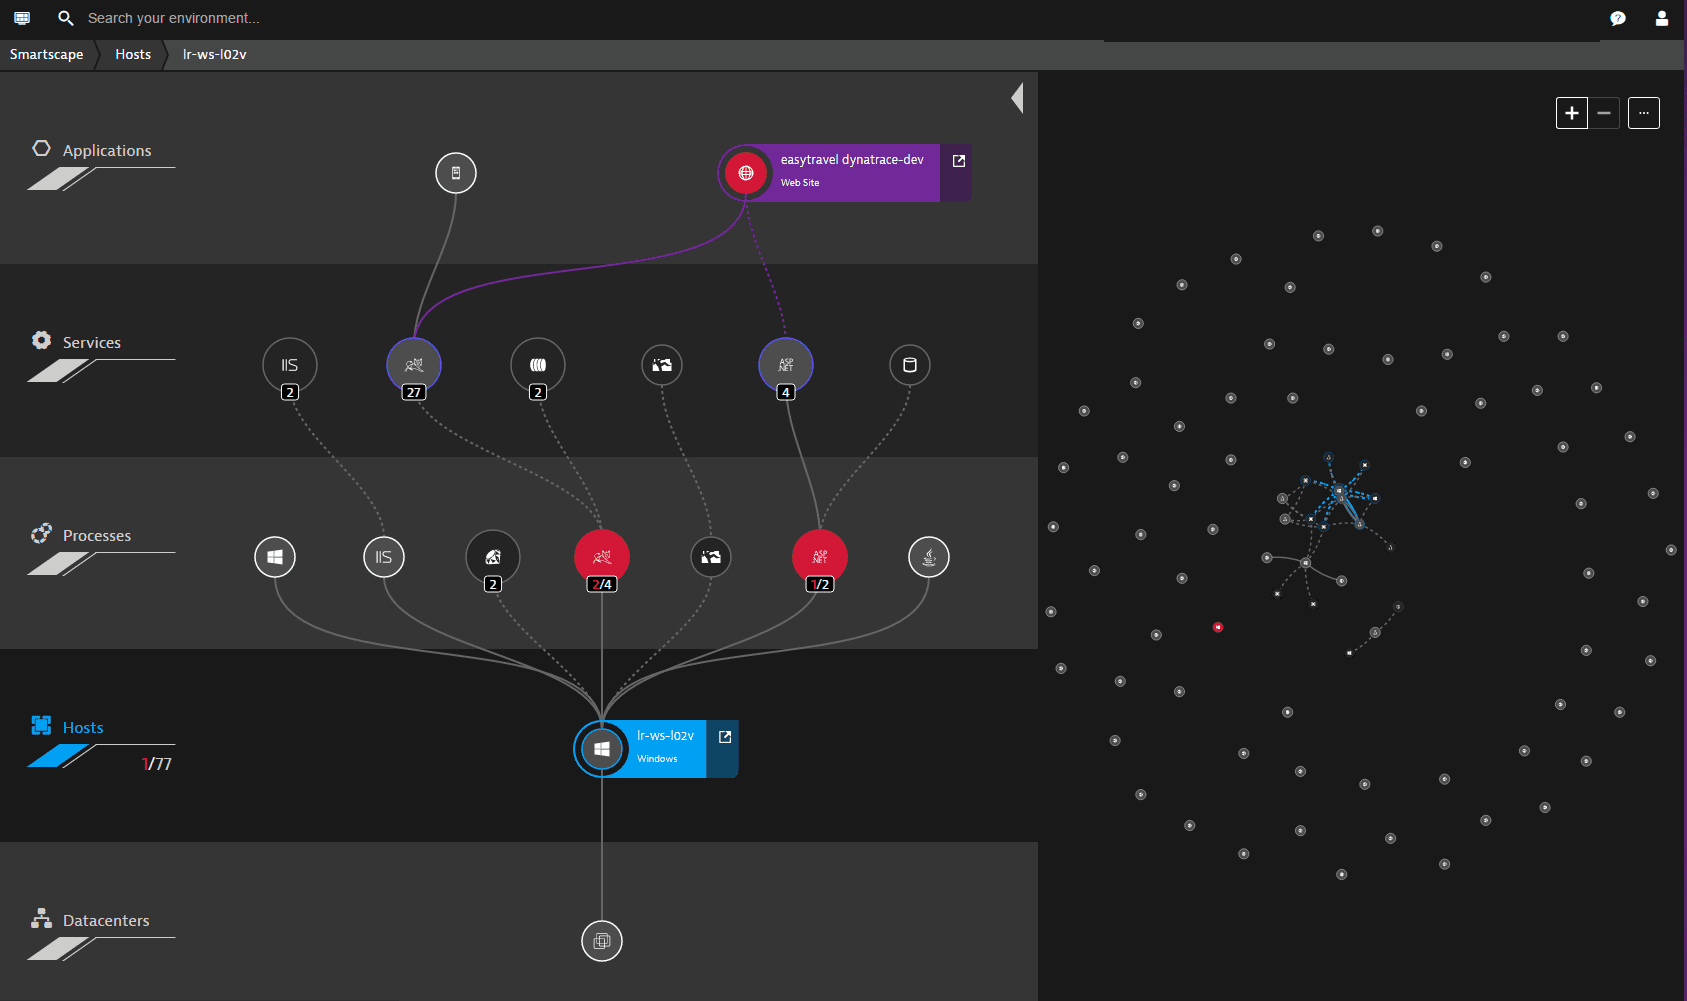
The easytravel-dynatrace-dev application is red because it's experiencing a problem. Moving downward through the related dependencies, we can see that this application calls 27 Tomcat services and 4 ASP/.NET services. These services run on processes of the same technology types (those shown in red are experiencing problems). You can see that these processes reside on a Windows-based host called lr-ws-l02v (to see this detail, hover your cursor over the host node). Because the unhealthy processes are running on this host, this host is also unhealthy (note the red 1 on the Hosts tile on the left).
This example reveals how you can easily discover the root cause of a problem and reduce problem resolution time by exploring the related entities in Smartscape.
Third-party vulnerabilities
When Show third-party vulnerabilities is selected in Smartscape, select Risk level to specify the risk levels you want to display. You can select more than one checkbox.
- On the left side, the vertical column shows the number of affected nodes in red and the total count of nodes in gray on the processes and hosts layers.
- On the topology, affected nodes are displayed in the color of the risk level:
- Dark red for
Critical - Red for
High - Yellow for
Medium - Blue for
Low
- Dark red for
To see vulnerabilities for affected entities, switch to the Processes or Hosts tier. (Vulnerabilities can be related to an application, service, or data center, but they don't impact them directly. Only processes or hosts can be impacted.)
- To zoom in and out, use the +/- buttons in the upper-right corner or rotate the mouse wheel.
- To shift your view to a different position, select and drag anywhere in Smartscape.
- To view the name of an entity, hover your cursor over the entity's symbol. While the name is displayed, you can select the arrow next to the entity name to go to that entity's overview page.
- To view cross-tier connections, select any entity. The panel on the left expands to display the vertical dependencies of the entity.
For more information on managing third-party vulnerabilities, see Third-party vulnerabilities.