Which are the most important processes?
- Dynatrace Classic
- How-to guide
- 2-min read
To view the most important processes running on a specific host, go to  Hosts Classic and select a host to go to the host overview page. Locate the Process analysis section, where you'll find charts and lists of the processes running on the selected host.
Within the Process analysis section, you can also see various process group instances categorized by technology type.
For more details, refer to Process analysis.
For processes to be visible in this section, they have to meet at least one of the following criteria:
-
Processes that are supported applications.
-
Processes with an open TCP listening port
-
Processes for which one of the following conditions is met for at least 3 of the last 5 one-minute intervals:
- Avg(CPU) > 5%
- Max(Memory) > 5%
- Network Traffic > 5%.
-
Processes that have been defined by a user as important, for example, by enabling Log Monitoring for a process.
Dynatrace provides also the option of monitoring specific processes that fall into neither of these categories.
Any processes that do not meet the above criteria, and therefore are not considered important processes, are aggregated and labeled as Other processes.
Process group details
The process list provides basic information about system and network resources that are consumed by the process.
| Resource | Description |
|---|---|
| CPU usage | CPU percentage consumed by the process. |
| Memory usage | System memory percentage consumed by the process. |
| Traffic | Network traffic to and from the process. |
| Retransmissions | Retransmitted (either direction). |
| Connectivity | Connectivity is a percentage of successfully established TCP sessions minus the sum of TCP connection refused (as percentage) and TCP connection timeouts (as percentage). |
Why does Dynatrace not show worker processes?
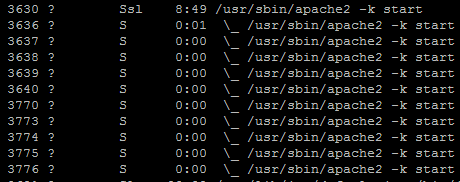
If you run Apache HTTP Server, for example, you may be accustomed to seeing long lists of worker processes (see example below). Here you see numerous Apache HTTP Server processes listed on a Linux terminal. For the sake of clarity and manageability however, Dynatrace consolidates such lists into process group instances. We do this across hosts but also on individual hosts.
