Databases
- Latest Dynatrace
- App
- 8-min read
The Dynatrace  Databases enables you to monitor, analyze, and optimize database environments with clarity and control. It offers detailed insights into performance, health, and configuration, helping you identify issues early and maintain reliable operations.
Prerequisites
Before you begin, ensure these requirements are met:
-
ActiveGate configuration
- Assign one or more ActiveGate group to connect to the target database servers remotely.
-
Required components
- For databases requiring additional components (for example, JDBC drivers), install them on all designated ActiveGates according to the extension guidelines.
-
Network and permissions
- Validate network connectivity and firewall rules for each database type. ActiveGate should be able to establish a direct network connection to the database host.
- Create a monitoring user account with appropriate permissions (for example, access to system views, performance metrics, and schemas).
Permissions
Limit data access
You need basic storage:** permissions to access data from Grail.
However, for the strict access, you can create a custom policy limiting the access to the default_database_monitoring Grail bucket.
The default_database_monitoring bucket is where all the database extension—retrieved data is stored, including logs. Use the following statement to create a policy:
ALLOW storage:buckets:read WHERE storage:bucket-name = 'default_database_monitoring'
For more information see, Working with policies and Grant access to Grail.
Get started
Use Databases to gain full observability into your database environments, including health, performance, query analysis, and infrastructure context. Integrated with the Dynatrace observability ecosystem, the app delivers actionable insights that help DBAs, developers, and SREs identify issues early, optimize database performance, maintain reliability, and minimize downtime.
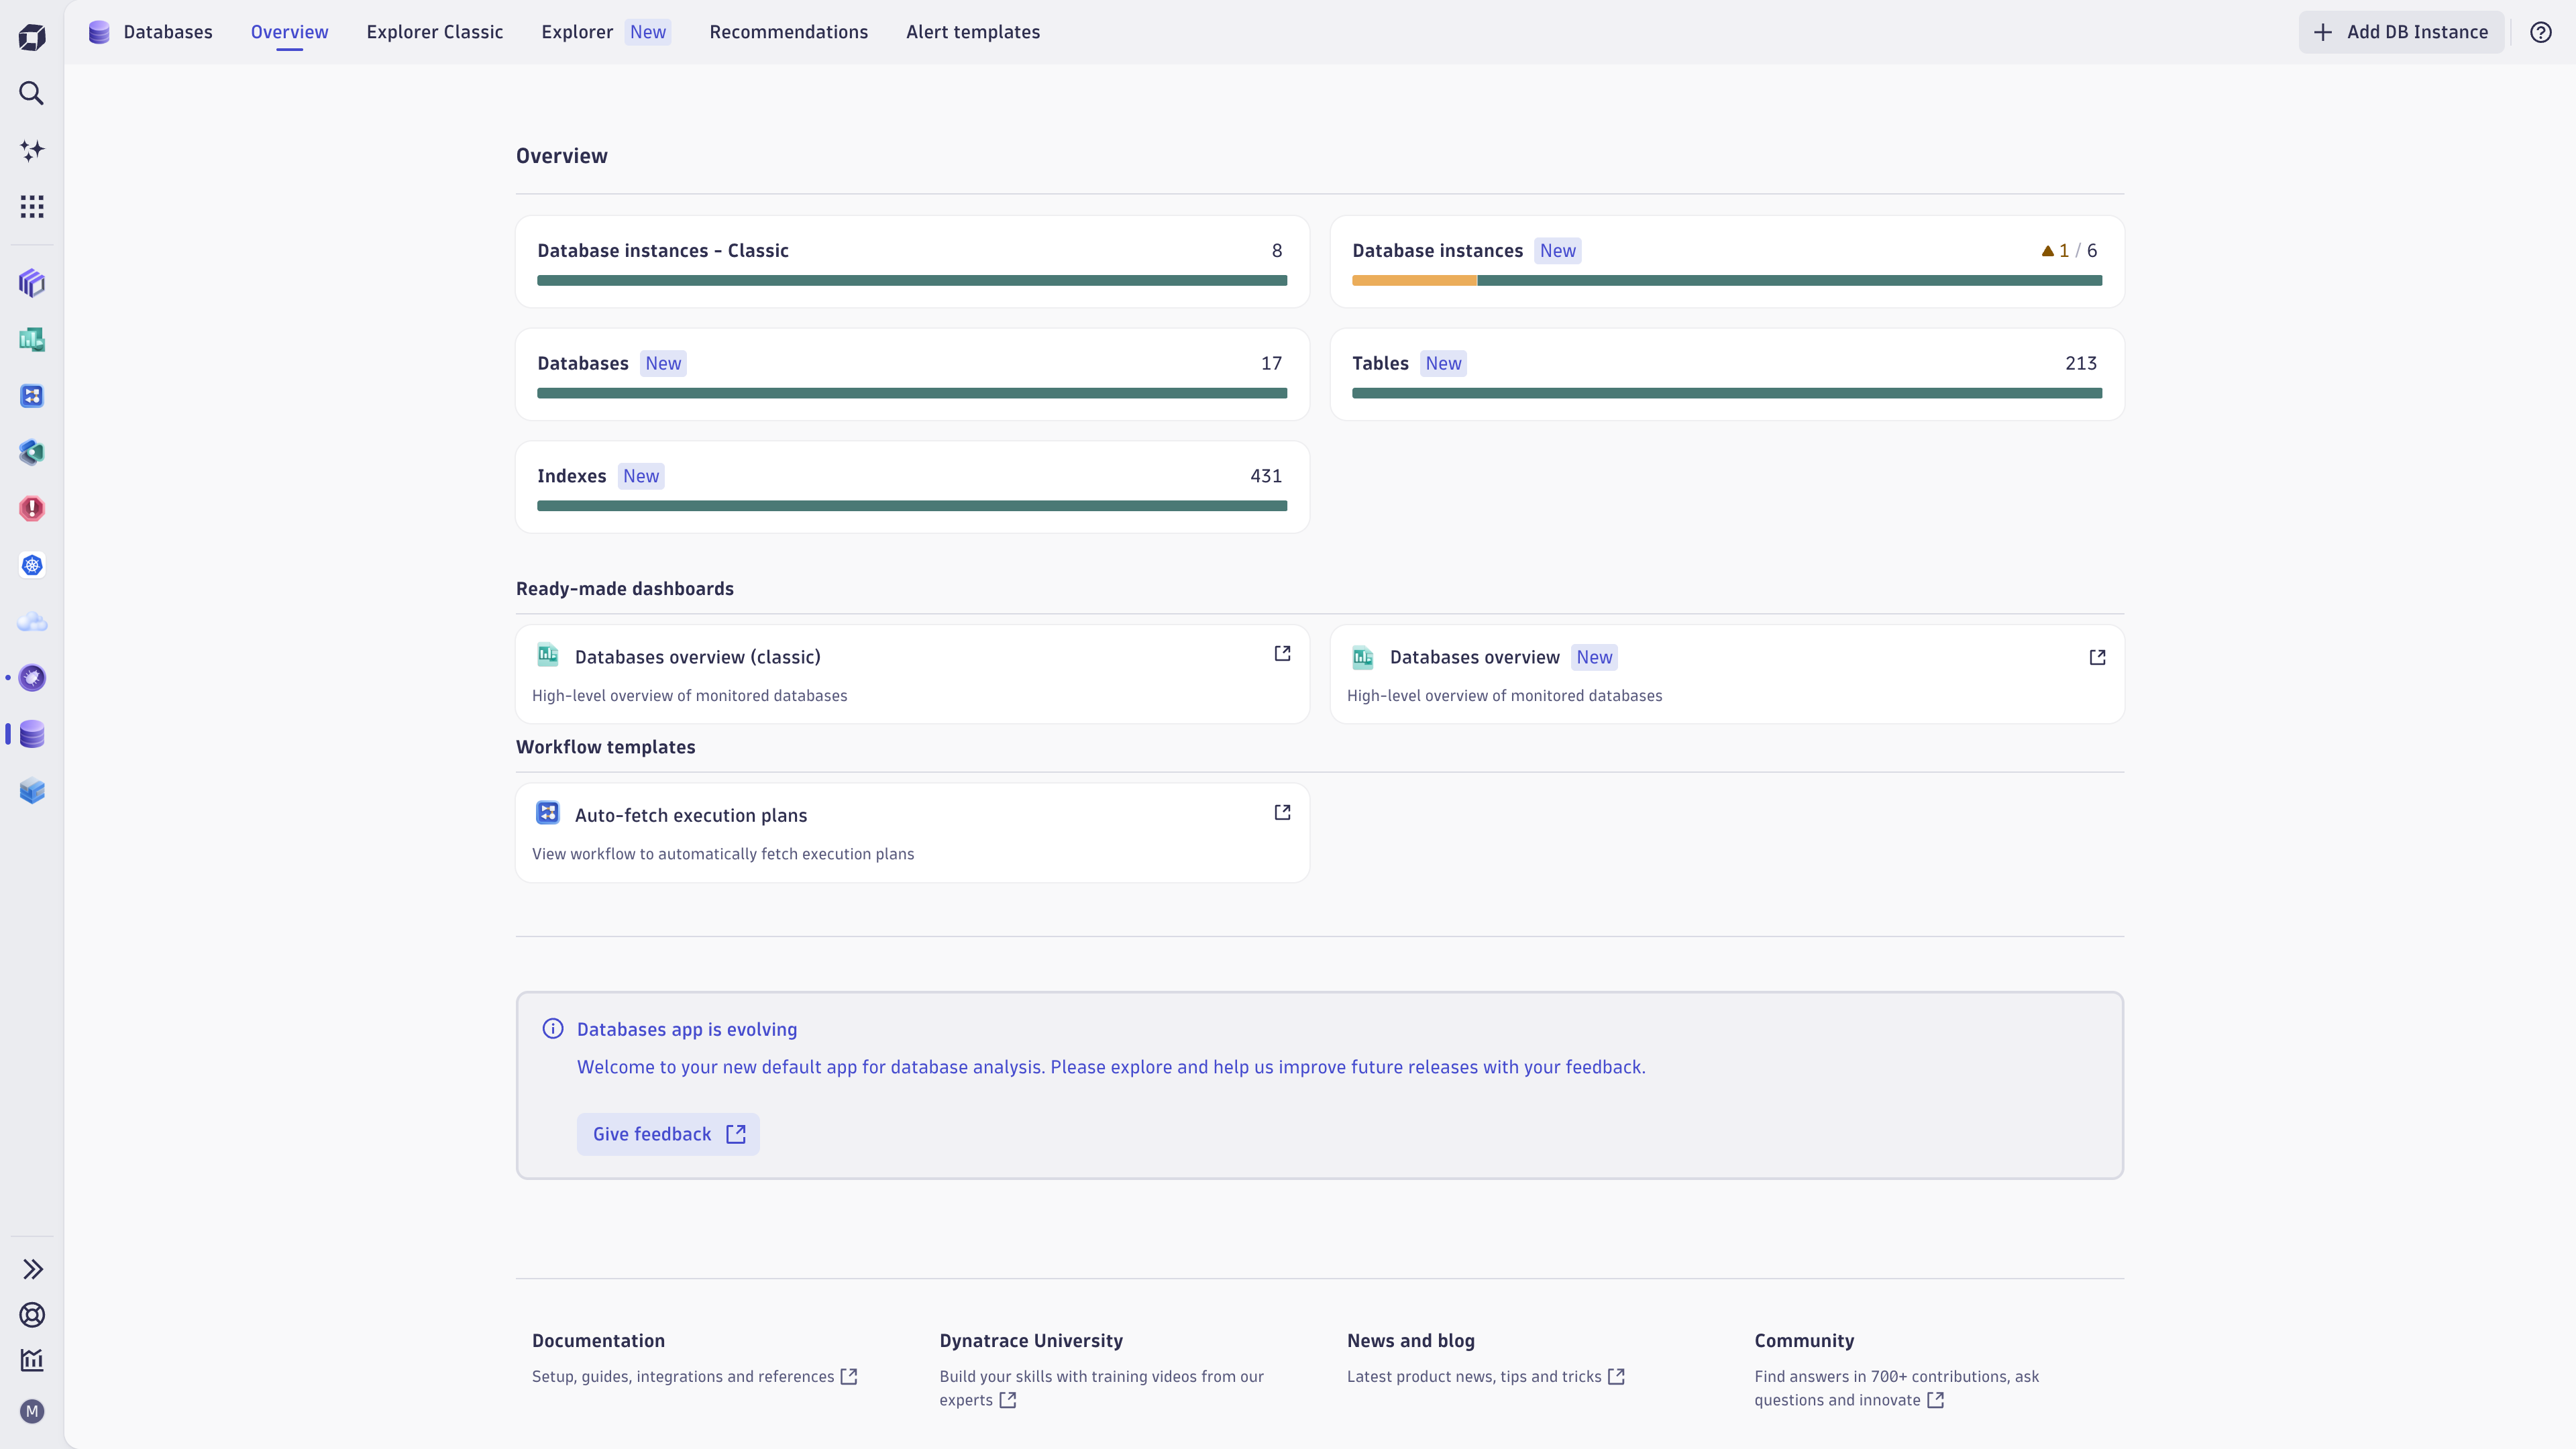
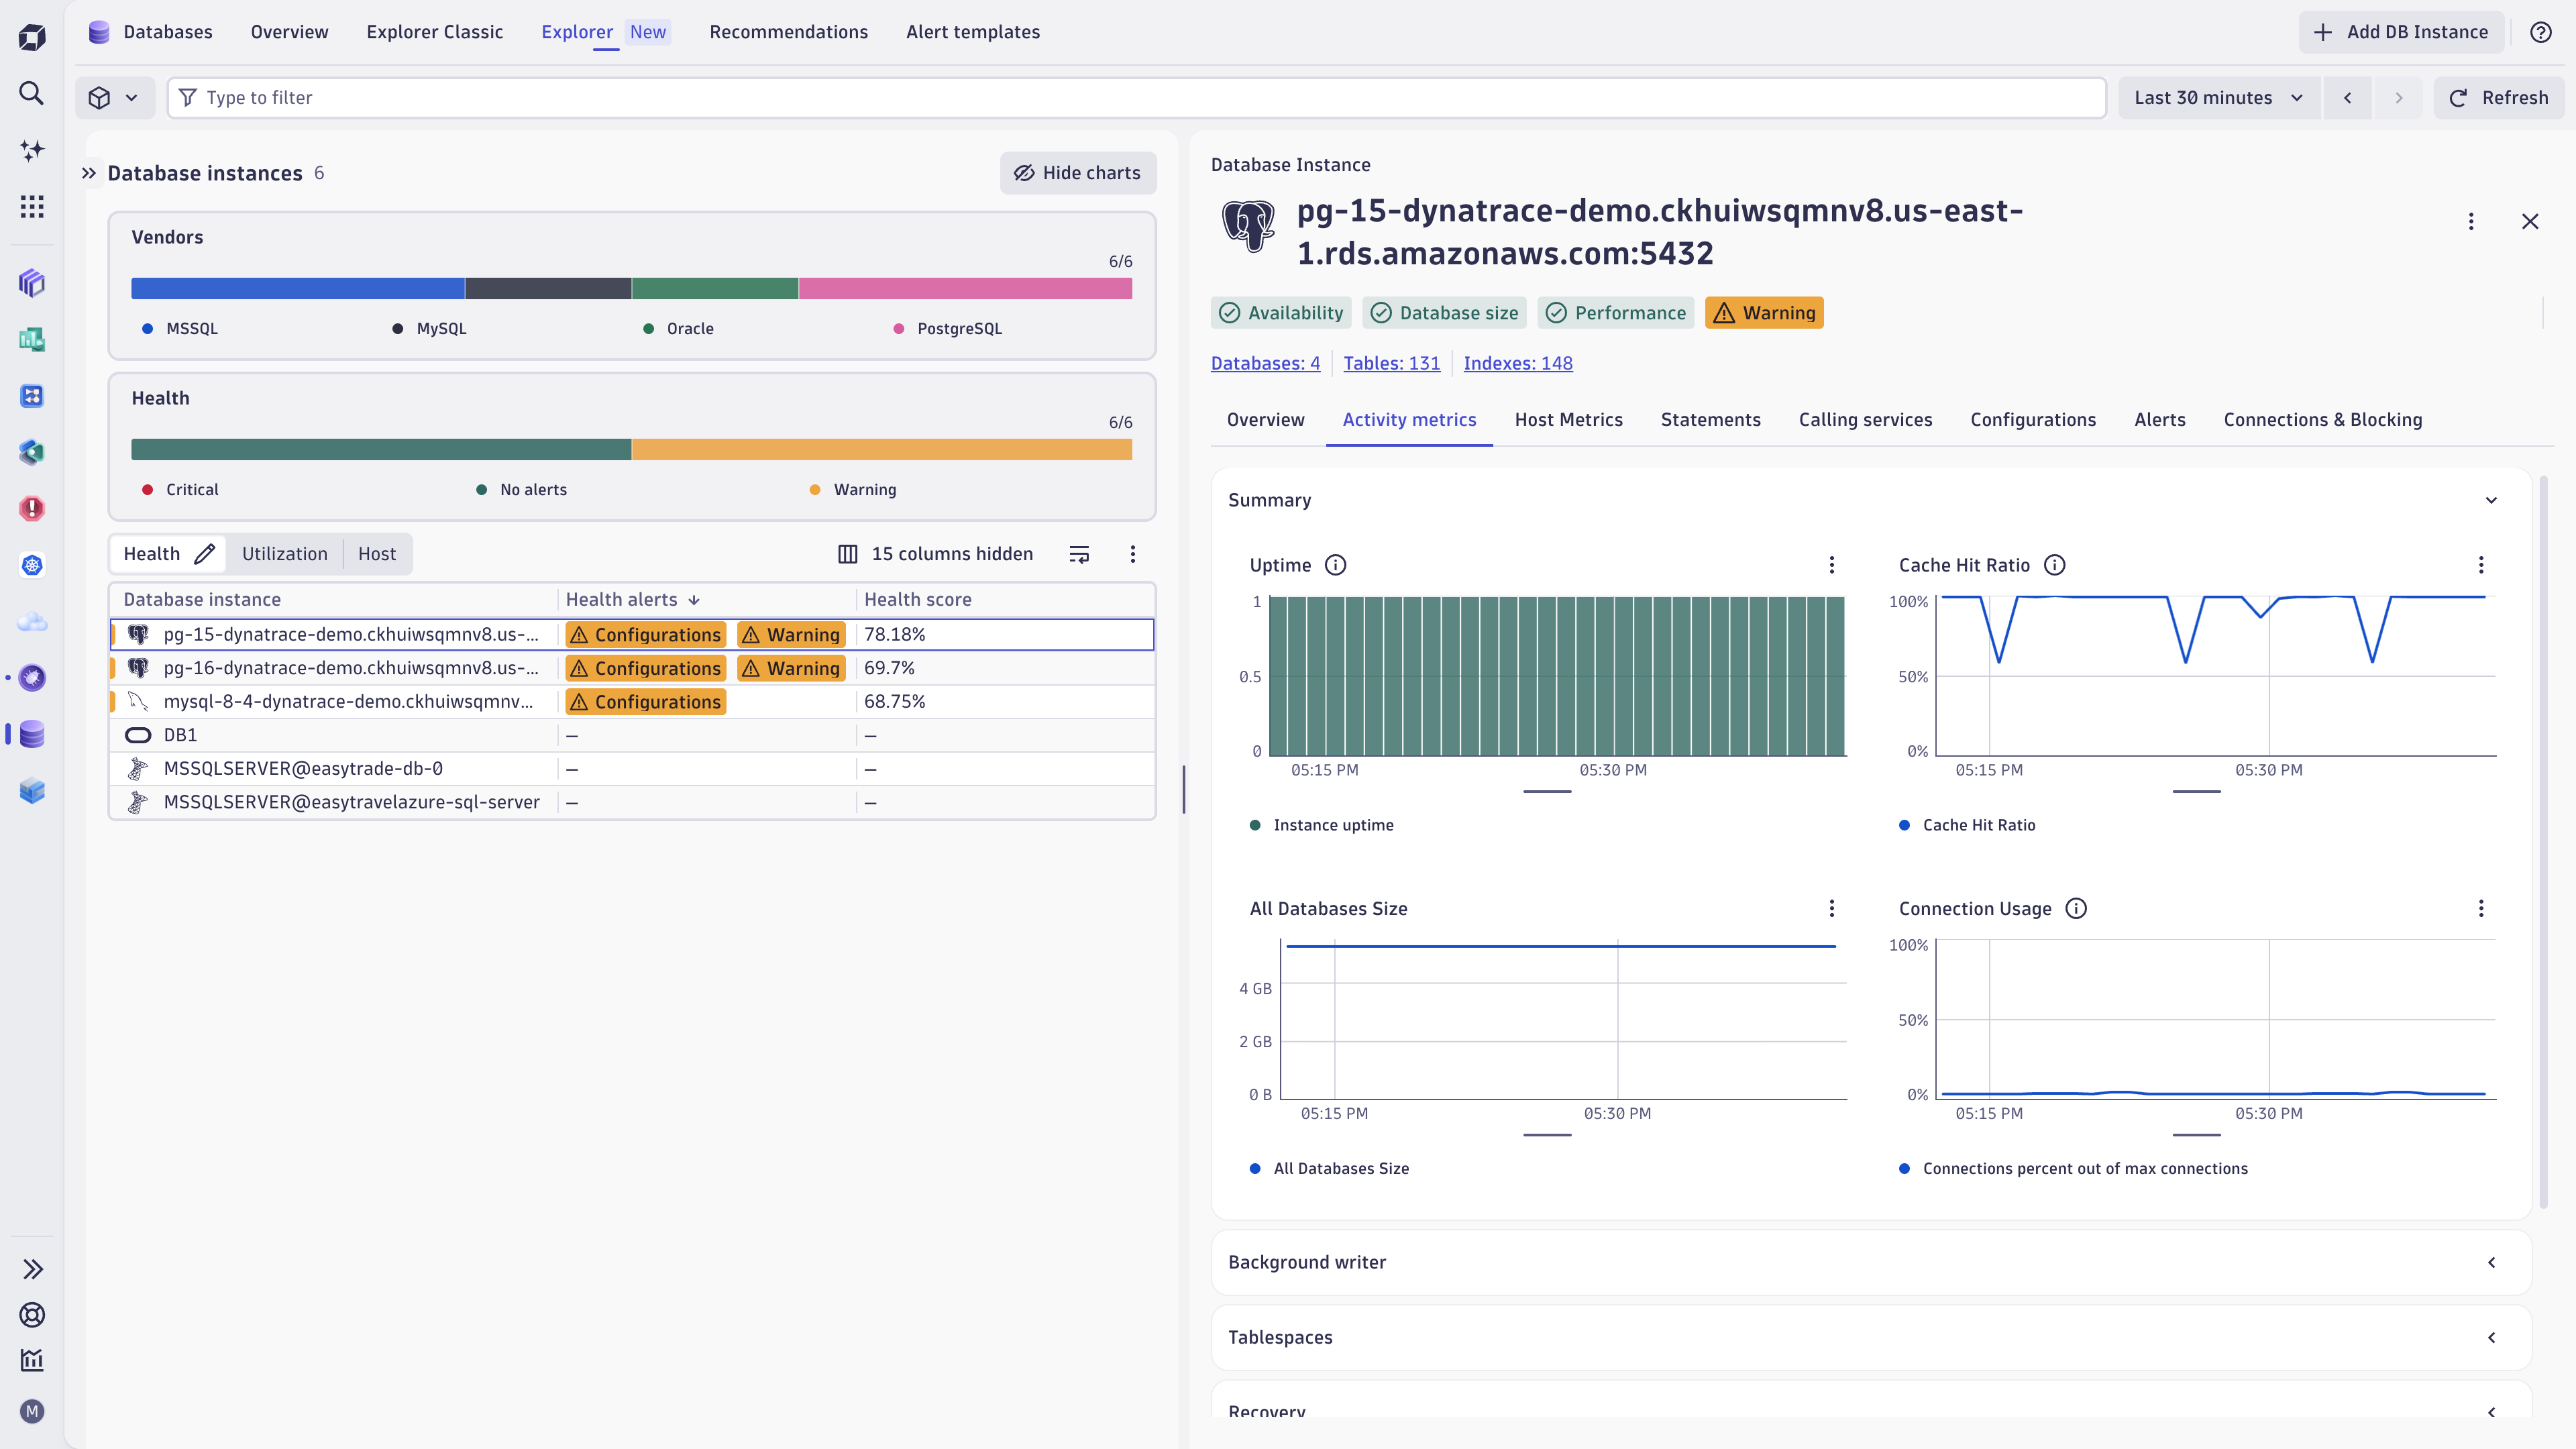
Databases app overview
Centralized dashboard
The Overview tab provides a high-level summary of your database landscape:
-
Database health: Visualize healthy and unhealthy database instances to identify problem areas quickly.
-
Host metrics: Access data from hosts running OneAgent for deeper analysis of resource dependencies.
Explore database instances
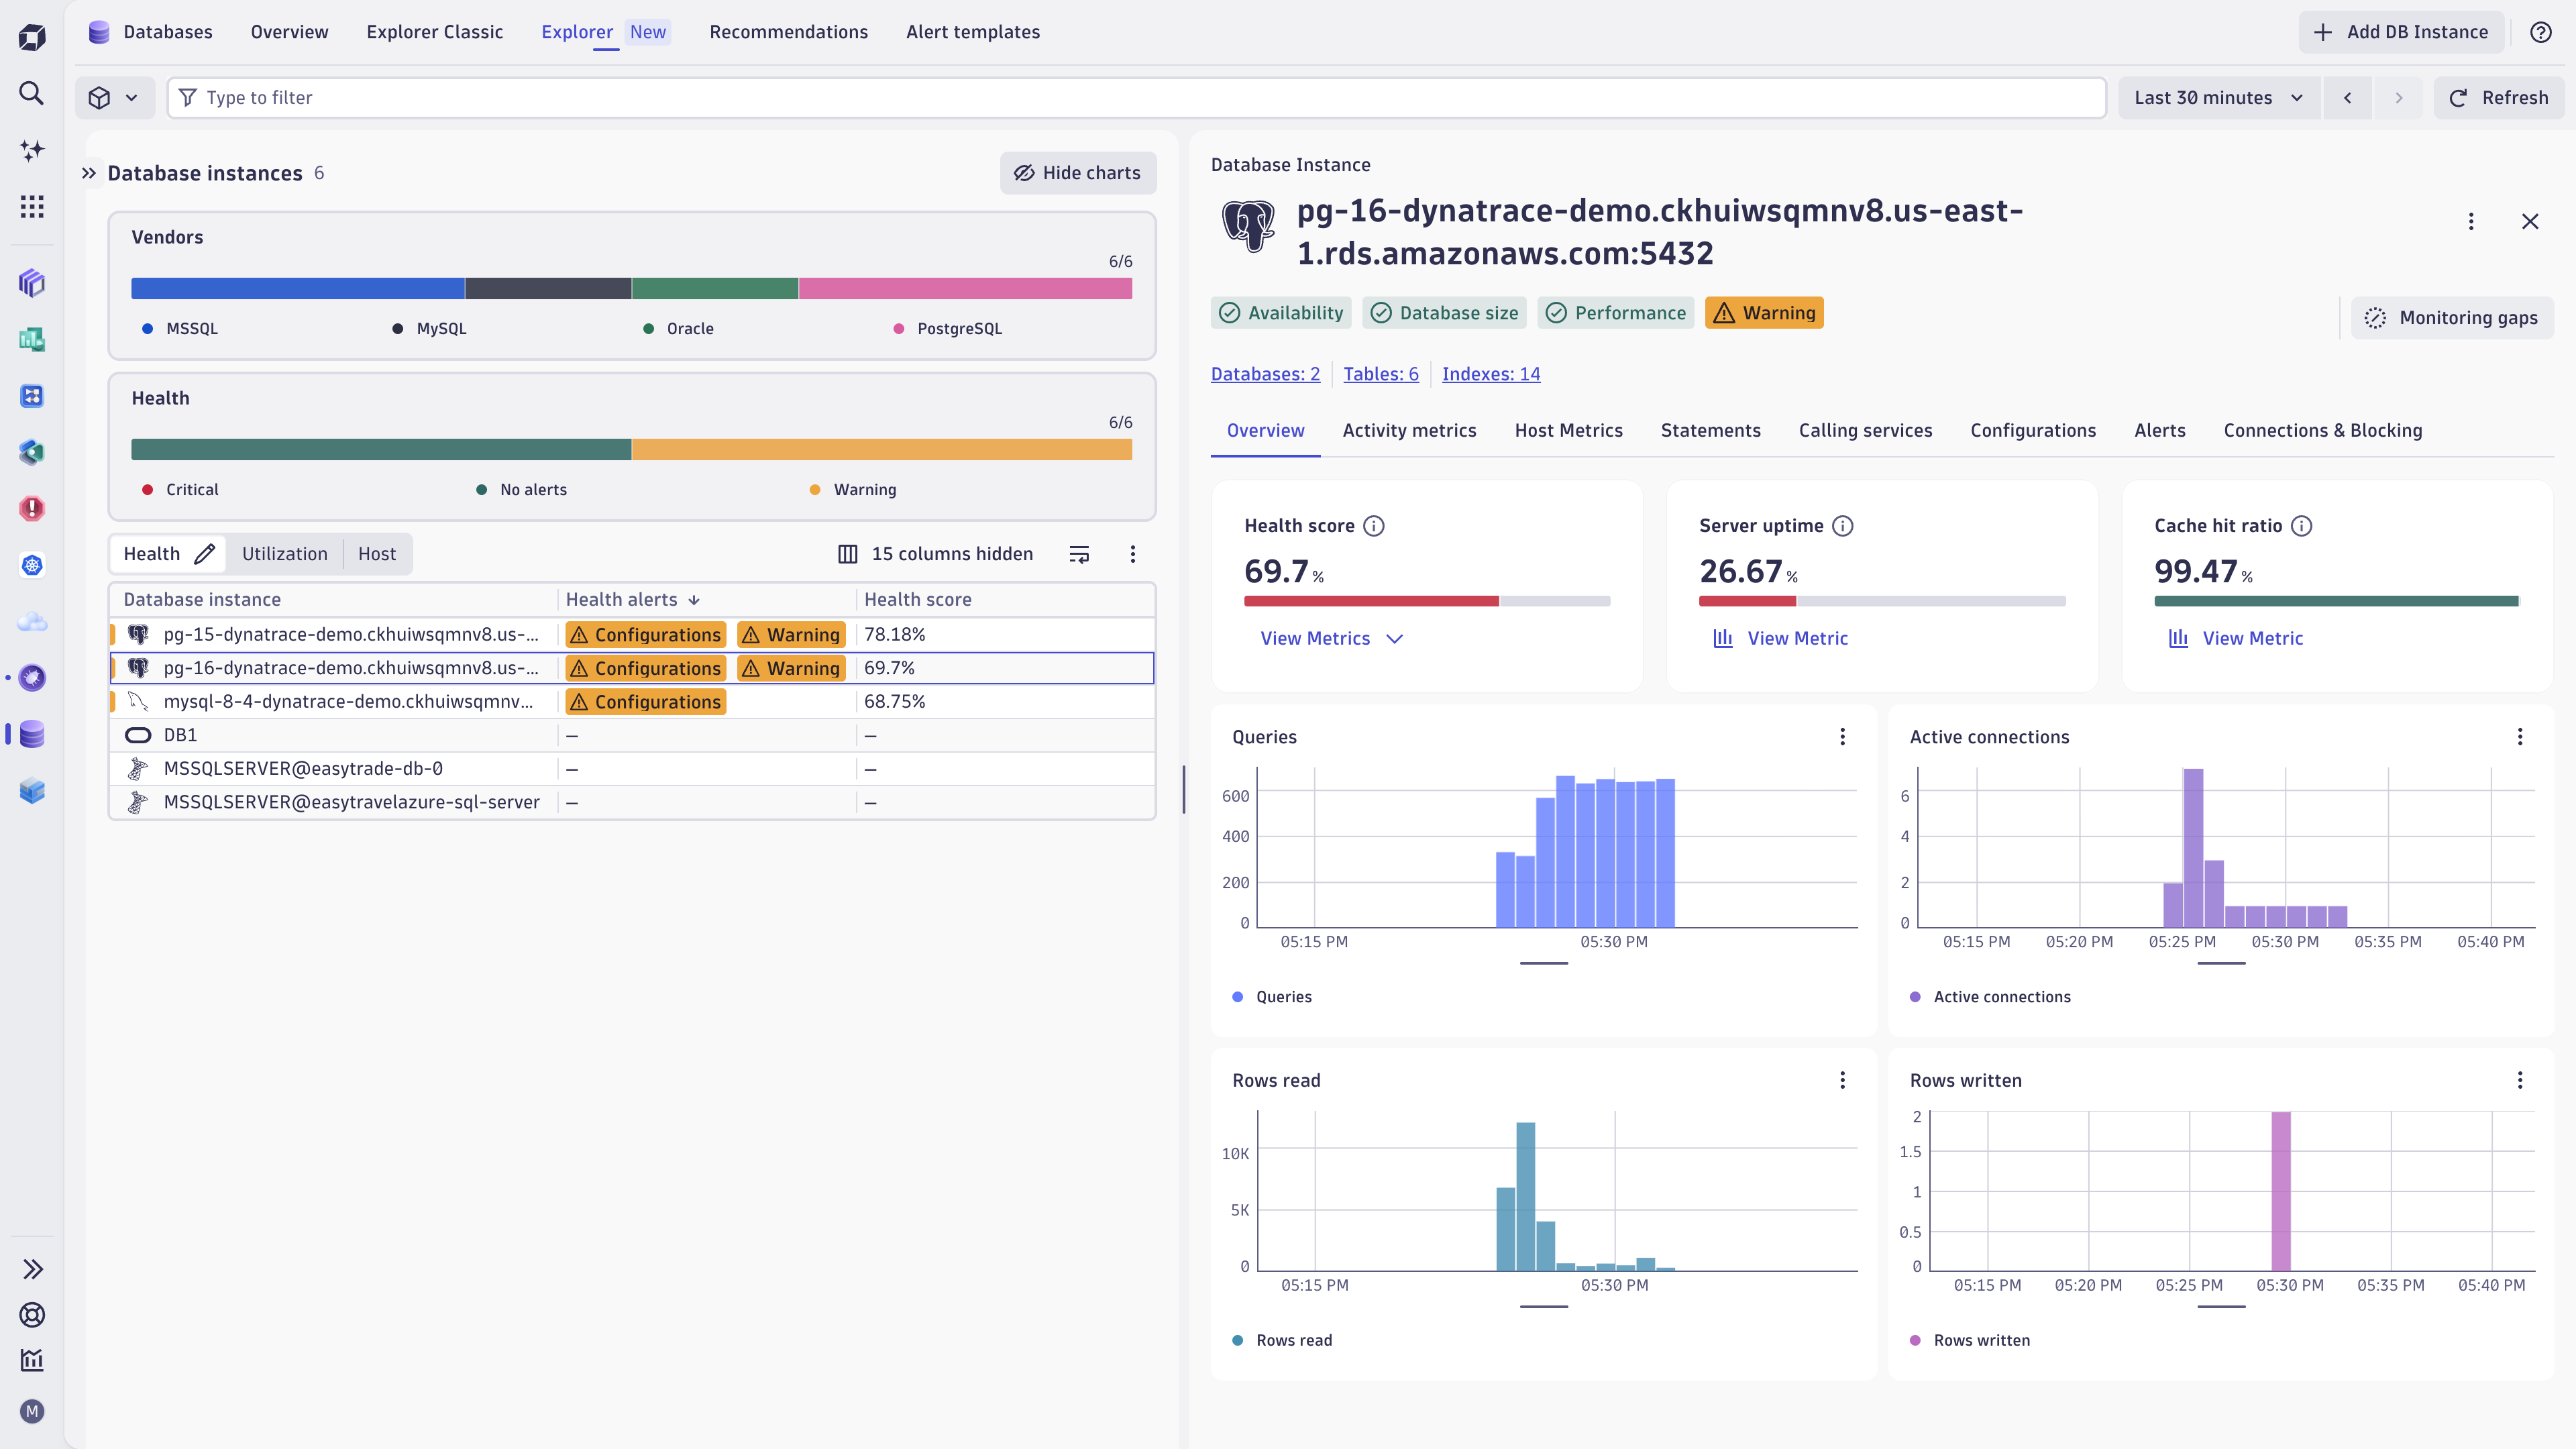
Select the Explorer tab to view a list of all your monitored instances in the Database instances table. The table provides at-a-glance insights into the state of each instance:
- Vendors shows the distribution of monitored database technologies, such as PostgreSQL, MySQL, MSSQL, Oracle, MariaDB, and HanaDB.
- Health highlights instances with critical, warning, or no active alerts so you can prioritize troubleshooting.
- Utilization shows workload indicators like CPU usage, memory usage, active sessions, and user calls.
- Host shows the infrastructure behind each database instance, including host name, CPU, memory, disk I/O, network traffic, and IP address.
Databases view
The Databases view helps you understand the health, size, and ownership of logical databases across your monitored database instances.
Use this view to:
- Identify the largest databases and their associated instances.
- Review database size for capacity awareness.
- Spot databases with critical or warning alerts.
- Filter databases by cloud provider, vendor, tags, alert status, or host.
Specific sections:
- Size highlights the top databases by storage usage, helping you identify large or fast-growing databases.
- Health shows the percentage of databases in critical, warning, or healthy states.
Tables view
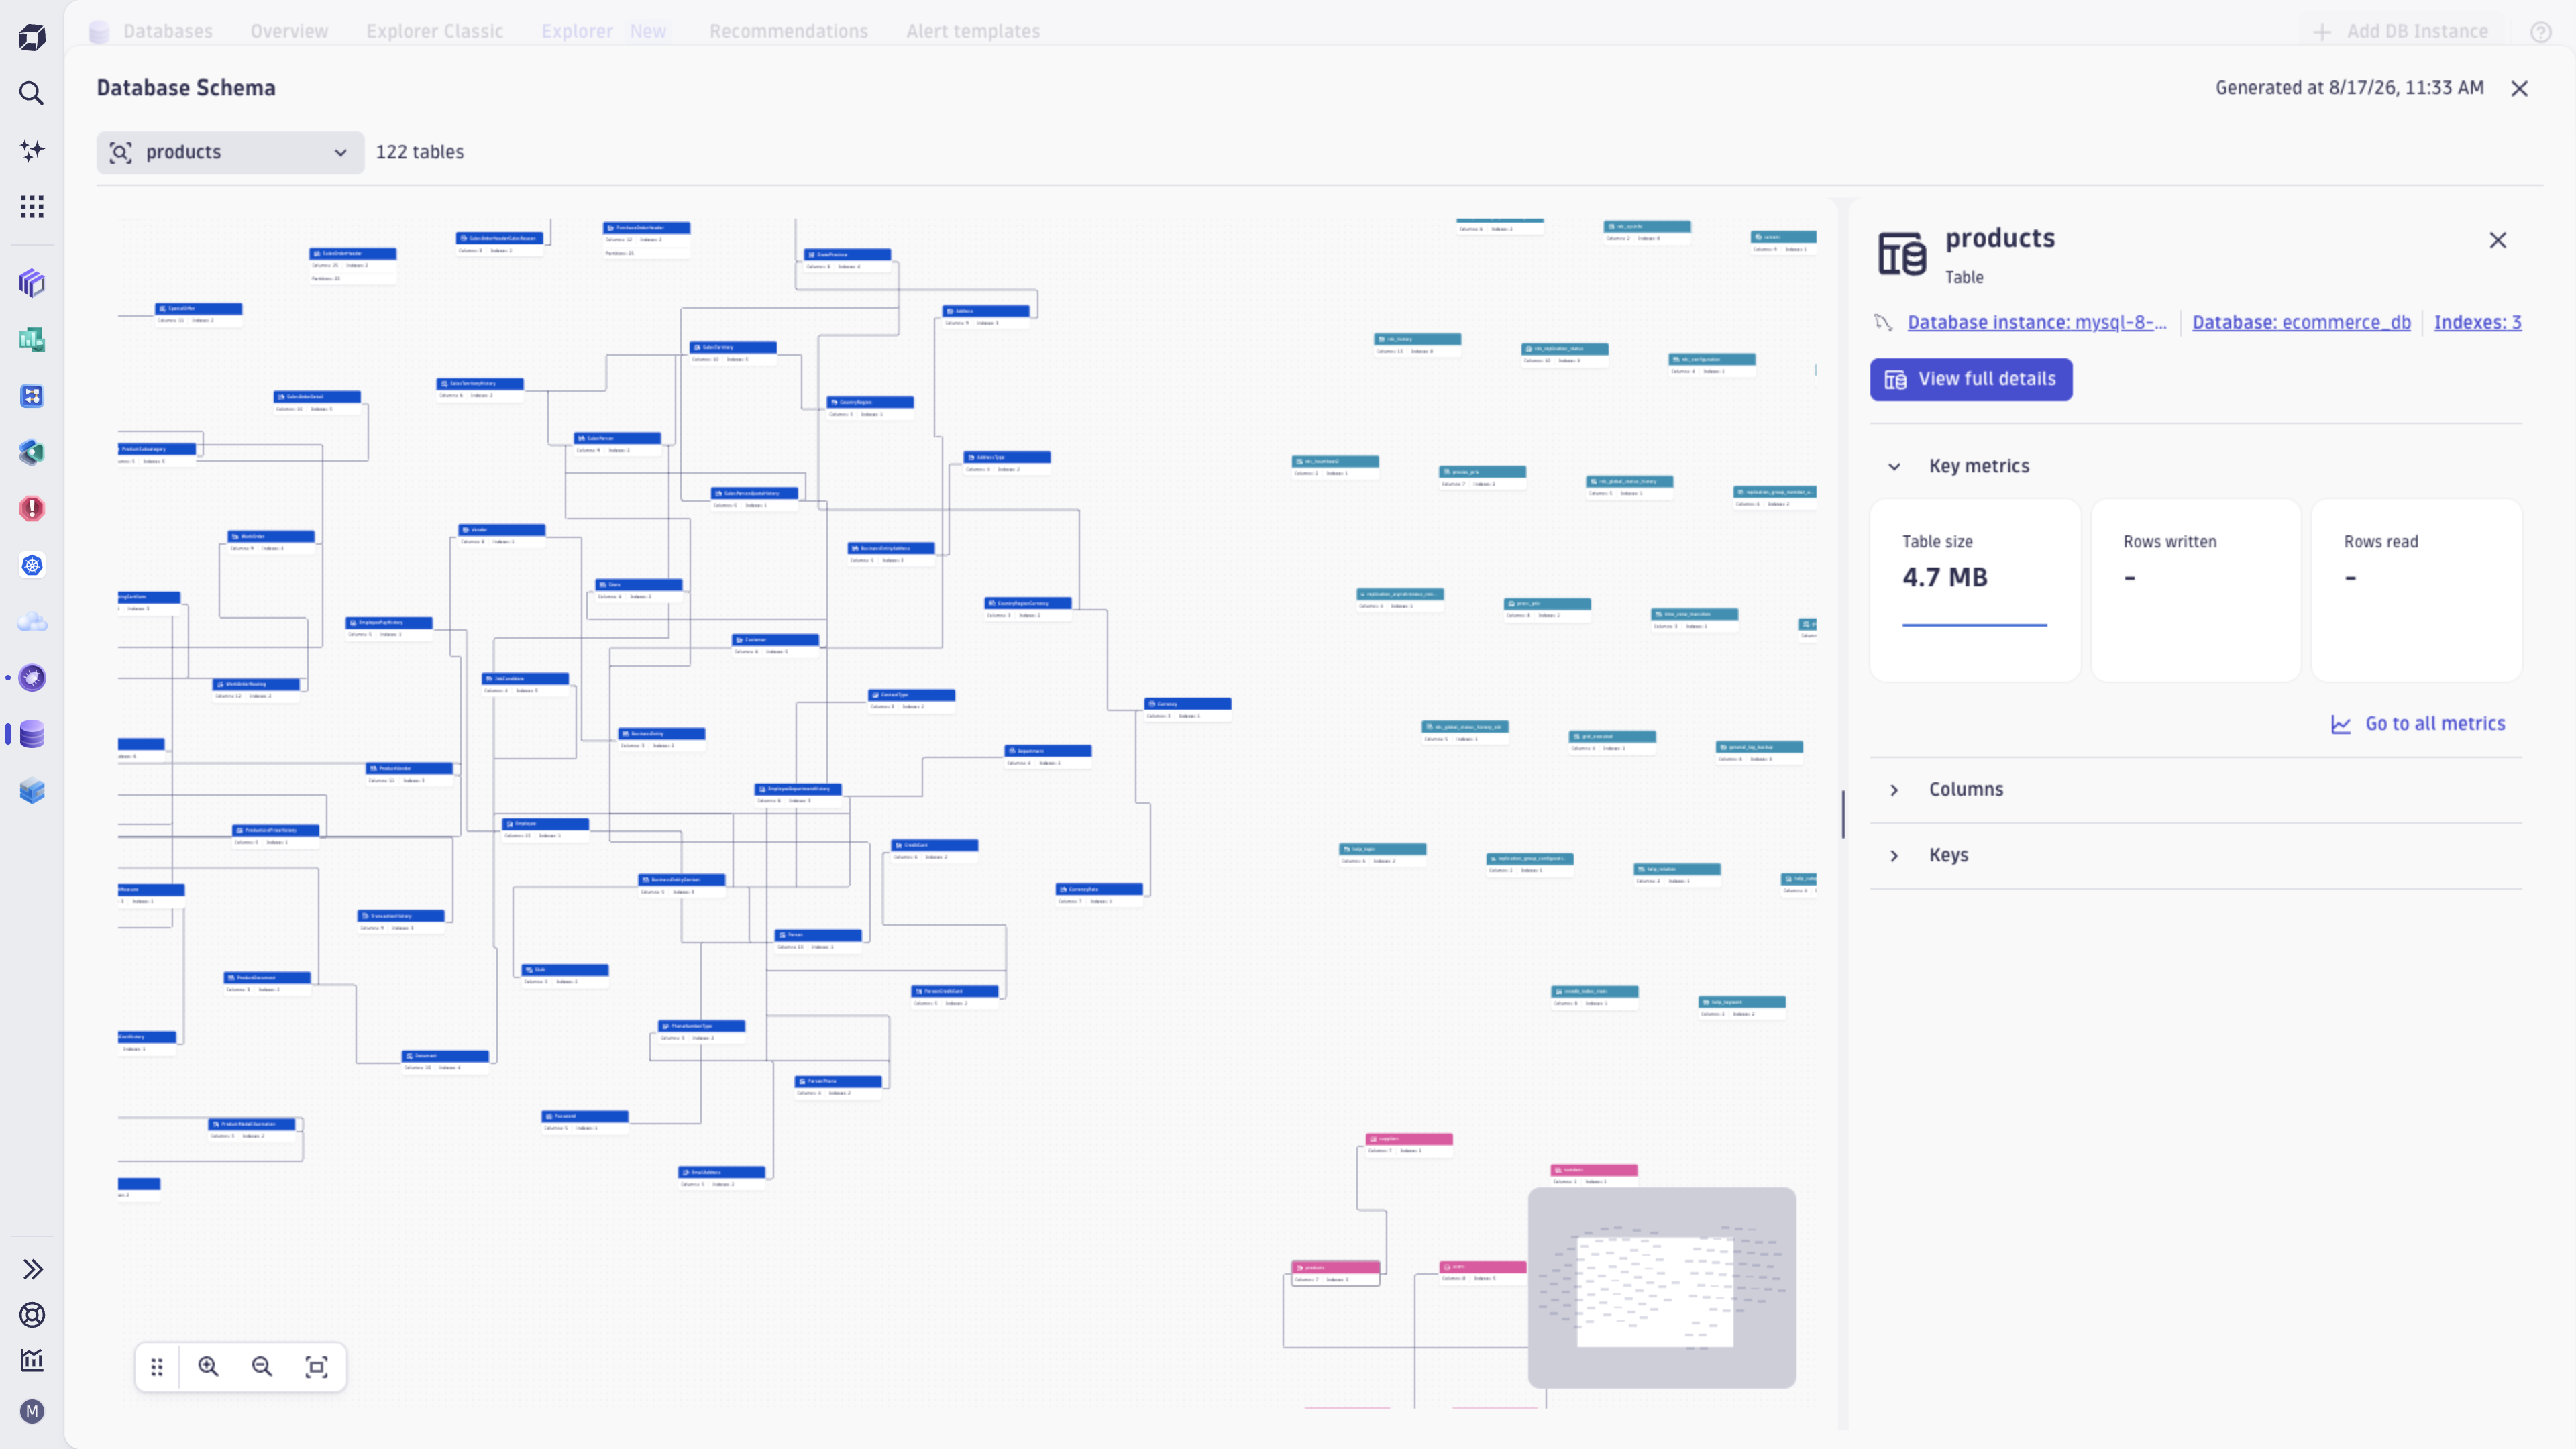
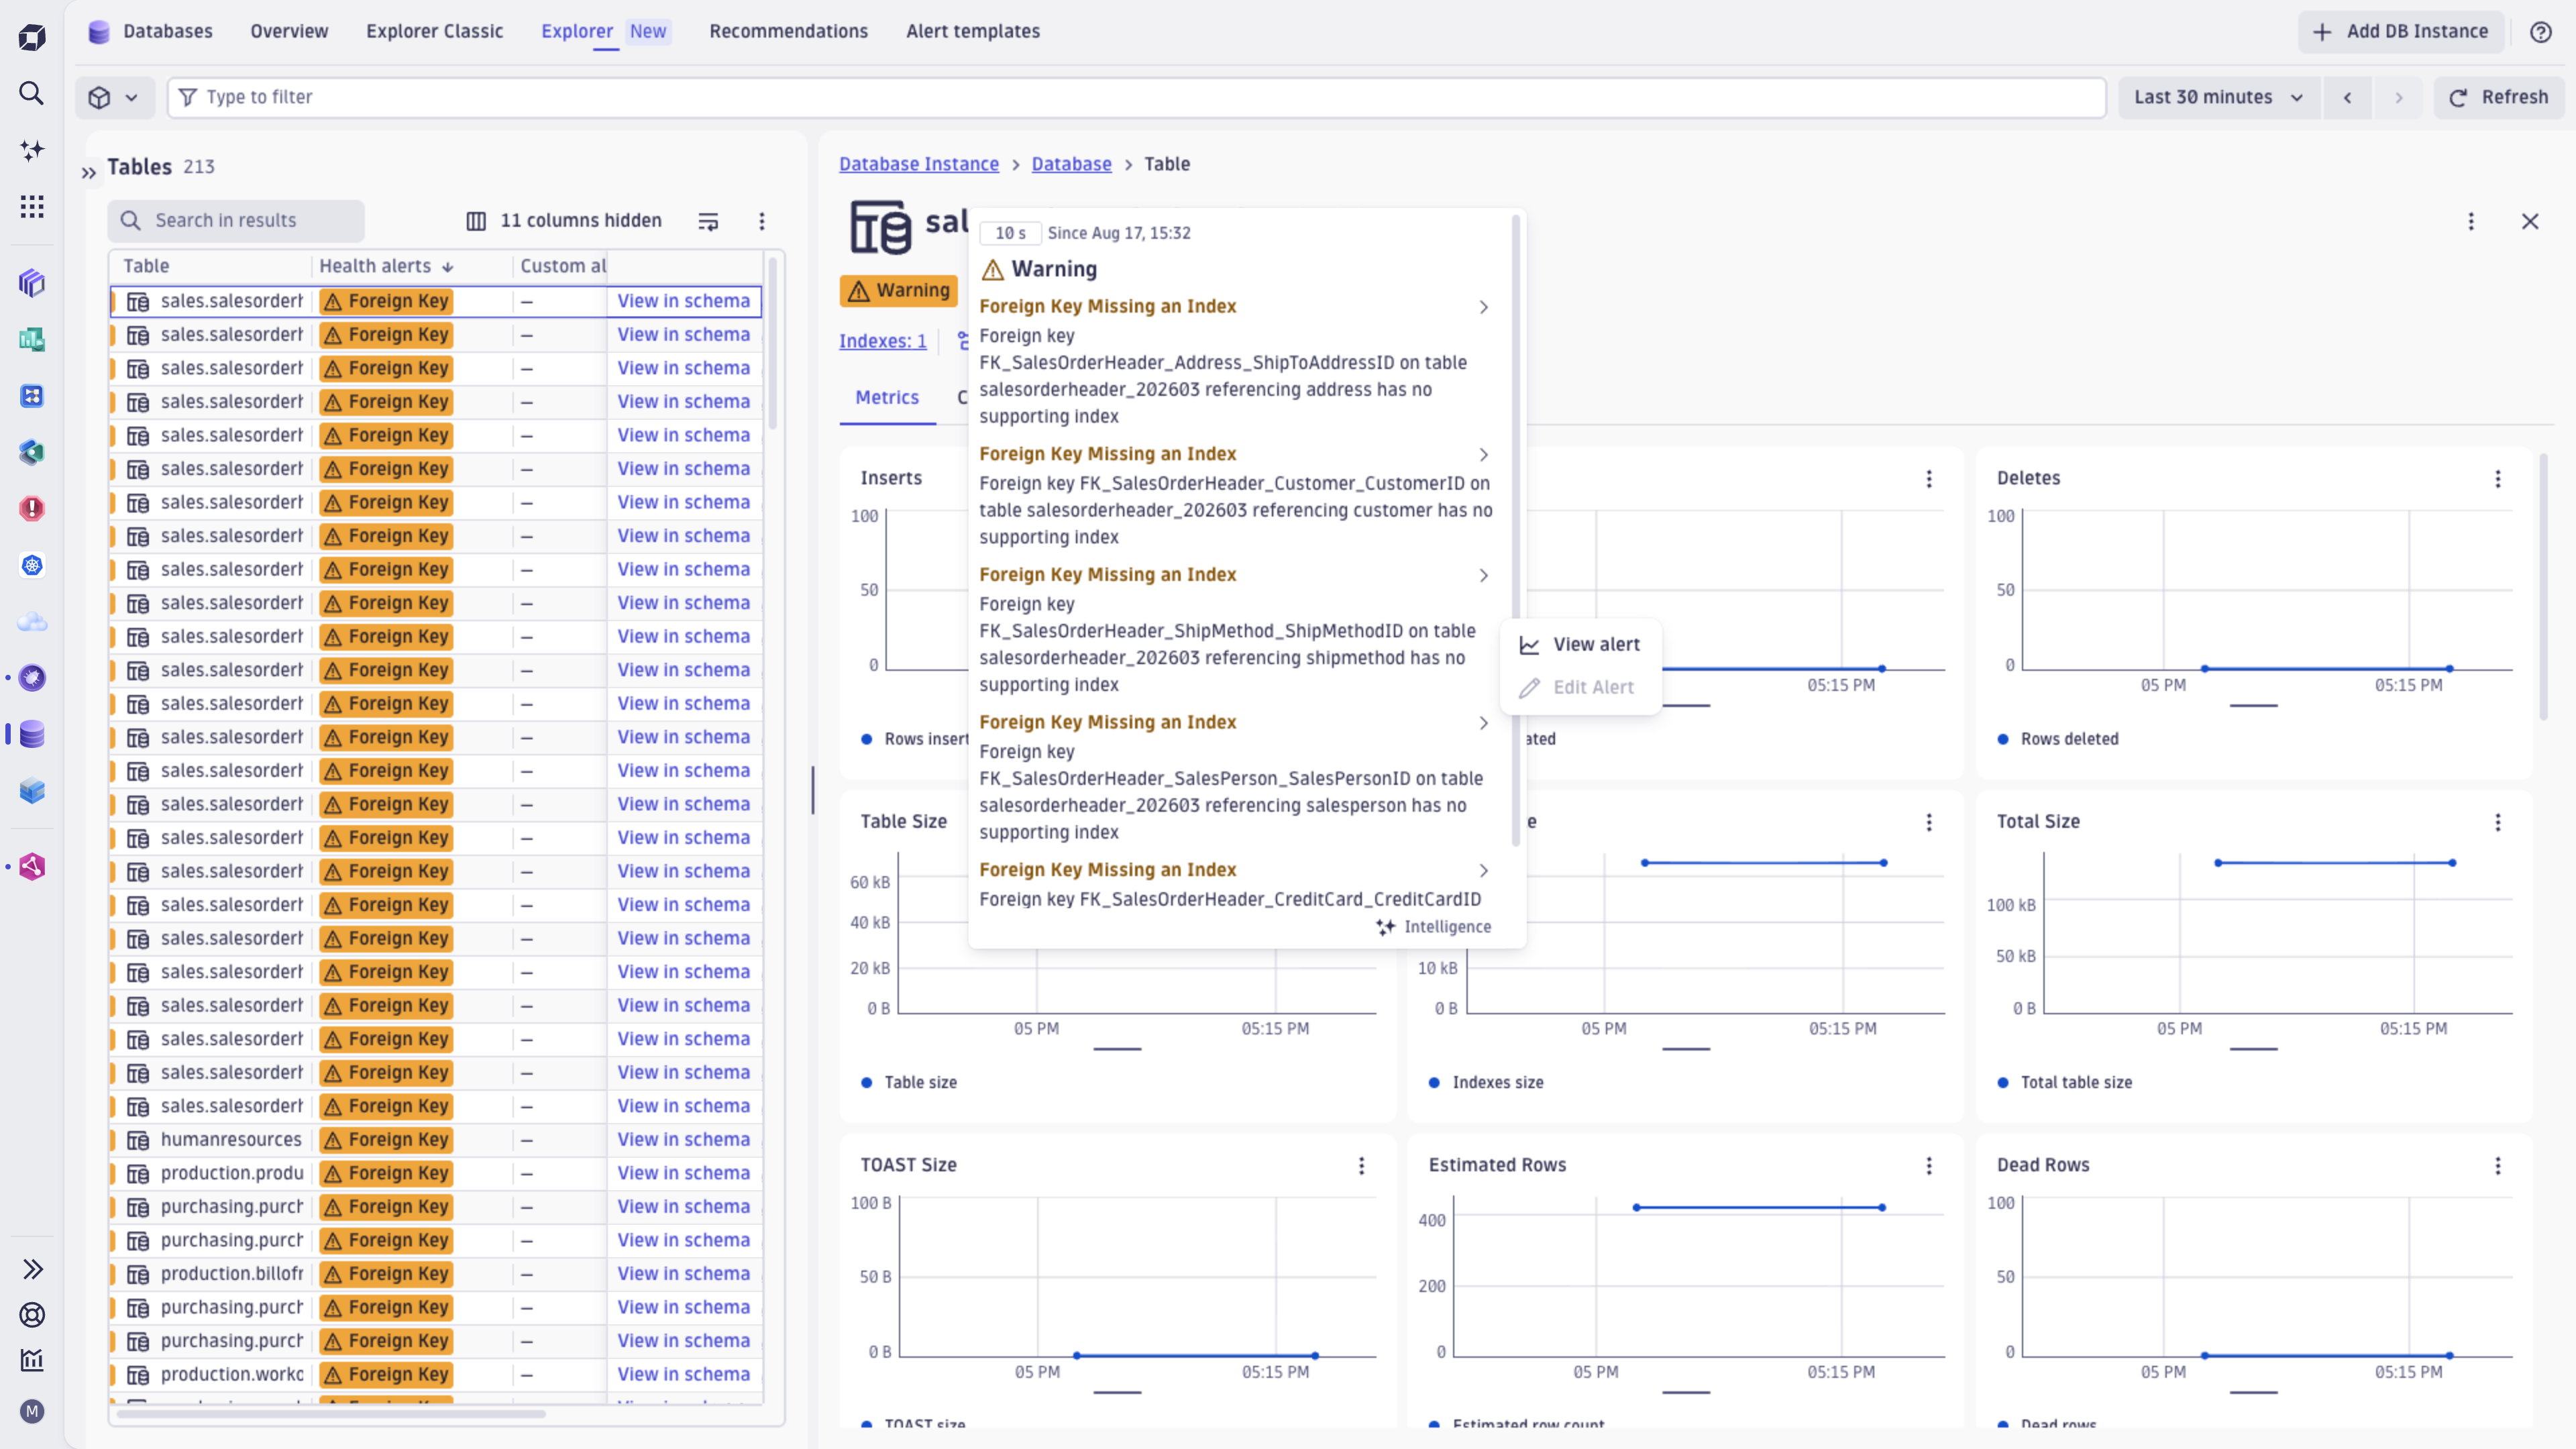
The Tables view helps you inspect database tables across your monitored databases and identify table-level issues that may need attention.
Use this view to:
- Review discovered tables and their associated databases.
- Spot tables with health alerts.
- Open tables in their schema context.
Indexes view
The Indexes view helps you review database indexes across your monitored tables and identify index-related issues or optimization opportunities.
Use this view to:
- Review discovered indexes and their associated tables.
- Identify unused or problematic indexes.
- Spot custom warning alerts.
- Filter indexes by cloud provider, vendor, tags, alert status, or host.
Recommendations tab
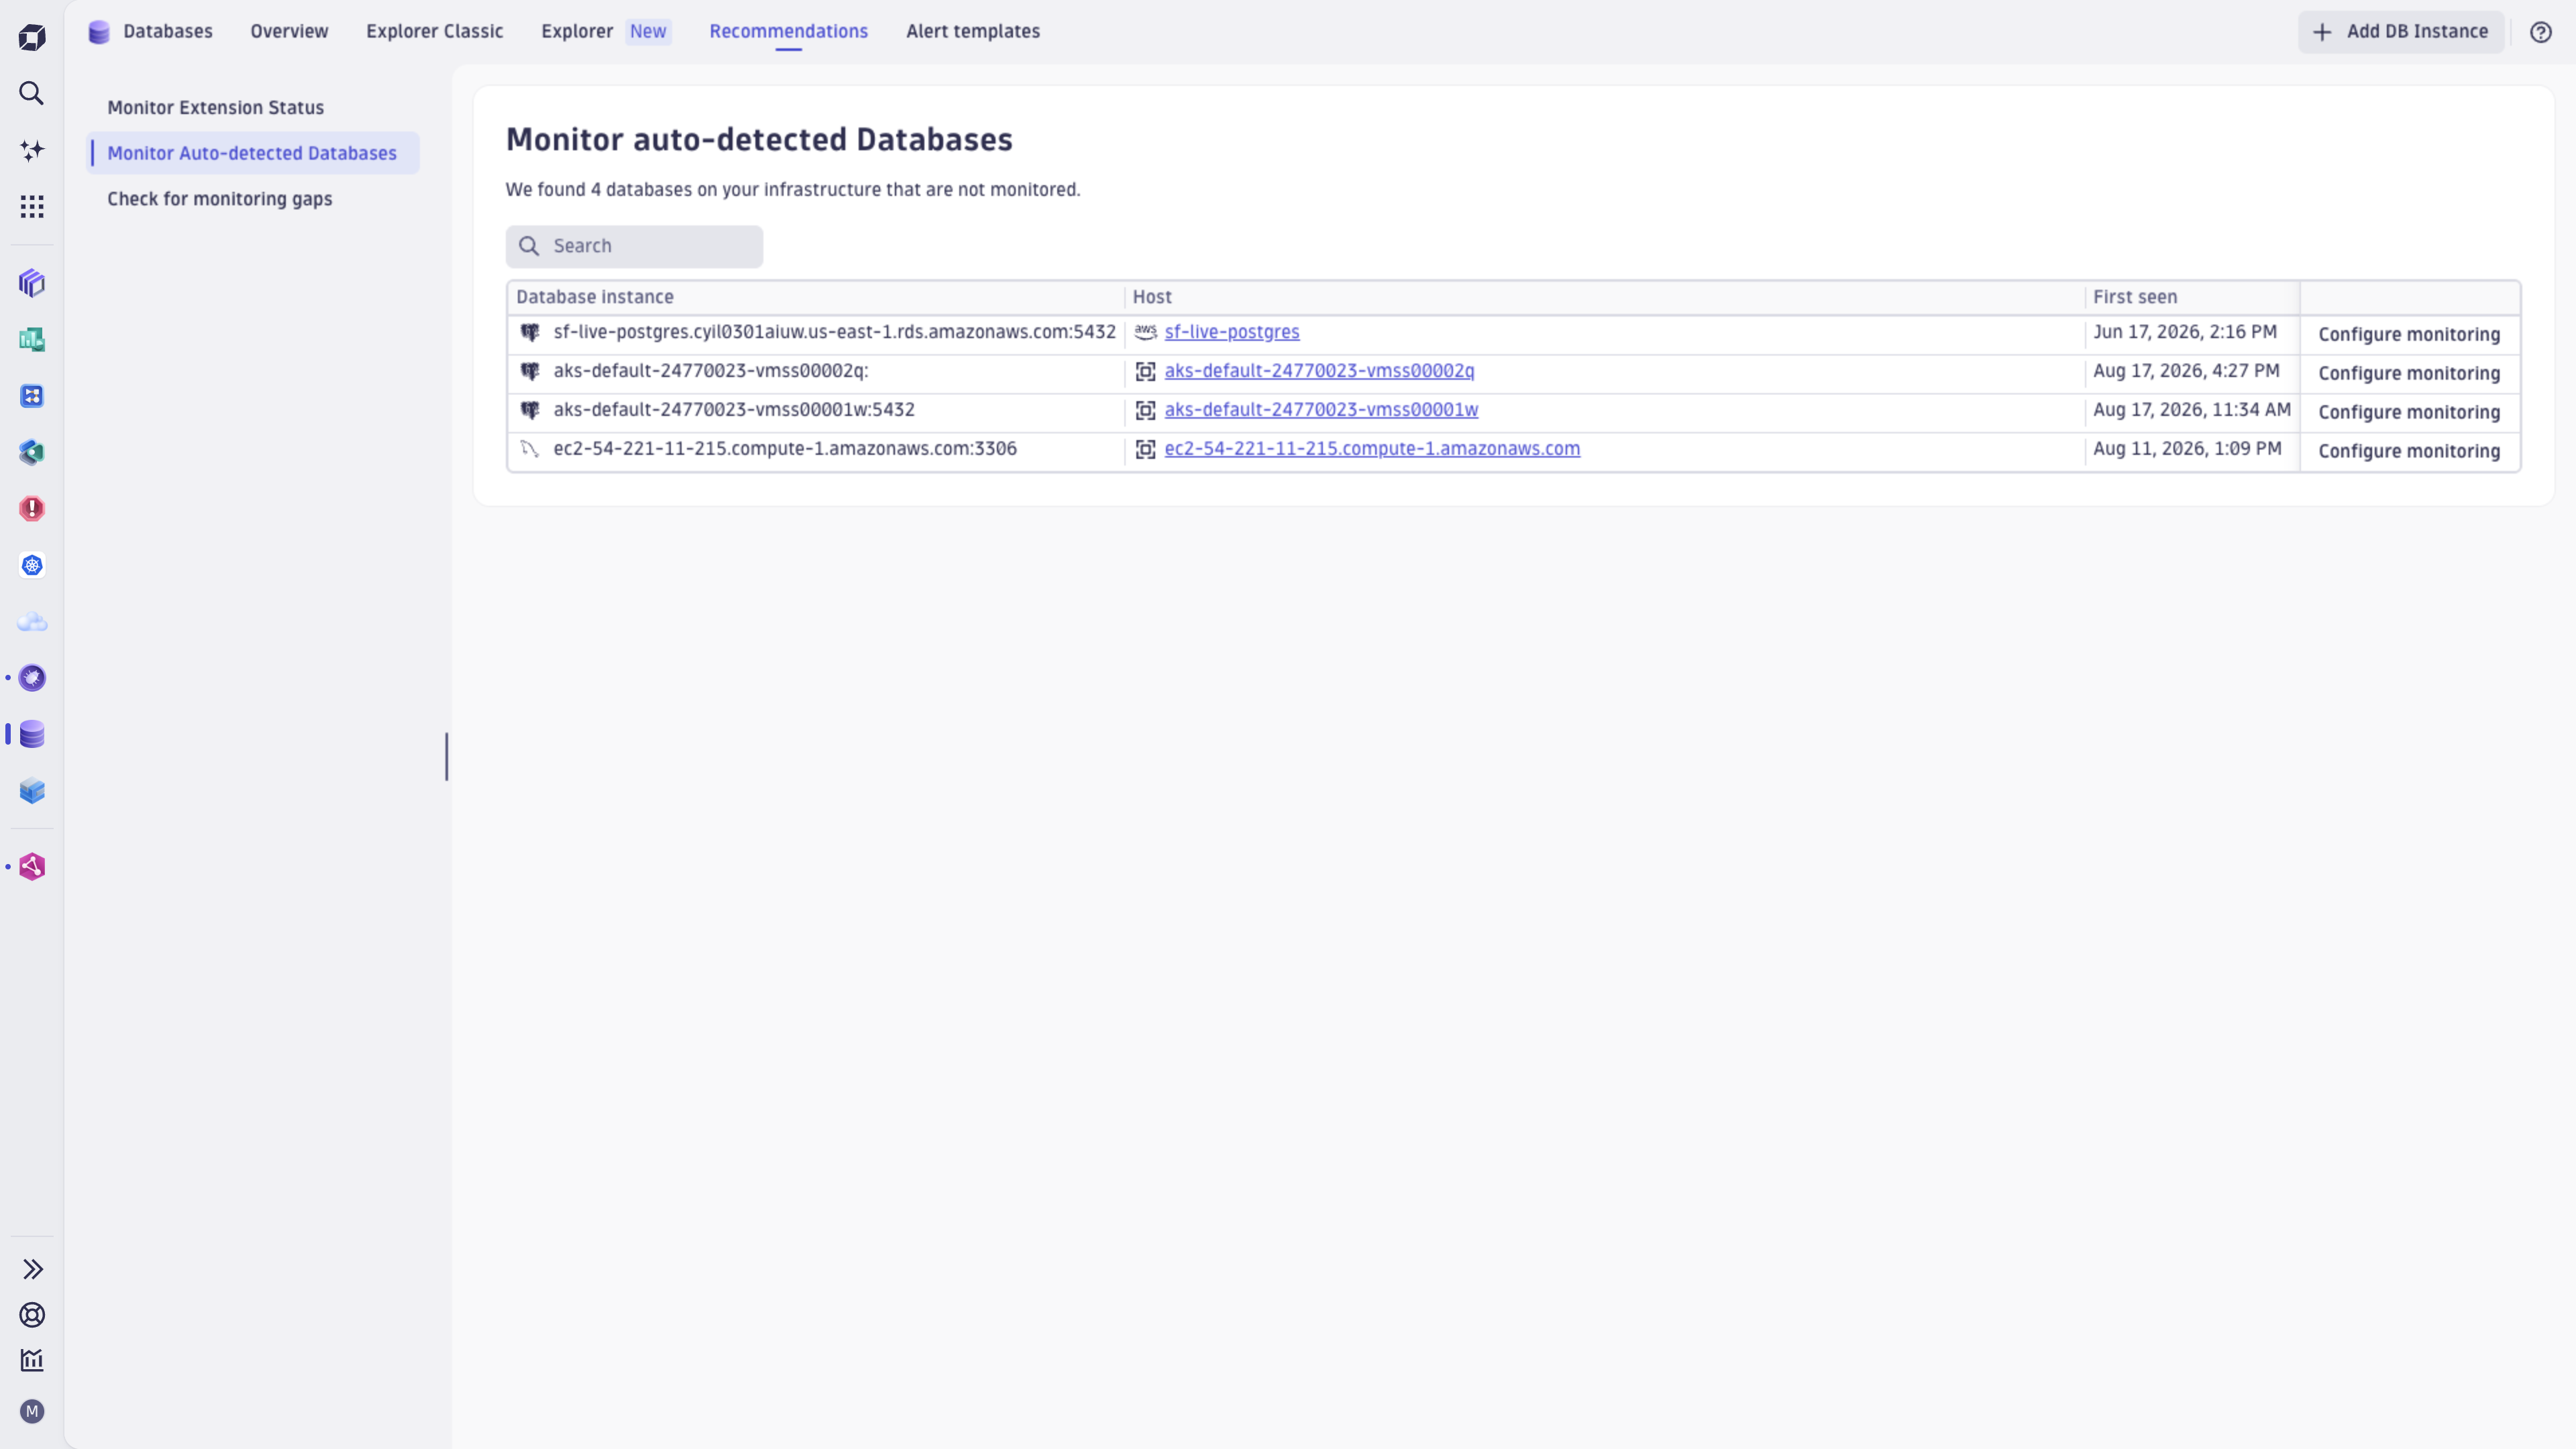
The Recommendations tab helps you improve database monitoring coverage and data quality. Use it to keep database extensions up to date, discover databases that are not yet monitored, and identify gaps that may prevent complete visibility.
Specific views:
- Monitor extension status shows whether the database extensions in your environment meet the required and minimum configuration versions. Identify extensions needing updates and ensure consistent monitoring across database vendors.
- Monitor Auto-detected Databases lists database instances that Dynatrace discovered in your infrastructure but that aren't monitored yet. Using this view, you can review discovered database instances and configure monitoring.
- Check for monitoring gaps highlights missing monitoring data, such as unavailable queries or execution plans. Using this view, you can see which database instances have incomplete visibility and what actions can improve troubleshooting and performance analysis.
Alert templates tab
The Alert templates tab helps you quickly set up recommended database health alerts without building alert rules from scratch. Templates are grouped by database vendor, so you can create relevant alerts for related database technologies in your environment.
Specific views:
- Alert templates support the new Explorer experience.
- Alert templates - Classic are still available separately for Explorer Classic.
- Vendor grouping helps you find templates for the database technology you use.
- Availability alerts help detect database outages or unresponsive services.
- Performance alerts help detect issues such as memory pressure or performance drops.
Statement performance analysis view
Analyze resource-intensive queries to optimize performance:
- Filter queries by time, CPU, disk, or wait metrics.
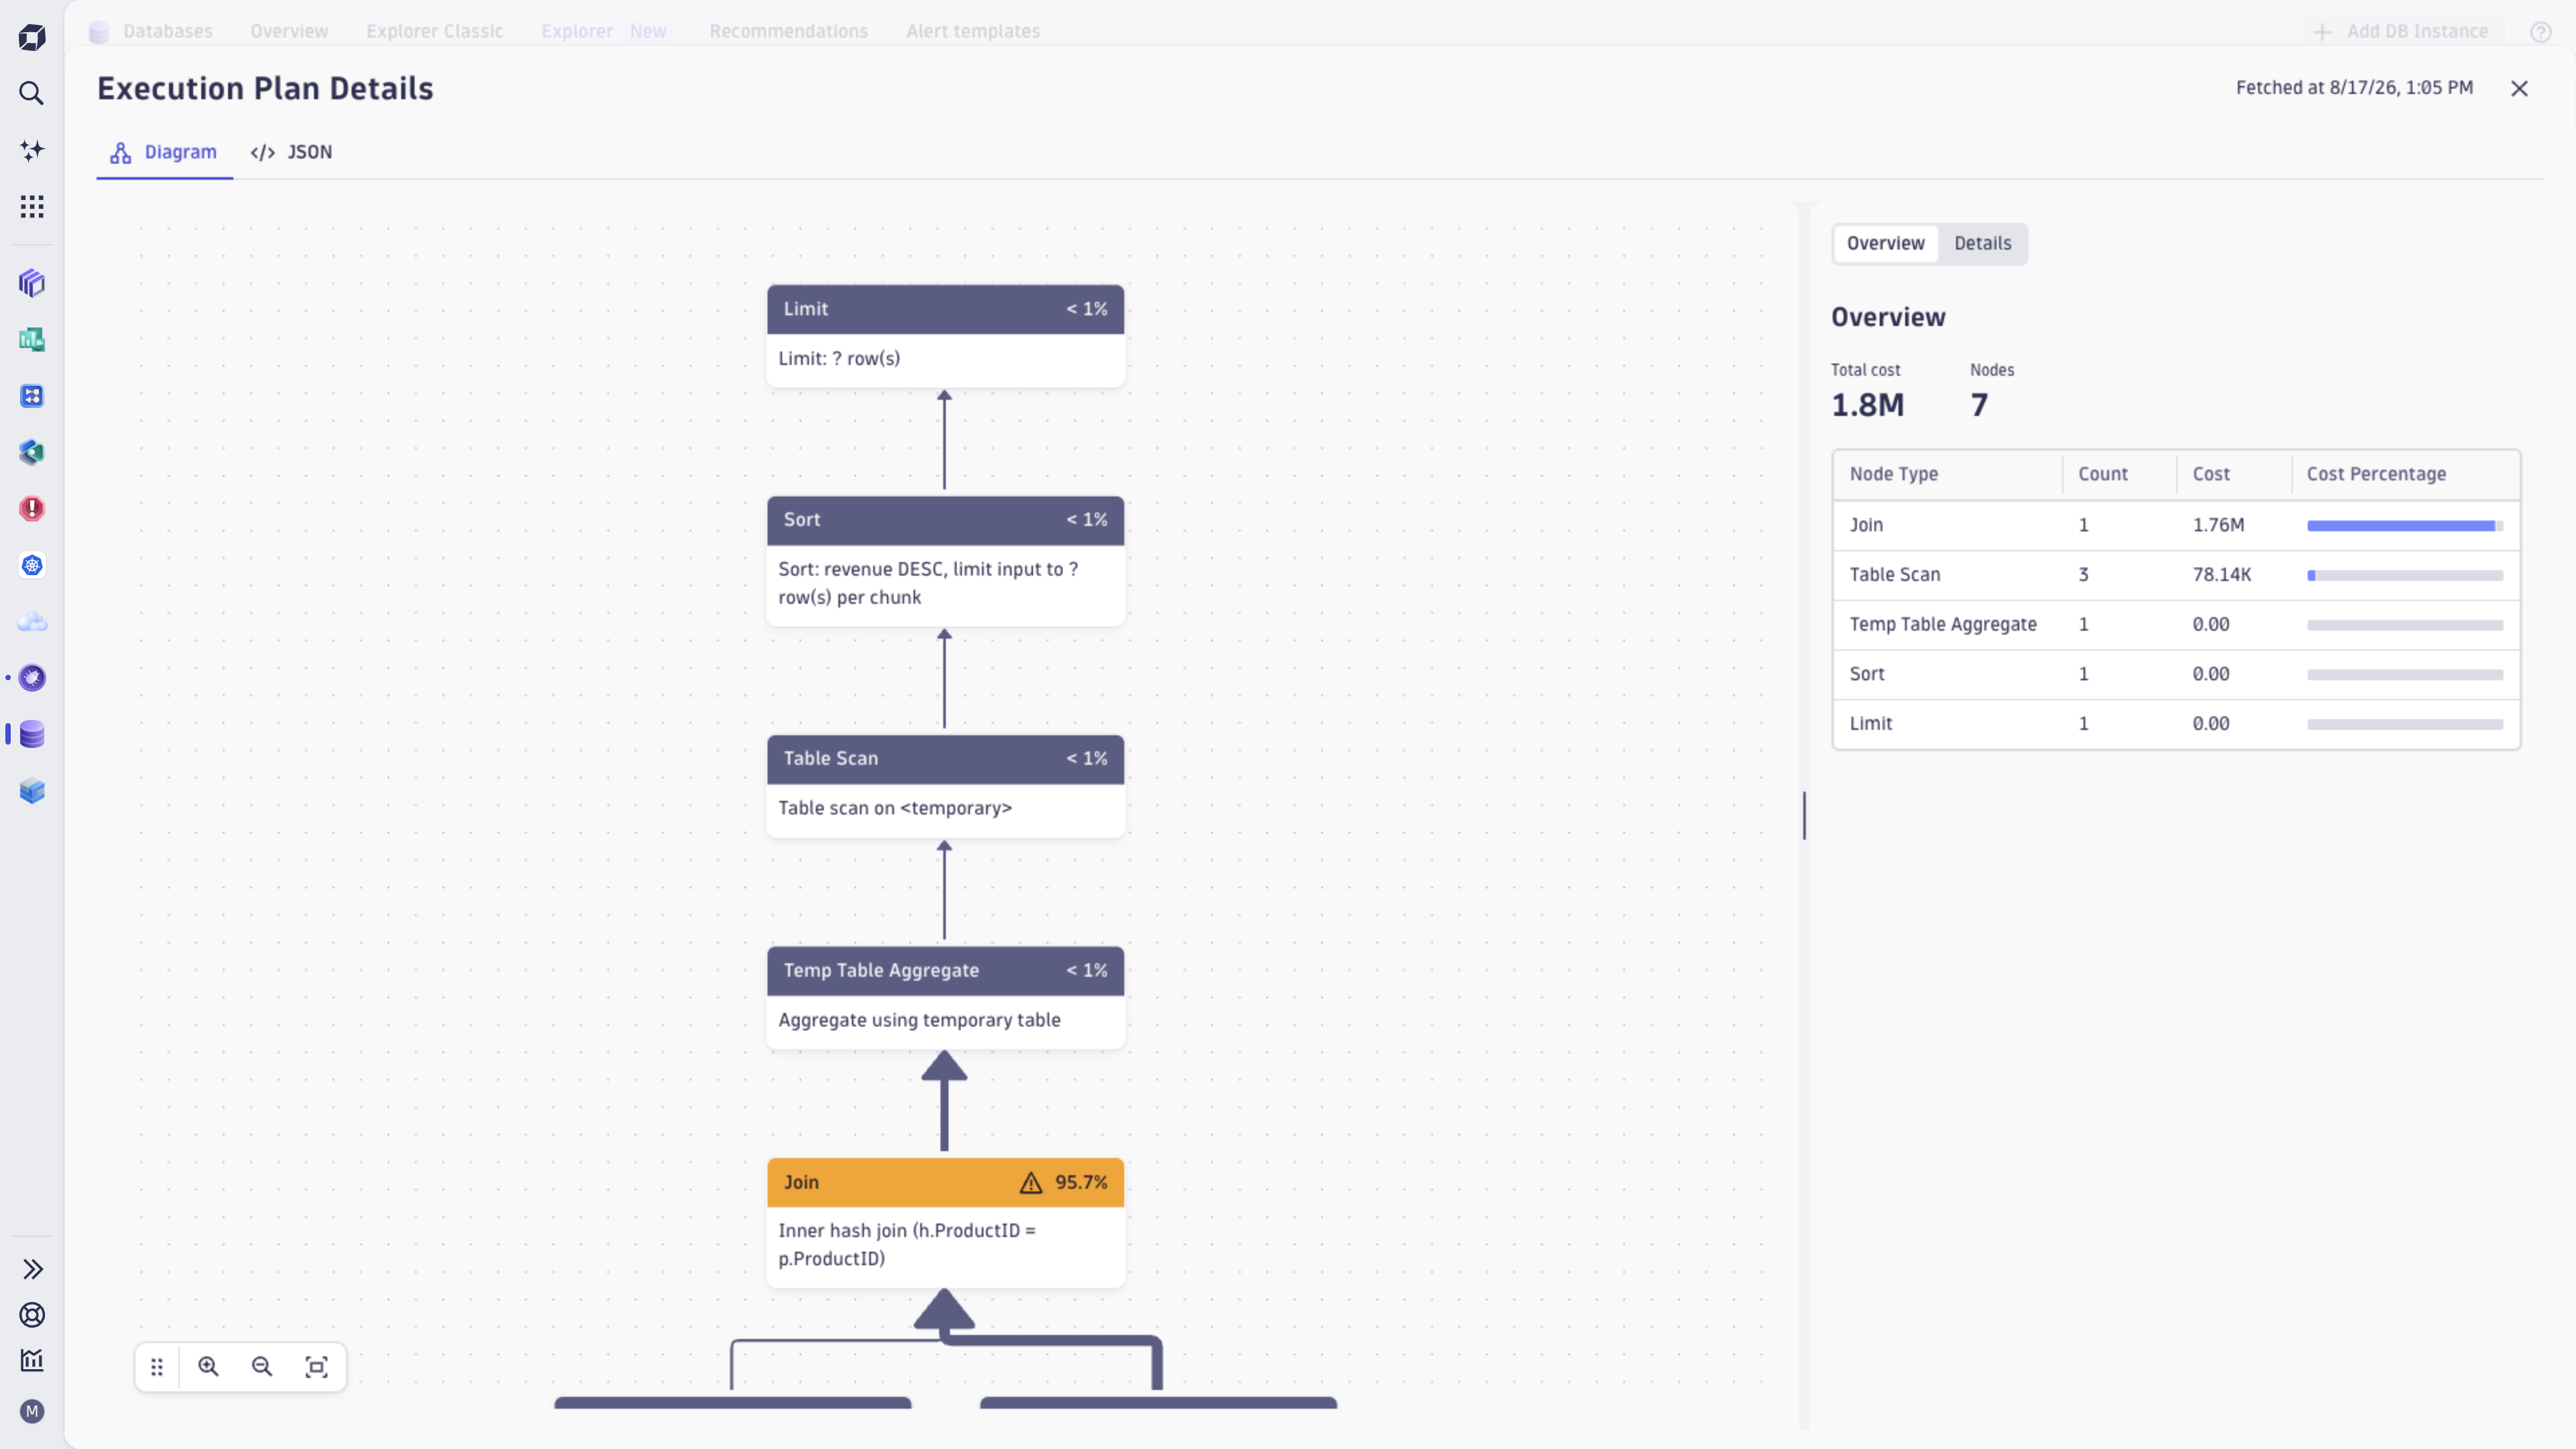
- Access execution plans to understand query interactions and identify optimization opportunities.
Statement performance
If the extension provides related information, you can display Statement performance analysis to track the performance of statements that consume the most resources.
To focus your analysis:
- Set the Filter statements to a search string.
- Set Contextual analysis to the context of predefined metrics (Time, CPU, Disk, or Waits), or select the column settings icon to customize columns and adapt the context to your needs.
- Select the Request execution plan to understand how the database executes the statement for optimization.
Advanced features
The app helps you proactively address potential issues before they affect operations, reduce downtime, and improve reliability.
- Detect and resolve anomalies that use AI-powered analysis.
- Pinpoint root causes of performance degradation or failures.
- Receive actionable recommendations for query and configuration optimizations.
Benefits
Databases helps you maintain reliable, efficient, and optimized database operations. The app addresses issues proactively and provides actionable insights, allowing you to focus on strategic priorities.
- Minimize downtime: Detect and resolve issues before they impact operations.
- Improve performance: Optimize queries, schemas, and configurations for better efficiency.
- Ensure reliability: Support stable database operations across diverse environments.
- Enhance productivity: Automate observability tasks and reduce manual troubleshooting.
Concepts
Health score
See a single composite score that summarizes each database instance's health on the Overview tab.
Health alerts and warning signals
Get alerted when critical conditions occur, and catch emerging issues early through warning signals.
Statements and execution plans
Collect SQL statements and execution plans, and help you identify, analyze, and troubleshoot query performance.
Blocking queries and deadlocks
Helps you detect and troubleshoot lock contention, blocking queries, and deadlocks.
Database monitoring approaches
Identify and compare database instance monitoring and host infrastructure monitoring.
Use cases
Understand database healt
Databases provides a real-time overview of your database's health. The app continuously evaluates key metrics to provide a health score that reflects the current state of your database environment. This health score helps you quickly identify areas that might require attention.
- Tracks performance indicators such as query execution times, resource utilization, and connection issues.
- Highlights anomalies and potential risks affecting database reliability.
Analyze and optimize query performance
Queries are often the root cause of database inefficiencies. The app provides tools to analyze query execution and identify areas for improvement. This ensures that your databases can handle workloads effectively.
- Detects slow or inefficient queries that impact database performance.
- Provides recommendations for query optimizations, such as rewriting queries or adding indexes to improve performance.
- Offers detailed execution plans to help you understand how queries interact with your database.
Detect and resolve database issues
Databases helps you address problems before they affect your database operations. The app uses Dynatrace AI capabilities to identify issues, analyze their root causes, and suggest actionable solutions.
- Detects anomalies in database behavior using AI-powered analysis.
- Pinpoints root causes of performance degradation or failures.
- Recommends remediation steps, such as configuration changes or query optimizations, based on actionable insights.
Integrate with Dynatrace for end-to-end observability
Databases is part of the Dynatrace ecosystem and provides comprehensive observability across your entire technology stack. The app integrates with other Dynatrace tools to provide a unified view of your database and its dependencies.
- Grail: Processes large volumes of data for scalable analytics.
- Smartscape: Maps real-time dependencies for context-aware analysis.
- Dynatrace Intelligence AI: Detects anomalies and provides intelligent recommendations.
 Databases