Upgrade Log Monitoring Classic to Log Management and Analytics
- Dynatrace Classic
- 5-min read
Log Management and Analytics is the latest Dynatrace log monitoring solution. With the introduction of Dynatrace Platform and Grail, we encourage you to upgrade to the latest log monitoring offer.
Log Monitoring Classic (SaaS) will reach end-of-life by 2027. For details, see the Log Monitoring Classic end-of-life announcement in our release notes.
We recommend upgrading to Log Management and Analytics well in advance by following the instructions on this page.
Upgrade from Log Monitoring Classic to Log Management and Analytics?
Once your environment is enabled for activation:
- Go to
 Logs & Events Classic.
 - In the banner message, select Go to activation page and select Activate Logs powered by Grail.
- On the Activate Grail for log and events page you can select:
- Activate now
- Wait 7 days
- Select Confirm to verify your choice.
- Only administrative users can activate Log Management and Analytics for the environment.
- Activating Log Management and Analytics is not reversible.
Upgrade with existing data
You can choose to upgrade with your existing log data.
- If you choose Wait 7 days on the Activate Grail for log and events page, Grail activation will be postponed for 7 days. During that timeframe, your log data will be ingested into both Log Monitoring Classic and Grail. After the 7 day period ends, Grail will be activated automatically and you will begin using Log Management and Analytics with 7 days of existing data.
- If you require log data for a longer period before upgrading, contact a Dynatrace product expert via live chat and request the longer wait time.
- If upgrading with existing data is not important for you, choose Activate now on the Activate Grail for log and events page and Logs powered by Grail will become active in about 30 seconds.
What changes after activation
After activating Log Management and Analytics, the following changes take place:
-
Ingested log data
- Ingested log data is saved in the Grail database.
- Ingested log data can be routed to buckets with different retention periods.
-
DDU consumption
- When you activate Log Management and Analytics, you begin consuming DDUs under a new model with three dimensions: Ingest & Process, Retain, Query.
- If you choose Wait 7 days, you'll still start consuming DDUs for ingestion and retention under the new model immediately and for querying after you run your first DQL query.
-
API
- The log export API will not be available. We recommend that you stop using Log GET search and Log GET aggregate. If you continue using them, they require an OAuth2 token with the
storage:logs:readandstorage:buckets:readscopes. - We recommend that you switch from existing APIs to the Grail Query API.
- The log export API will not be available. We recommend that you stop using Log GET search and Log GET aggregate. If you continue using them, they require an OAuth2 token with the
-
No support for Management Zones
- Management Zones configuration will not work with Grail. You have to use buckets and policies for access control. Please check the User access section below.
What does not change after activation
After activating Log Management and Analytics, the following will not change:
- Ingestion configuration, including OneAgent configuration and generic API ingest.
- Log processing, including processing rules with matchers based on the LQL syntax.
- Log metrics, including metric queries based on the LQL syntax.
- Log events, including event queries based on the LQL syntax.
- We recommend using OpenPipeline after the upgrade as a scalable, powerful solution to manage, process, and analyze data.
- In case you used the classic pipeline prior to the upgrade, we recommend migrating your classic pipeline to OpenPipeline.
User access
The user access granting process depends on whether you are a new or existing user.
-
Assign policy to existing users
After activating Log Management and Analytics, all users who already had access to log data are assigned a new policy to access the log data in Grail. -
Assign policy to new users
There are two options for configuring access policies for Grail:
Assign policy using Account Admin
In Dynatrace SaaS, only admin users can manage policies (users with account permission
Manage users).
You need to have two policies, Storage Events Read and Storage Logs Read assigned, bound to a group.To check if your policies are assigned
- Go to Account Management.
- Go to Identity & access management > Policy management.
- Check if Storage Events Read and Storage Logs Read are present on the policy list.
If Storage Events Read and Storage Logs Read are not present on you policy list, you need to add them manually:
- Storage Events Read:
Policy name: Storage Events Read
Policy description: Enables reading events from GRAIL
Policy statements:ALLOW storage:events:read - Storage Logs Read:
Policy name: Storage Logs Read
Policy description: Enables reading logs from GRAIL
Policy statements:ALLOW storage:logs:read
For details, see Manage IAM policies.
To make a policy effective, you need to bind it to a group.
- Go to Account Management.
- Select Identity & access management > Group management.
For details, see Working with policies. - Edit the group to which you want to bind the policy (for example, Logs and events). Make sure the users who need to use the Logs and events have this group assigned to their names.
- Select the Policies tab.
Assign policy via API
-
Obtain an OAuth token Make a POST call with form parameters to SSO.
- client_id = [client_id]
- client_secret = [secret]
- grant_type = client_credentials
- scope =
iam:policies:write iam:policies:read
In response, you get an authorization token
{"scope": "iam:policies:read iam:policies:write","token_type": "Bearer","expires_in": 300,"access_token": "123(...)ABC"} -
Create a storage events read policy Make a POST call to IAM
Body payload for the policy is:
{"name": "Storage Events Read","description": "Storage Events Read","tags": [],"statementQuery": "ALLOW storage:events:read;" -
Create a storage logs read policy Make a POST call to IAM
Body payload for the policy is:
{"name": "Storage Logs Read","description": "Storage Logs Read","tags": [] ,"statementQuery": "ALLOW storage:logs:read;"}
Your newly created policies will be visible on the account level. To check it, go to Account Management > Identity & access management > Policy management > Edit Storage Events Read.
Identify Logs Classic presence
If you are not sure or want to double-check if your environment is using Log Monitoring Classic, and is thus impacted by its end-of-life, use one of the methods described below.
This table lists the entities that you can access only when either Log Monitoring Classic or Log Management and Analytics is active in your environment.
| Logs Classic | Log Management and Analytics | |
|---|---|---|
Check "logs powered by Grail" activation settings
- Go to Settings (Dynatrace Classic) or Settings Classic (Latest Dynatrace).
- Navigate to Log Monitoring > Activate logs powered by Grail.
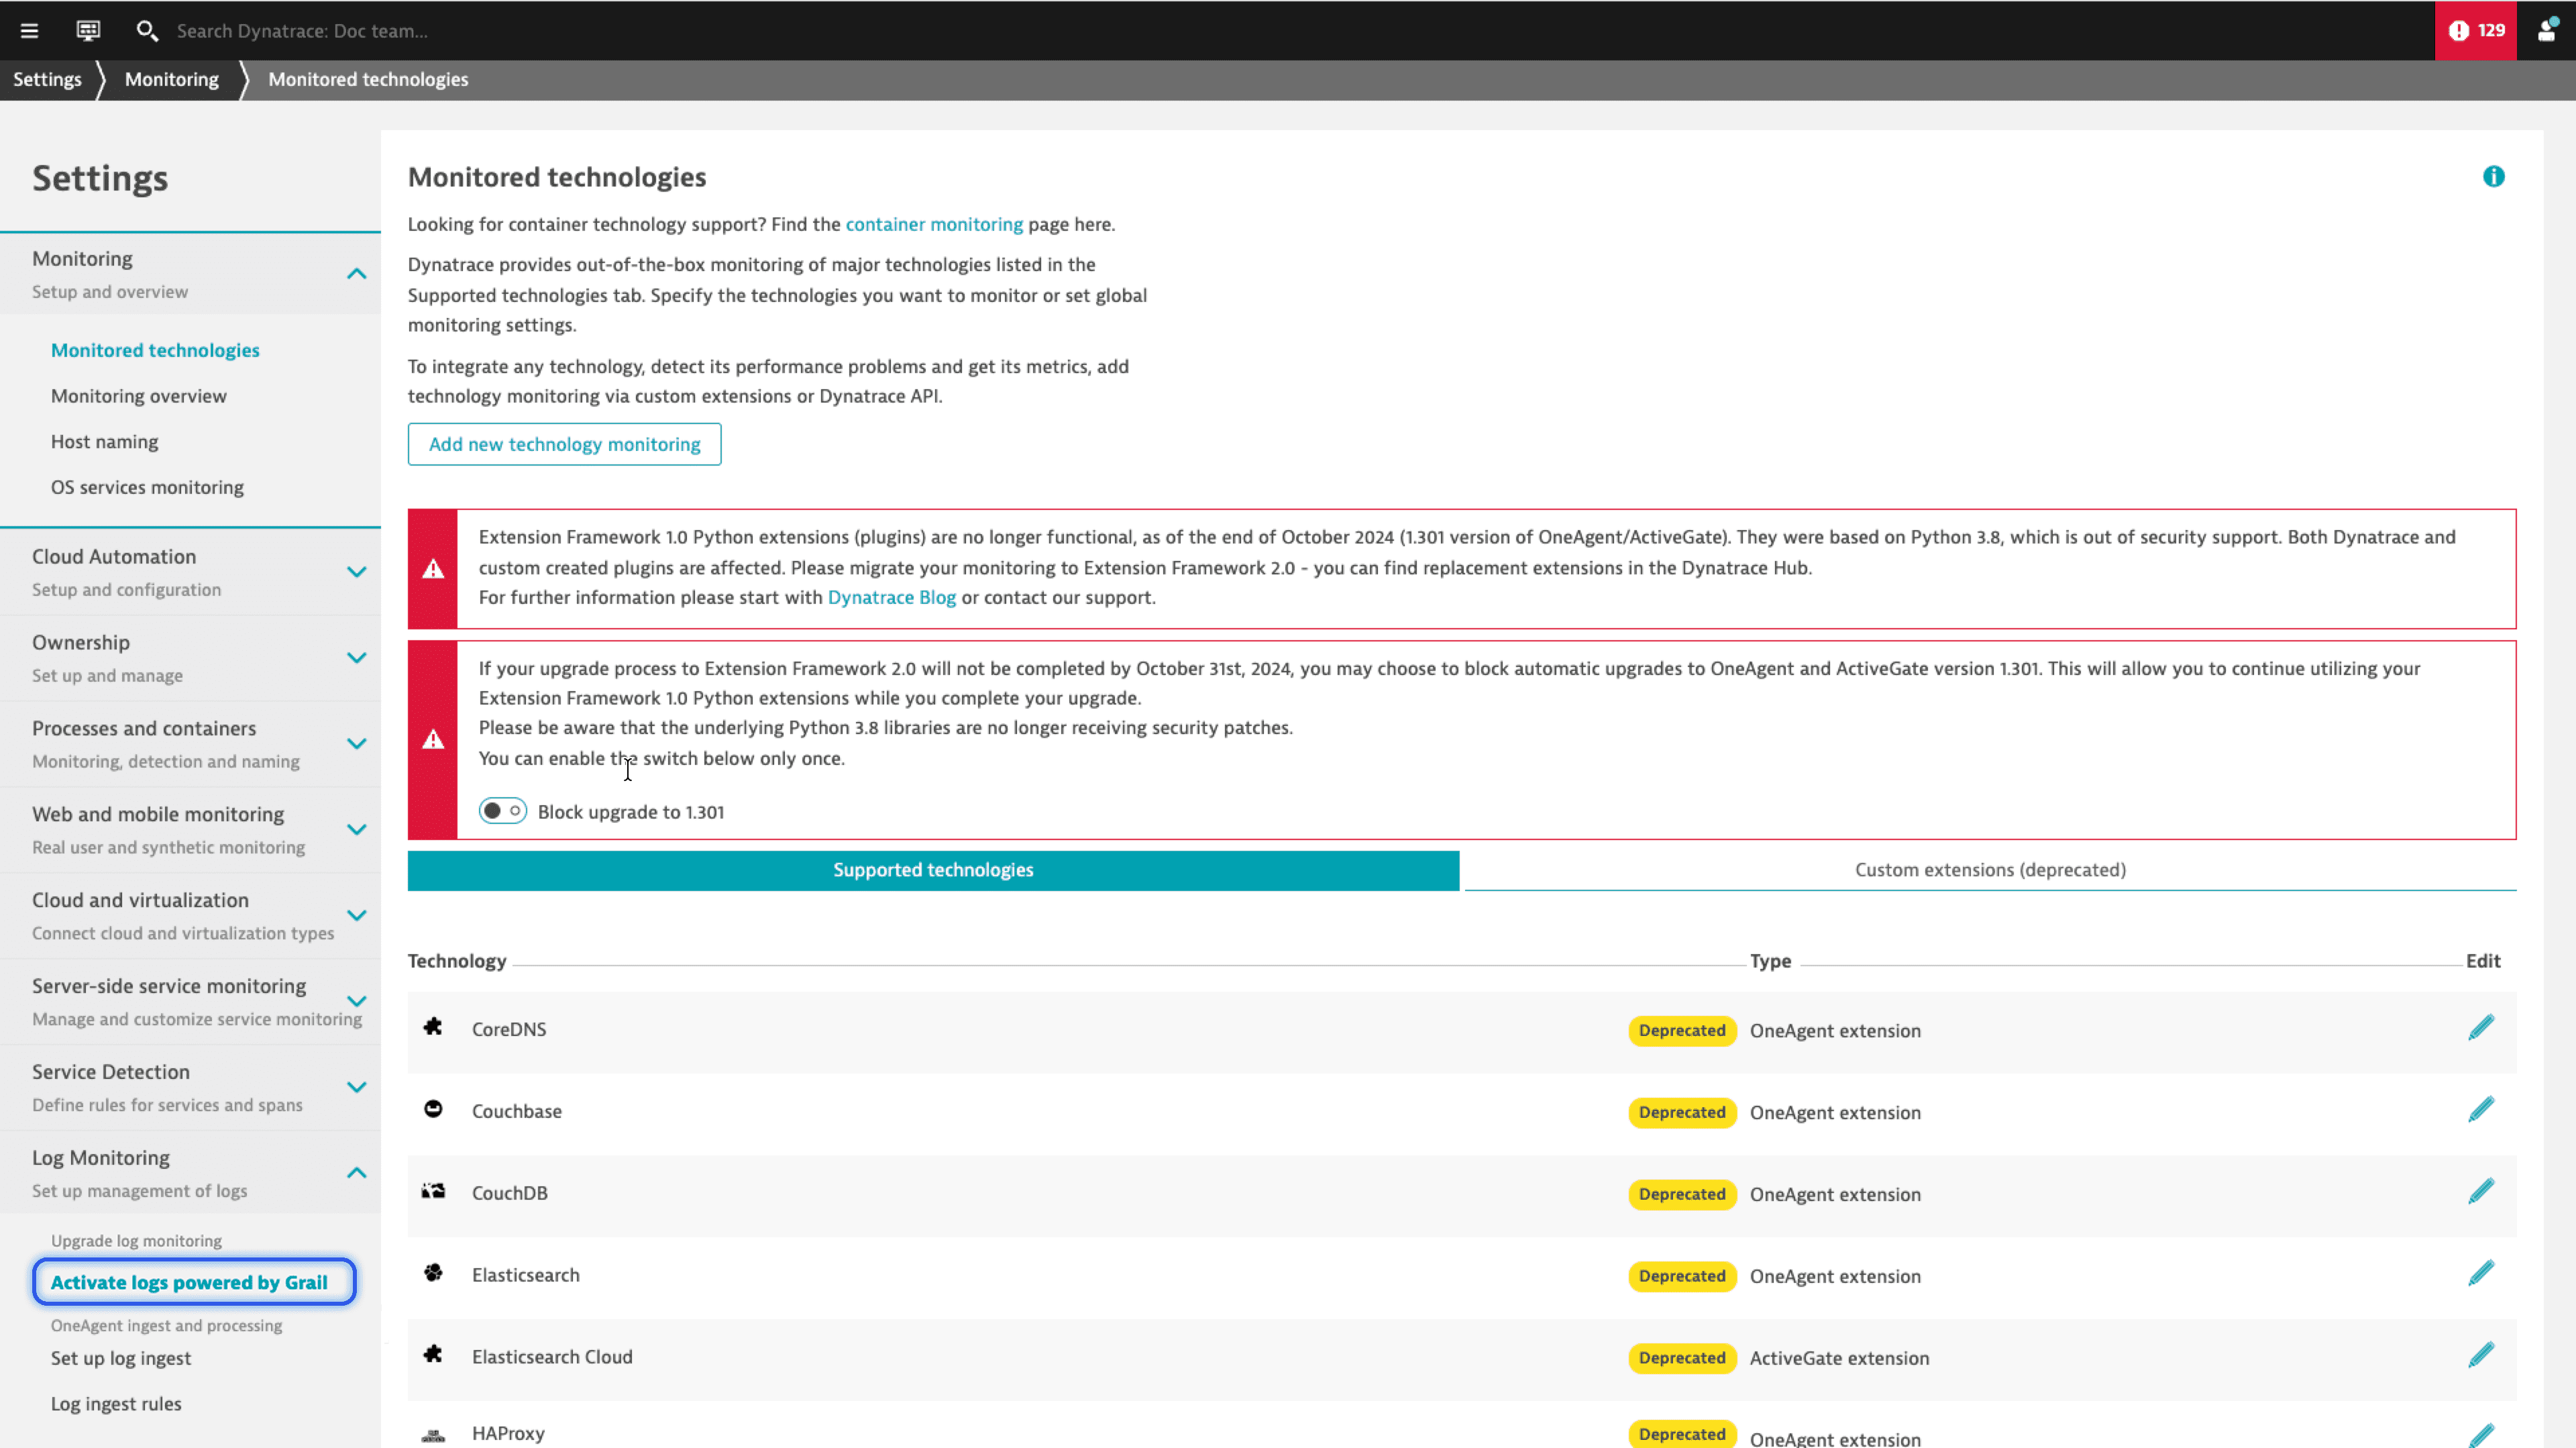
If this menu is available, Log Monitoring Classic is currently active in your environment.
If this menu is not visible, it does not guarantee that Log Monitoring Classic has already been upgraded. It could mean that Log Monitoring Classic is active, but the upgrade to Grail is disabled due to your contract. Alternatively, Grail may already be active in this environment. Continue with the next method to verify.
Access the classic Logs page
-
Open the classic Logs page in your Dynatrace Classic environment by following this link:
https://<your-environment-id>.live.dynatrace.com/ui/log-monitoring/. Don't forget to replace<your-environment-id>with your environment ID, for example,wkf12345. -
Check whether you can see the classic Logs page, along with the Log Viewer tile.
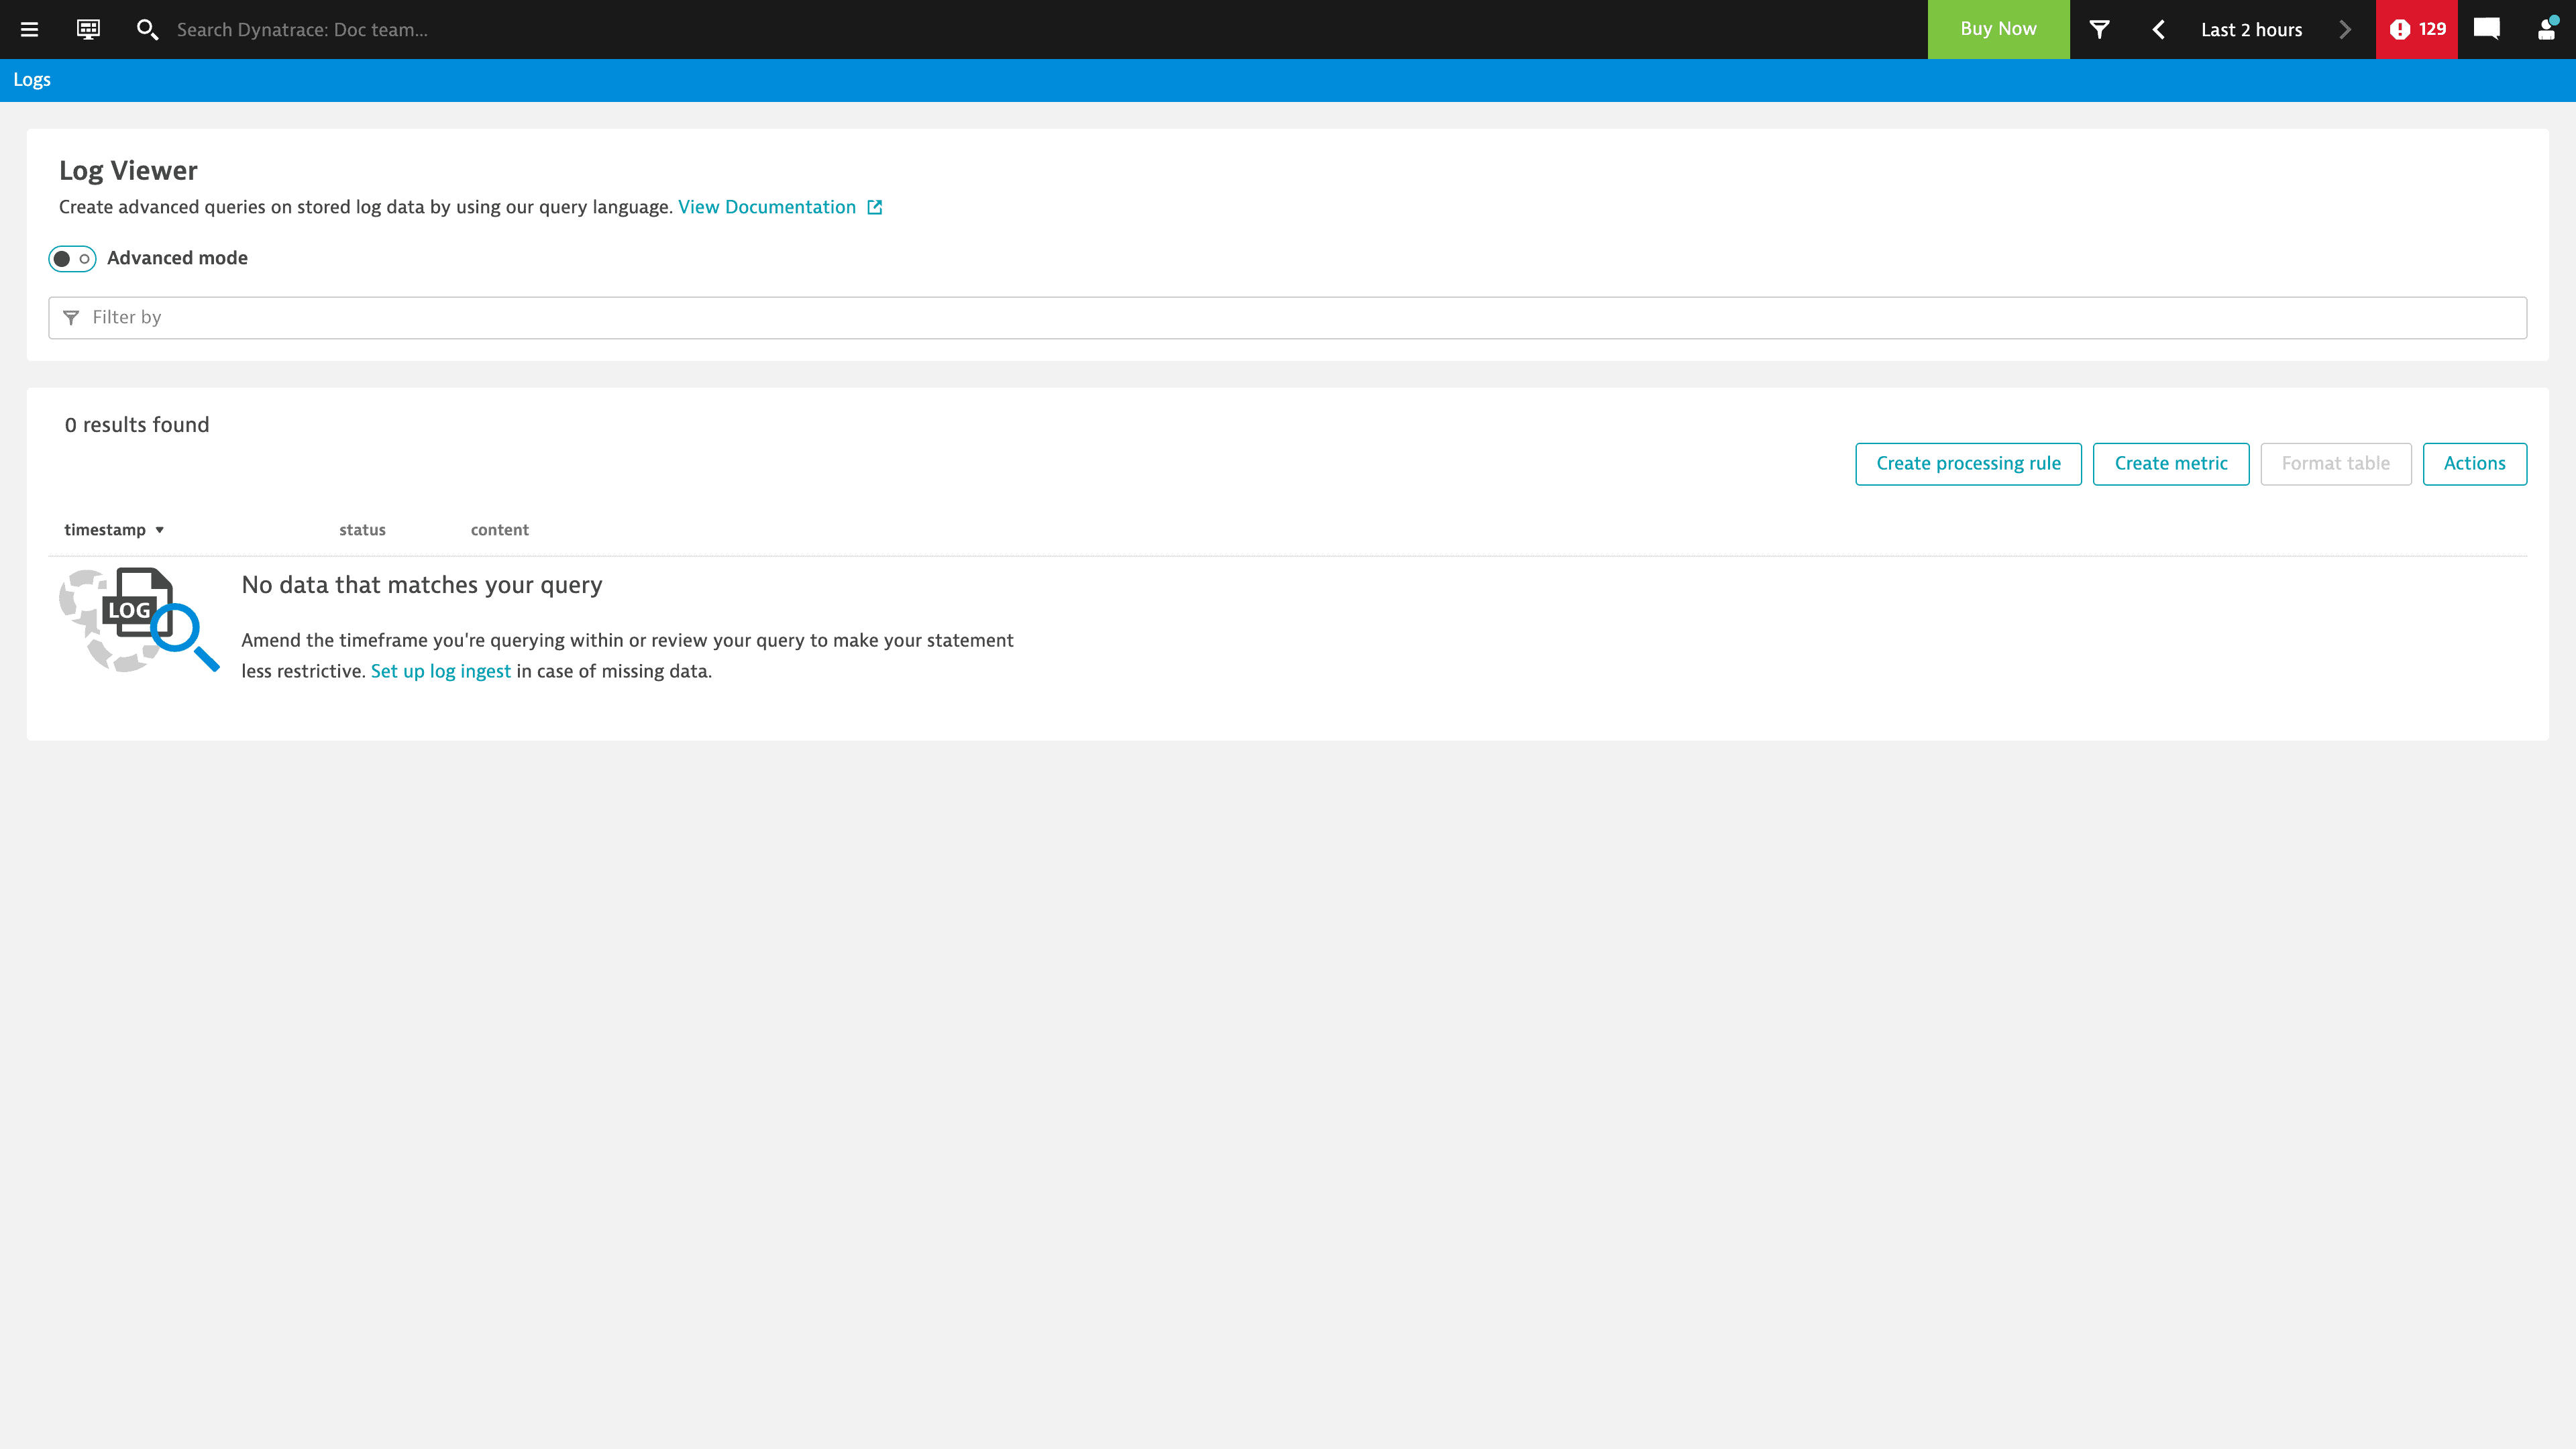
If you can open this page, Log Monitoring Classic is active and Log Management and Analytics powered by Grail is disabled.
If you can't open this page, it does not guarantee that Log Monitoring Classic is disabled. You could be missing permissions to access the page. Continue with the next method to verify.
Access the classic Logs and events page
-
Open the classic Logs and events | Powered by Grail page in your Dynatrace environment by following this link:
https://<your-environment-id>.apps.dynatrace.com/ui/apps/dynatrace.classic.logs.events/ui/logs-events/. Don't forget to replace<your-environment-id>with your environment ID, for example,wkf12345. -
Check whether you can see the classic Logs and events page.
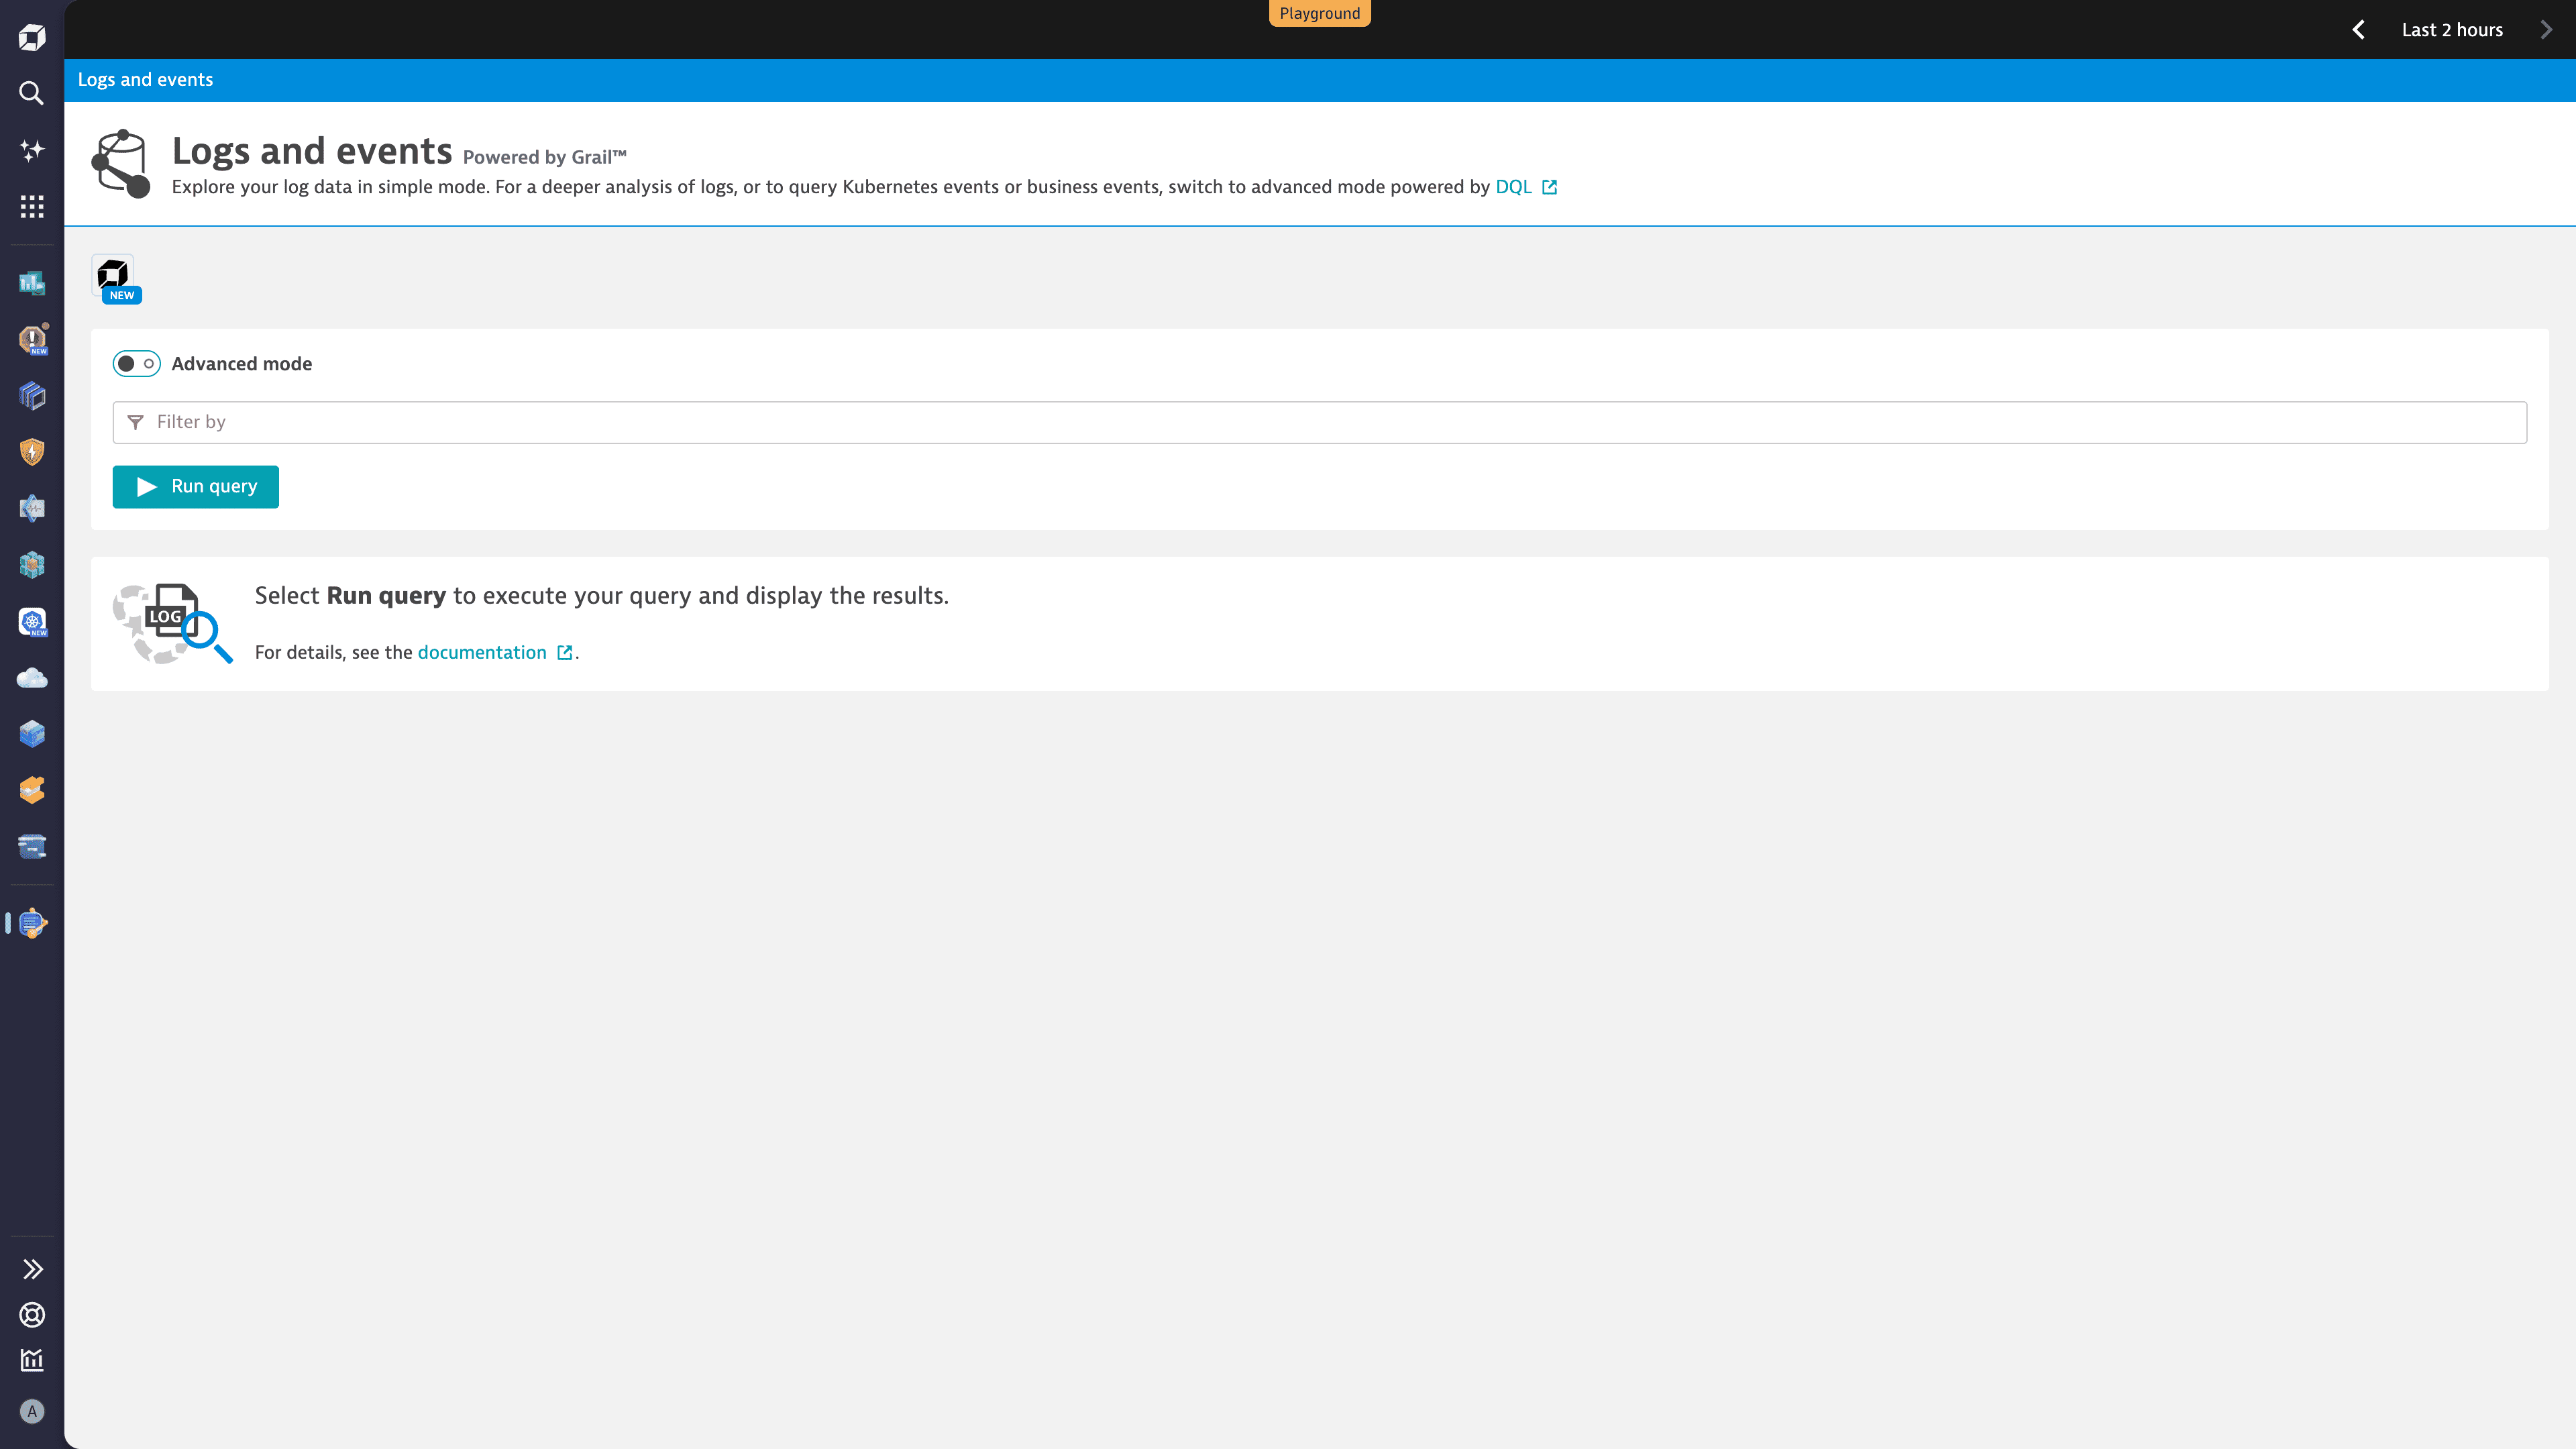
If you can open this page, Log Monitoring Classic is disabled and Log Management and Analytics powered by Grail is active.
If you can't open this page, it does not guarantee that Log Monitoring Classic is still active. The classic Logs and events page might be disabled, with only the new platform apps available.