Syslog ingestion with ActiveGate
- Latest Dynatrace
- How-to guide
- 8-min read
ActiveGate version 1.295+ Recommended
Syslog, short for System Logging Protocol, is a logging mechanism that allows system administrators to oversee and control log files from various system components, such as network devices, Linux hosts, syslog servers, or other syslog producers.
This guide shows you how to configure your Environment ActiveGate on Linux to collect syslog logs in your network and ingest them to Dynatrace.
Multi-environment ActiveGates do not support syslog ingestion.
Prerequisites
-
Environment ActiveGate version 1.295+ on Linux installed to monitor remote technologies.
-
Your network devices have syslog enabled, or you have other syslog producers configured in your network. Refer to RFC 3164 and RFC 5424 for details. Dynatrace supports a wide variety of syslog implementations, including RSysLog, Syslog-NG, NXLog, and others.
-
By default, the ingested syslogs must be in the format defined by RFC 3164 and RFC 5424. If your devices produce non-standard syslog entries, you need to transform them to the supported format using Dynatrace OpenPipeline processing.
RFC 3164 requires a receiver configuration. For details, see the Edit the syslog receiver configuration step under Enable syslog ingestion.
Hardware requirements
Syslog ingestion is performed by an ActiveGate. The syslog ingestion throughput depends on the hardware on which your ActiveGate is deployed.
| CPUs | RAM (GB) | Maximum throughput |
|---|---|---|
4 | 16 | ~1TB/day |
8 | 32 | ~2.7TB/day |
Target audience
This guide is intended for network and Dynatrace administrators who are tasked to enable the syslog log ingestion into Dynatrace.
Enable syslog ingestion
To enable syslog ingestion
-
Deploy Environment ActiveGate.
Deploy Environment ActiveGate in a place ensuring connectivity between ActiveGate and the monitored devices. See instructions for Linux, and use the remote technologies monitoring purpose.
-
Enable syslog ingestion on your ActiveGate.
Add the following flag to the
/var/lib/dynatrace/remotepluginmodule/agent/conf/extensionsuser.conffile:syslogenabled=true -
Optional Edit the syslog receiver configuration.
ActiveGate uses an embedded Dynatrace OpenTelemetry Collector instance and stores the receiver configuration in the
/var/lib/dynatrace/remotepluginmodule/agent/conf/syslog.yamlfile. The Collector is installed by default.Use this configuration only for syslog ingestion.
If your syslog producers use the default ports per supported protocols, your syslog-enabled ActiveGate should receive syslog records right away.
If your syslog producers send events on custom ports or the syslog protocol is RFC 3164, modify the syslog receiver configuration. For details, see Ingest syslog data with the OTel Collector.
Default syslog receiver configuration
receivers:syslog/udp:udp:listen_address: '0.0.0.0:514'add_attributes: trueprotocol: rfc5424operators:- type: syslog_parserprotocol: rfc5424syslog/tcp:tcp:listen_address: '0.0.0.0:601'add_attributes: trueprotocol: rfc5424operators:- type: syslog_parserprotocol: rfc5424# syslog/tcp_tls:# tcp:# listen_address: "0.0.0.0:6514"# tls:# cert_file: "/absolute/path/to/server.crt"# key_file: "/absolute/path/to/server.key"# protocol: rfc5424# operators:# - type: syslog_parser# protocol: rfc5424#DO.NOT.MODIFYexporters:otlp_http/syslog: ${file:syslogendpoint.yaml}processors:batch:send_batch_size: 512send_batch_max_size: 1024transform:log_statements:- context: logstatements:- set(body, attributes["message"])attributes:actions:- key: net.host.nameaction: delete- key: net.peer.nameaction: delete- key: net.peer.portaction: delete- key: net.transportaction: delete- key: net.host.ipaction: delete- key: dt.ingest.portfrom_attribute: net.host.portaction: upsert- key: dt.ingest.source.ipfrom_attribute: net.peer.ipaction: upsert- key: net.peer.ipaction: delete- key: net.host.portaction: delete- key: syslog.hostnamefrom_attribute: hostnameaction: upsert- key: hostnameaction: delete- key: syslog.facilityfrom_attribute: facilityaction: upsert- key: facilityaction: delete- key: syslog.priorityfrom_attribute: priorityaction: upsert- key: priorityaction: delete- key: syslog.proc_idfrom_attribute: proc_idaction: upsert- key: proc_idaction: delete- key: syslog.versionfrom_attribute: versionaction: upsert- key: versionaction: delete- key: syslog.appnamefrom_attribute: appnameaction: upsert- key: appnameaction: delete- key: messageaction: deleteservice:telemetry:metrics:level: nonepipelines:logs/udp:receivers: [syslog/udp]processors: [transform, attributes, batch]exporters: [otlp_http/syslog]logs/tcp:receivers: [syslog/tcp]processors: [transform, attributes, batch]exporters: [otlp_http/syslog]# logs/tcp_tls:# receivers: [syslog/tcp_tls]# processors: [transform, attributes, batch]# exporters: [otlp_http/syslog]Do not modify the exporter configuration. It's preconfigured to forward your syslogs to the Dynatrace Environment.
-
Verify syslog ingestion is enabled.
Open the newest
ruxit_extensionmodule_*.loglog file in the/var/lib/dynatrace/remotepluginmodule/log/extensionsdirectory, and make sure it contains the following line:Otel syslog enabled: true -
Enable syslog on the devices you want to monitor.
The way you enable syslog depends on the device and its platform, so refer to the specific documentation for details.
Example: Configure Rsyslog on Linux Ubuntu to forward syslog logs to a remote server
Add the following line to the syslog daemon configuration file (
/etc/rsyslog.conf):-
UDP
*.* @<ActiveGate host IP>:514 -
TCP
*.* @@<ActiveGate host IP>:601
The
*.*instructs the daemon to forward all messages to the specified ActiveGate listening on the provided port and IP address.<ActiveGate host IP>needs to point to the IP address of a syslog-enabled ActiveGate.For more examples, see Syslog via OpenTelemetry Collector
-
-
Verify ActiveGate receives the syslog events.
After your syslog producers start casting log records, open the latest
dynatracesourceotelcollector.*.logfile in/var/lib/dynatrace/remotepluginmodule/log/extensions/datasources/otelSyslog.If ActiveGate receives the log records, you should see entries as in the example below:
[otelSyslog][otelSyslog][37448][err]LogRecord #3[otelSyslog][oteiSyslog][37448][err]ObservedTimestamp: 2024-05-06 @9:52:10.6748723 +8000 UTC[otelSyslog][otelSyslog][37448][err]Timestamp: 2624-05-@6 11:52:16 +90e0 UTC[otelSyslog][otelsyslog][37448][err]SeverityText: info[otelSyslog][otelSyslog][37443][err]SeverityNumber: Info(9)[otelSyslog][otelSyslog][37448][err]Body: Str(<30>May 6 11:52:10 SOME-HOST systemd[1]: Finished Load Kernel Module fuse.)[otelSyslog][otelSyslog][37448][err]Attributes:[otelSyslog][otelSyslog][37448][err] -> priority: Int(3)[otelSyslog][otelSyslog][37448][err] -> facility: Int(3)[otelSyslog][otelSyslog][37448][err] -> appname: Str(systemd)[otelSyslog][otelSyslog][37448][err] -> proc_id: Str(1)[otelSyslog][otelSyslog][37443][err] -> log: Map({“source": “syslog"})[otelSyslog][otelSyslog][37443][err] -> hostname: Str(SOME-HOST)[otelSyslog][otelSyslog][37443][err] -> message: Str(Finished Load Kernel Module fuse.)[otelSyslog][otelSyslog][37448][err]Trace ID:[otelSyslog][otelSyslog][37448][err]Span ID:[otelSyslog][otelSyslog][37443][err]Flags: 0For more information on troubleshooting the syslog receiver, see Collector troubleshooting.
You've arrived! Now, your syslog-ingested events are enriched with the host-specific attributes and are available in Grail. Thanks to that, you can use these syslog entries for Dynatrace Intelligence-powered data analysis, log processing, or querying via DQL.
Mask sensitive data
ActiveGate syslog ingestion supports the OpenTelemetry Transform Processor and OpenTelemetry Transformation Language (OTTL) to process your syslog data at the edge, before sensitive data leaves your network.
This way, you can mask or hash sensitive data in your syslog lines so that no sensitive information is ingested into Dynatrace.
Let's assume a credit card number is visible in a syslog as follows:
<14>2 2024-07-19T14:53:55Z example-host 0OOButHPbR 1234 - - New operation for CreditCard 1234567891011124
To mask a credit card number, add the following configuration under the processors node of the syslog.yaml file. For details, see the Edit the syslog receiver configuration step under Enable syslog ingestion.
processors:transform/redact_credict_cart:log_statements:- context: logstatements:- replace_pattern(body, "\\d{15,16}", "REDACTED")
The replace_pattern function replaces the credit card number with the REDACTED string. The credit card number in the content is matched by the body, "\\d{15,16}" pattern.
Add custom attributes
You can also modify the default syslog receiver configuration if you want to group a set of various devices by configuring them to use a specific port. For example, using very generic log messages, you can enrich your syslog events sent to specific TCP ports with custom attributes using the configuration as in the example below.
receivers:syslog/f5:tcp:listen_address: "0.0.0.0:54526"protocol: rfc5424operators:- type: addfield: attributes.log.sourcevalue: syslog- type: addfield: attributes.dt.ip_addressesvalue: "1xx.xx.xx.xx1"- type: addfield: attributes.instance.namevalue: "ip-1xx-xx-x-xx9.ec2.internal"- type: addfield: attributes.device.typevalue: "f5bigip"syslog/host:tcp:listen_address: "0.0.0.0:54527"protocol: rfc5424operators:- type: addfield: attributes.log.sourcevalue: syslog- type: addfield: attributes.device.typevalue: "ubuntu-syslog"
You can also use:
deleteto exclude specific attributes from ingestion.upsertto insert a new attribute to your log line where the key does not already exist or to update an attribute where the key does exist.
For example, if you can read the net.peer.port attribute, its value is used for custom.remote.port. Otherwise, the custom.report.port isn't set.
attributes:actions:- key: custom.remote.portfrom_attribute: net.peer.portaction: upsert
For more information on the attribute configuration, see Attributes Processor.
Filter data
You can filter the syslog data to drop irrelevant log lines and reduce your consumption at the edge, before the data leaves your network.
For example, let's ignore log lines categorized with the syslog facility 21. Below is an example of such a syslog message.
<21> 2024-07-19T14:53:55Z example-host 0OOButHPbR 1234 - - Spam mail
Add the following filter to the syslog.yaml file. For details, see the Edit the syslog receiver configuration step under Enable syslog ingestion.
filter/mail:logs:log_record:- attributes["syslog.facility"] == 21
As a result, all log lines with the 21 syslog facility are no longer ingested.
Process logs with technology bundle parsers
Through OpenPipeline, you can use and configure technology bundles. A technology bundle is a library of parsers (processing rules) that process logs from various technologies, such as Java, .NET, and Microsoft IIS.
Parsers help you to improve filtering, troubleshooting, metrics, alerts, and dashboards by efficiently extracting log levels and relevant attributes. You can also use technology bundles to structure logs from technologies that are not supported by Dynatrace out of the box.
For more information, see Process logs with technology bundle parsers.
Process non-standard syslogs
Sometimes, even when the ingested syslogs follow the format defined by the syslog protocols, they might still slightly deviate from the supported standard. For example, they might contain an additional space or miss a timestamp. To fix that, transform such syslog entries using the Dynatrace OpenPipeline processing.
When there are differences from the syslog standard, the OpenTelemetry Collector fails to parse such syslog entries properly at ingest. They're still forwarded to Dynatrace but are not parsed on the syslog endpoint. Because of this, raw syslog messages are visible in Dynatrace, for example, in ![]() Logs or
Logs or  Notebooks.
You can expect errors like this:
Failed to process entry {"operator_id": "syslog_input_internal_parser", "operator_type": "syslog_parser", "error": "expecting a Stamp timestamp [col 5]", ...}
To fix this issue, use OpenPipeline to parse non-standard syslogs with the built-in Syslog technology bundle.
1. Create a pipeline for processing
- Go to
 Settings > Process and contextualize > OpenPipeline > Logs > Pipelines.
 - Select Pipeline, and enter a name for your new pipeline, for example, Non-standard syslog pipeline.
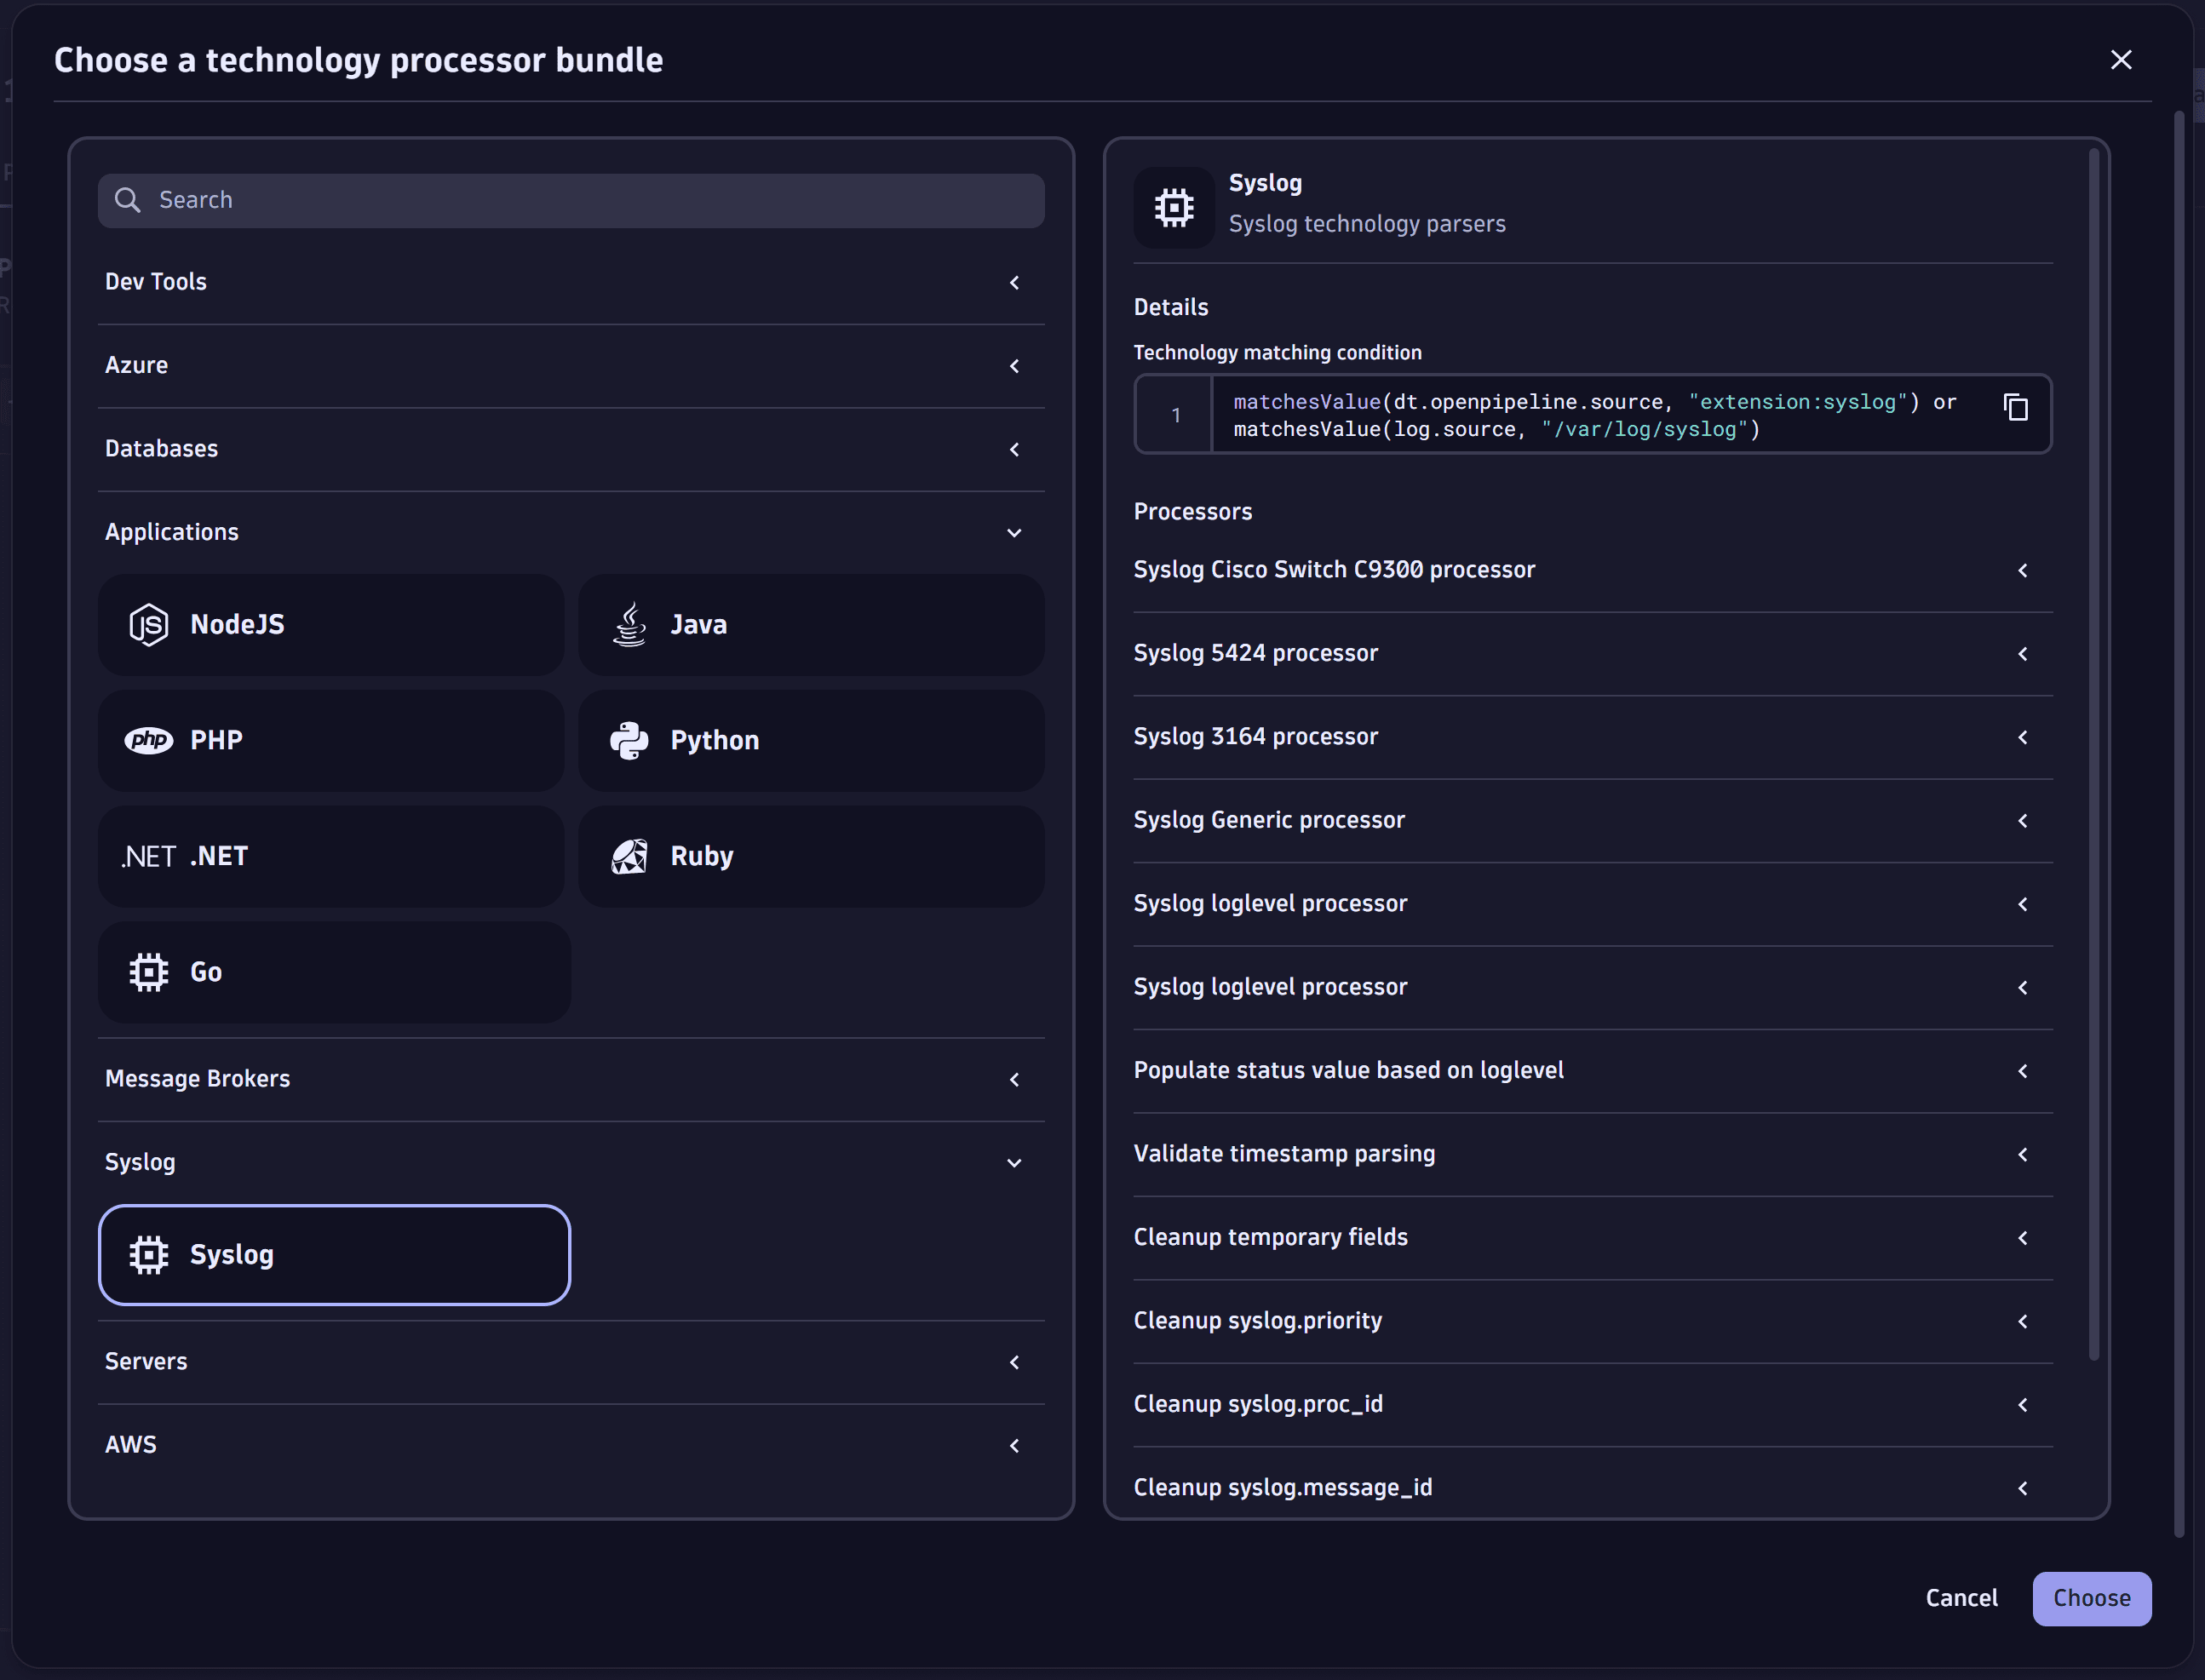
- Go to Processing > Processor > Technology bundle.
- From the list, select the Syslog technology bundle, and then select Choose in the lower-right corner of the page.
- Copy the technology matching condition under Details.
- Select Save.
You successfully created a pipeline and configured it with a processor to structure syslog entries using the Syslog technology bundle. The new pipeline is in the pipeline list.
2. Route data to the pipeline
- Go to Settings > Process and contextualize > OpenPipeline > Logs > Dynamic routing.
- Select Dynamic route, and enter the following details:
- Name: A descriptive name for the new dynamic route, for example, Non-standard syslog.
- Matching condition: The technology matching condition you copied before.
matchesValue(dt.openpipeline.source, "extension:syslog")
- Pipeline: The syslog pipeline you've created before, for example, Non-standard syslog pipeline.
- Select Add.
- Place the new dynamic route in the correct position on the list.
- Select Save.
You successfully configured a new dynamic route. All syslog logs are routed to the pipeline for processing. The new route is in the route list.
To learn more about dynamic routing, see Route data.
3. Add custom attributes
Optional
You can enrich syslogs at ingest with custom attributes, allowing you to route different syslog streams to separate pipelines. For details, see Add custom attributes.
For additional instructions and information on analyzing structured logs, see Process logs with technology bundle parsers.
Troubleshooting
Visit Dynatrace Community for troubleshooting guides, as well as see Troubleshooting Log Management and Analytics.