Logs app
- Latest Dynatrace
- App
- 4-min read
Prerequisites
Permissions
The following table describes the required permissions.
storage:spans:read
allow to read spans, Segments Variables (Optional)
storage:bizevents:read
allow to read biz events, Segments Variables (Optional)
storage:metrics:read
allow to read metrics, Segments Variables (Optional)
storage:events:read
allow to read events, Segments Variables (Optional)
storage:security.events:read
allow to read security events, Segments Variables (Optional)
storage:logs:read
allow to read logs
storage:user.sessions:read
allow to read user sessions, Segments Variables (Optional)
storage:user.events:read
allow to read user events
storage:buckets:read
allow to read logs
storage:files:read
allow to do joins on the lookup tables
Installation
Make sure the app is installed in your environment.
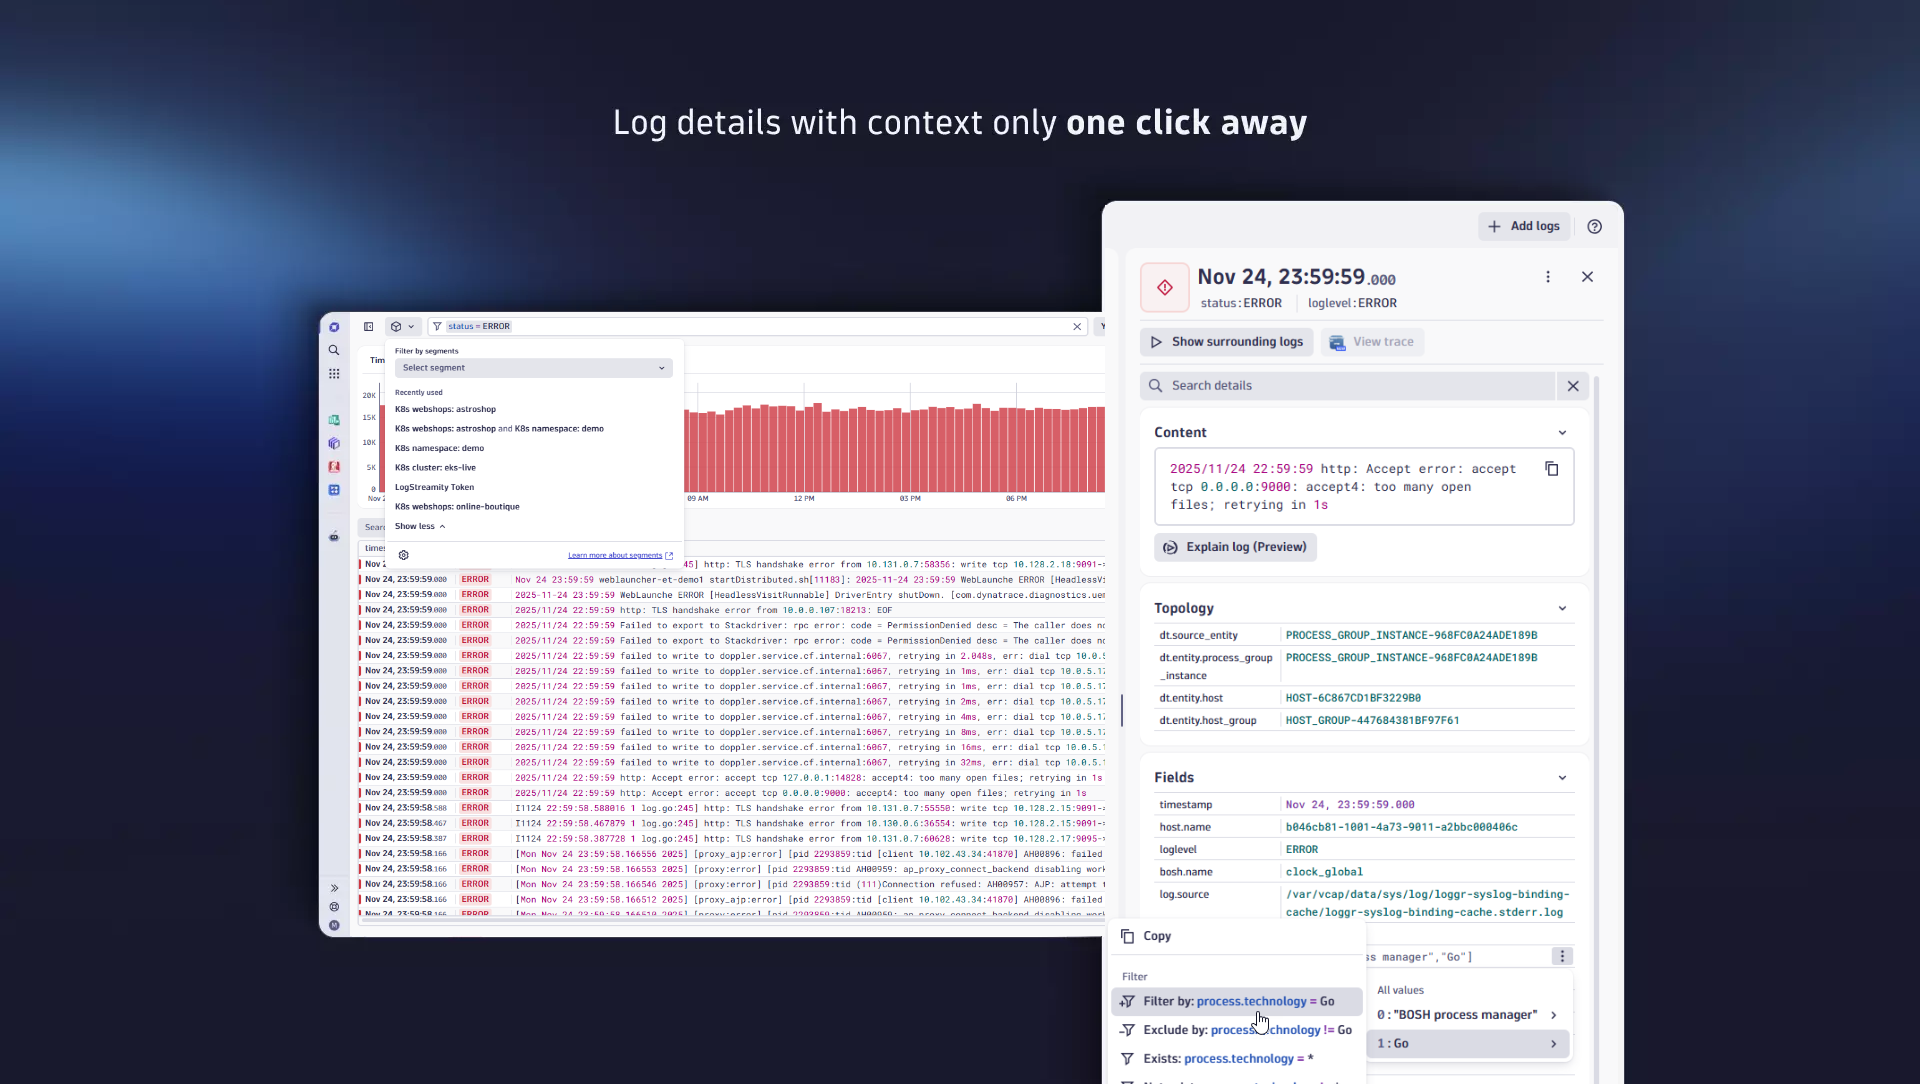
1 of 5The dynamic histogram chart with intuitive point-and-click filter provide unique experience for simplified and timely exploration of logs.
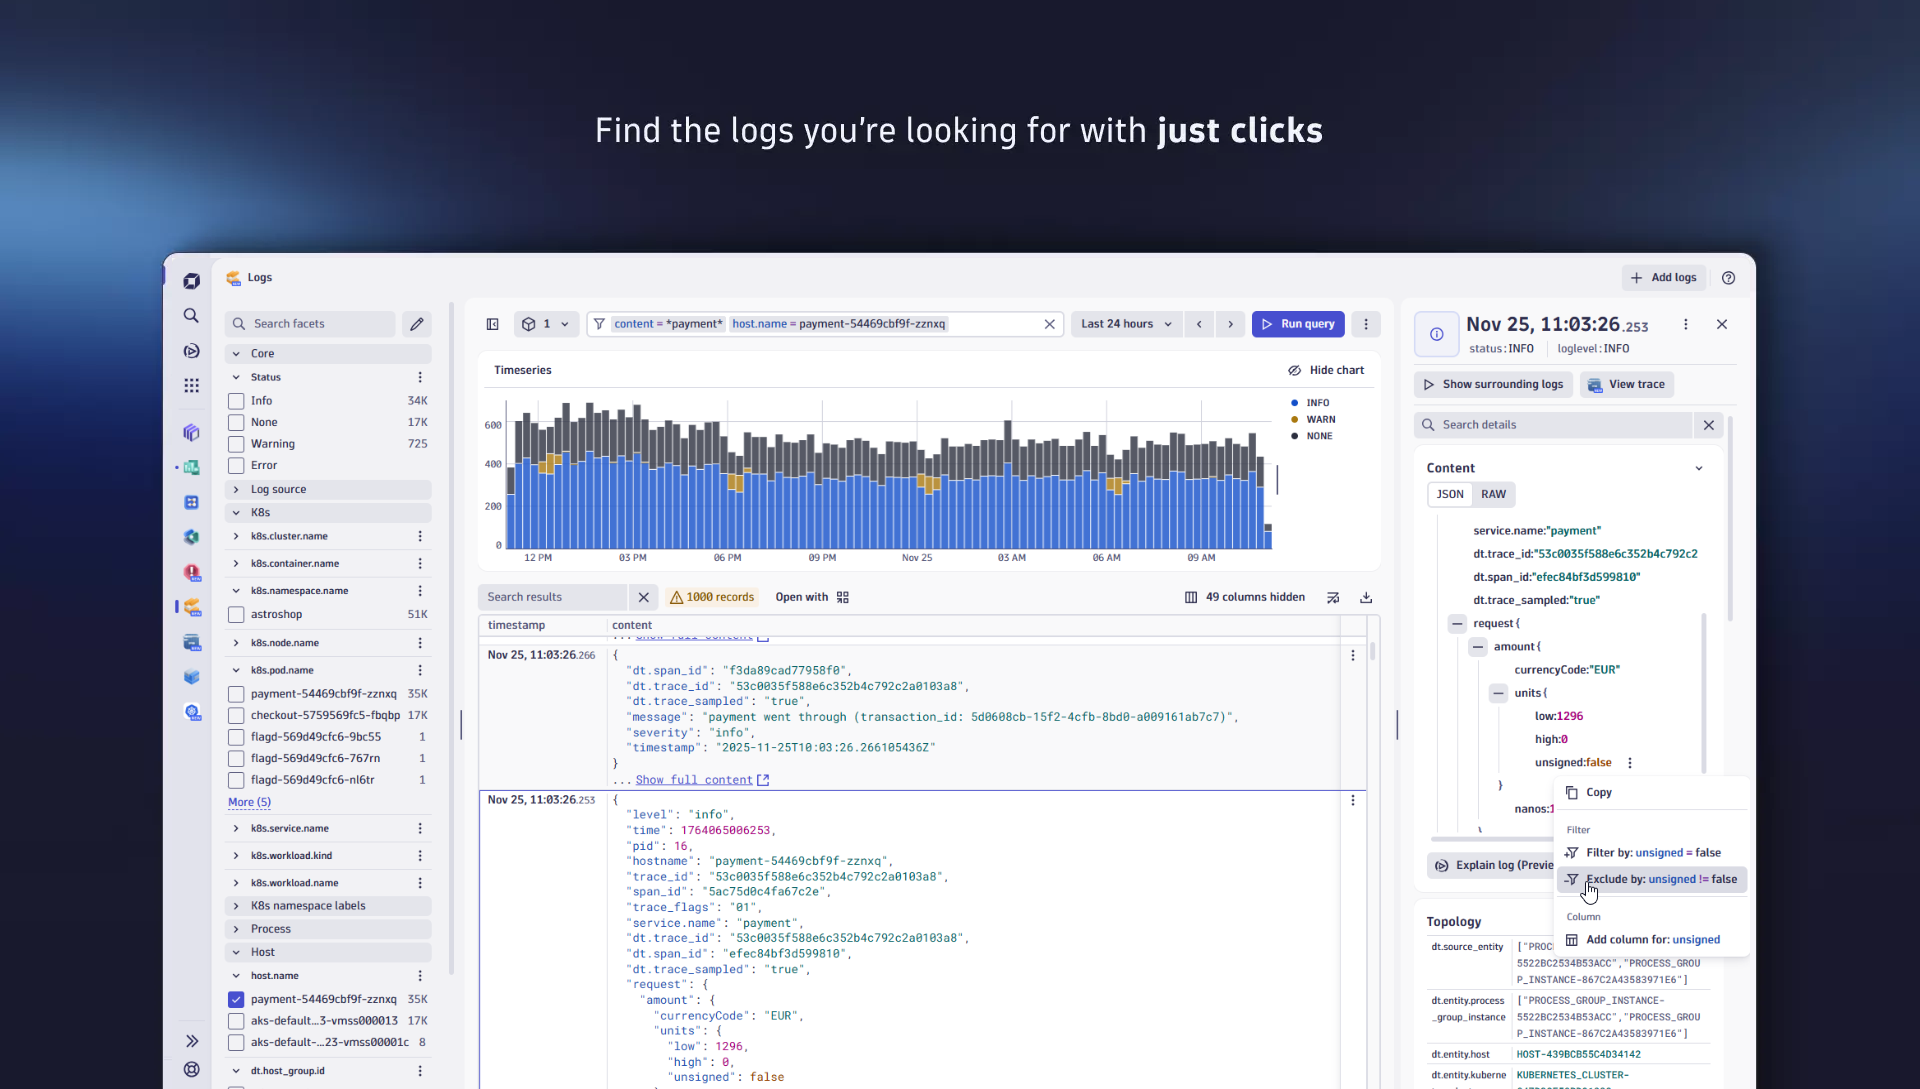
01Query and filter logs
- How-to guide
- Explore logs with DQL queries and filter statements in the Dynatrace Logs app.
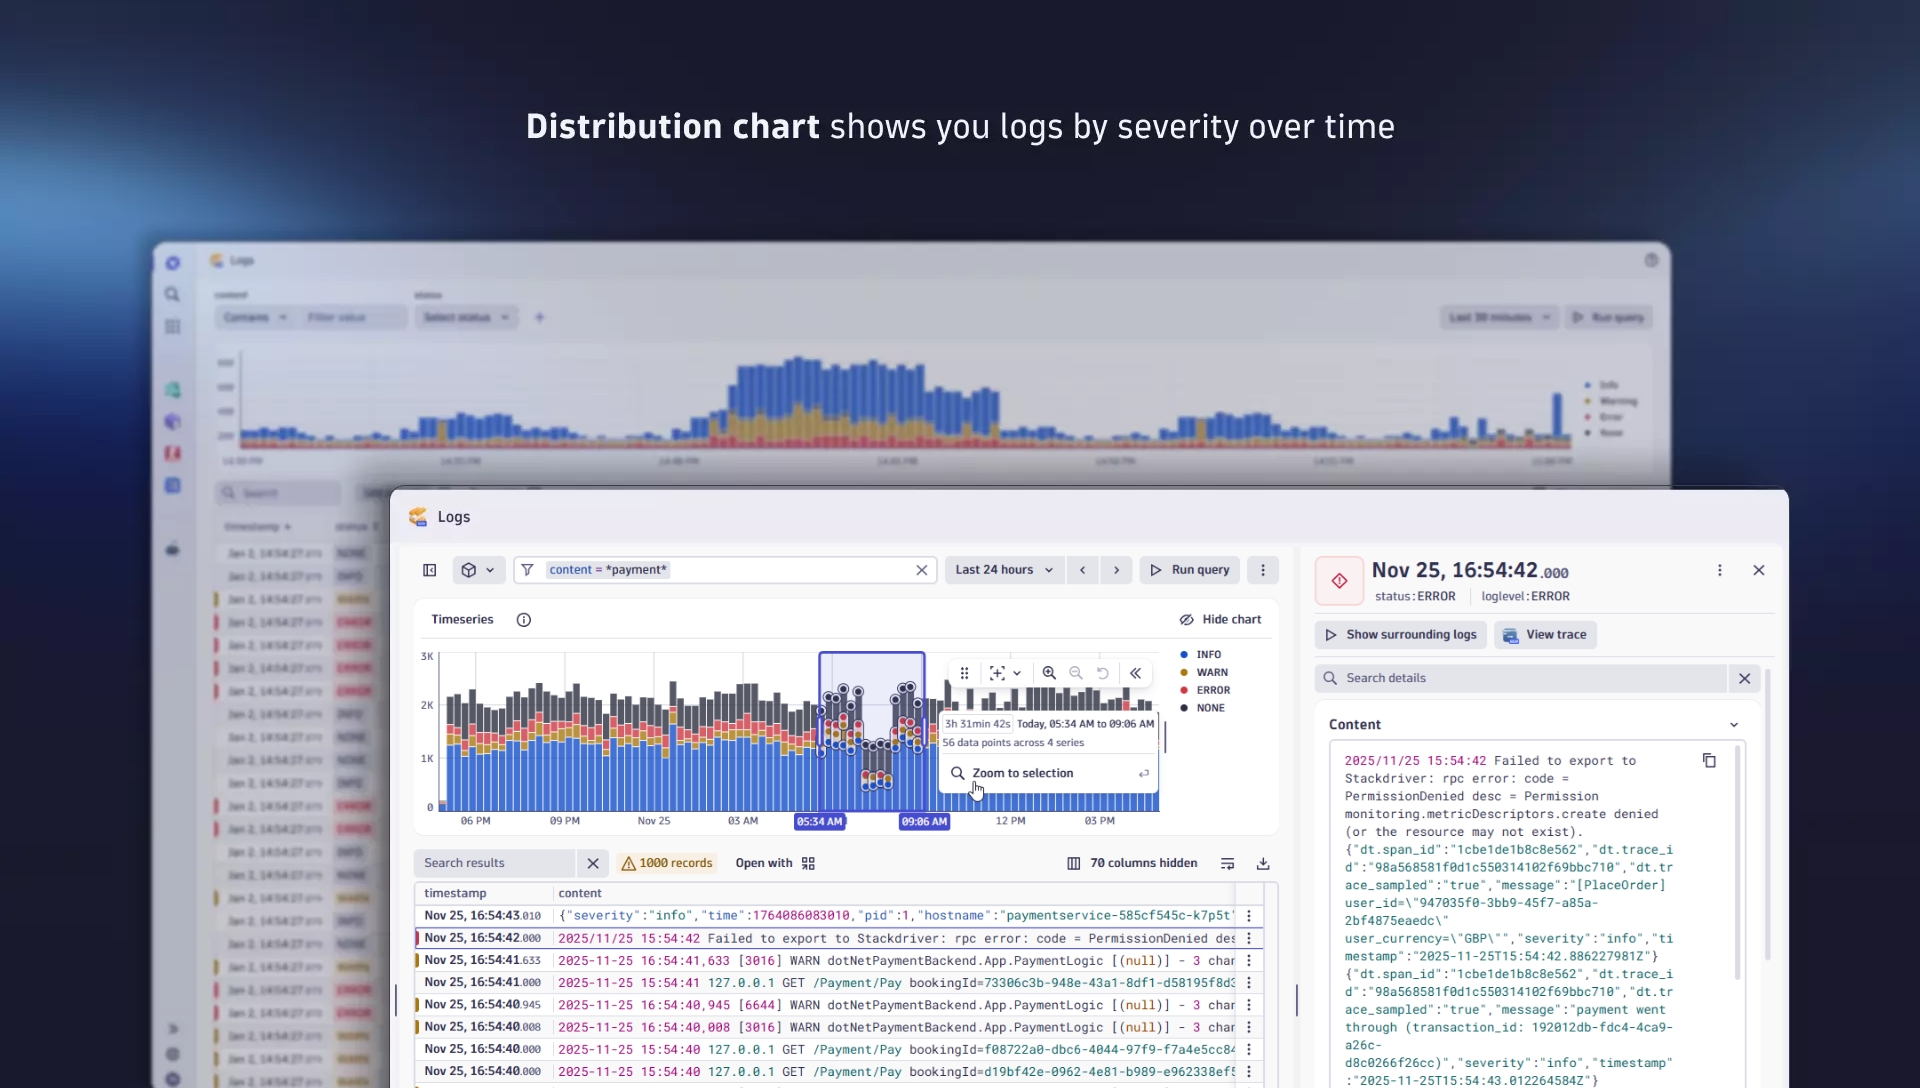
02Spot trends with the log distribution chart
- How-to guide
- Get a visual overview of log entries grouped by status to spot trends, identify anomalies, and perform targeted queries without leaving the visualization.
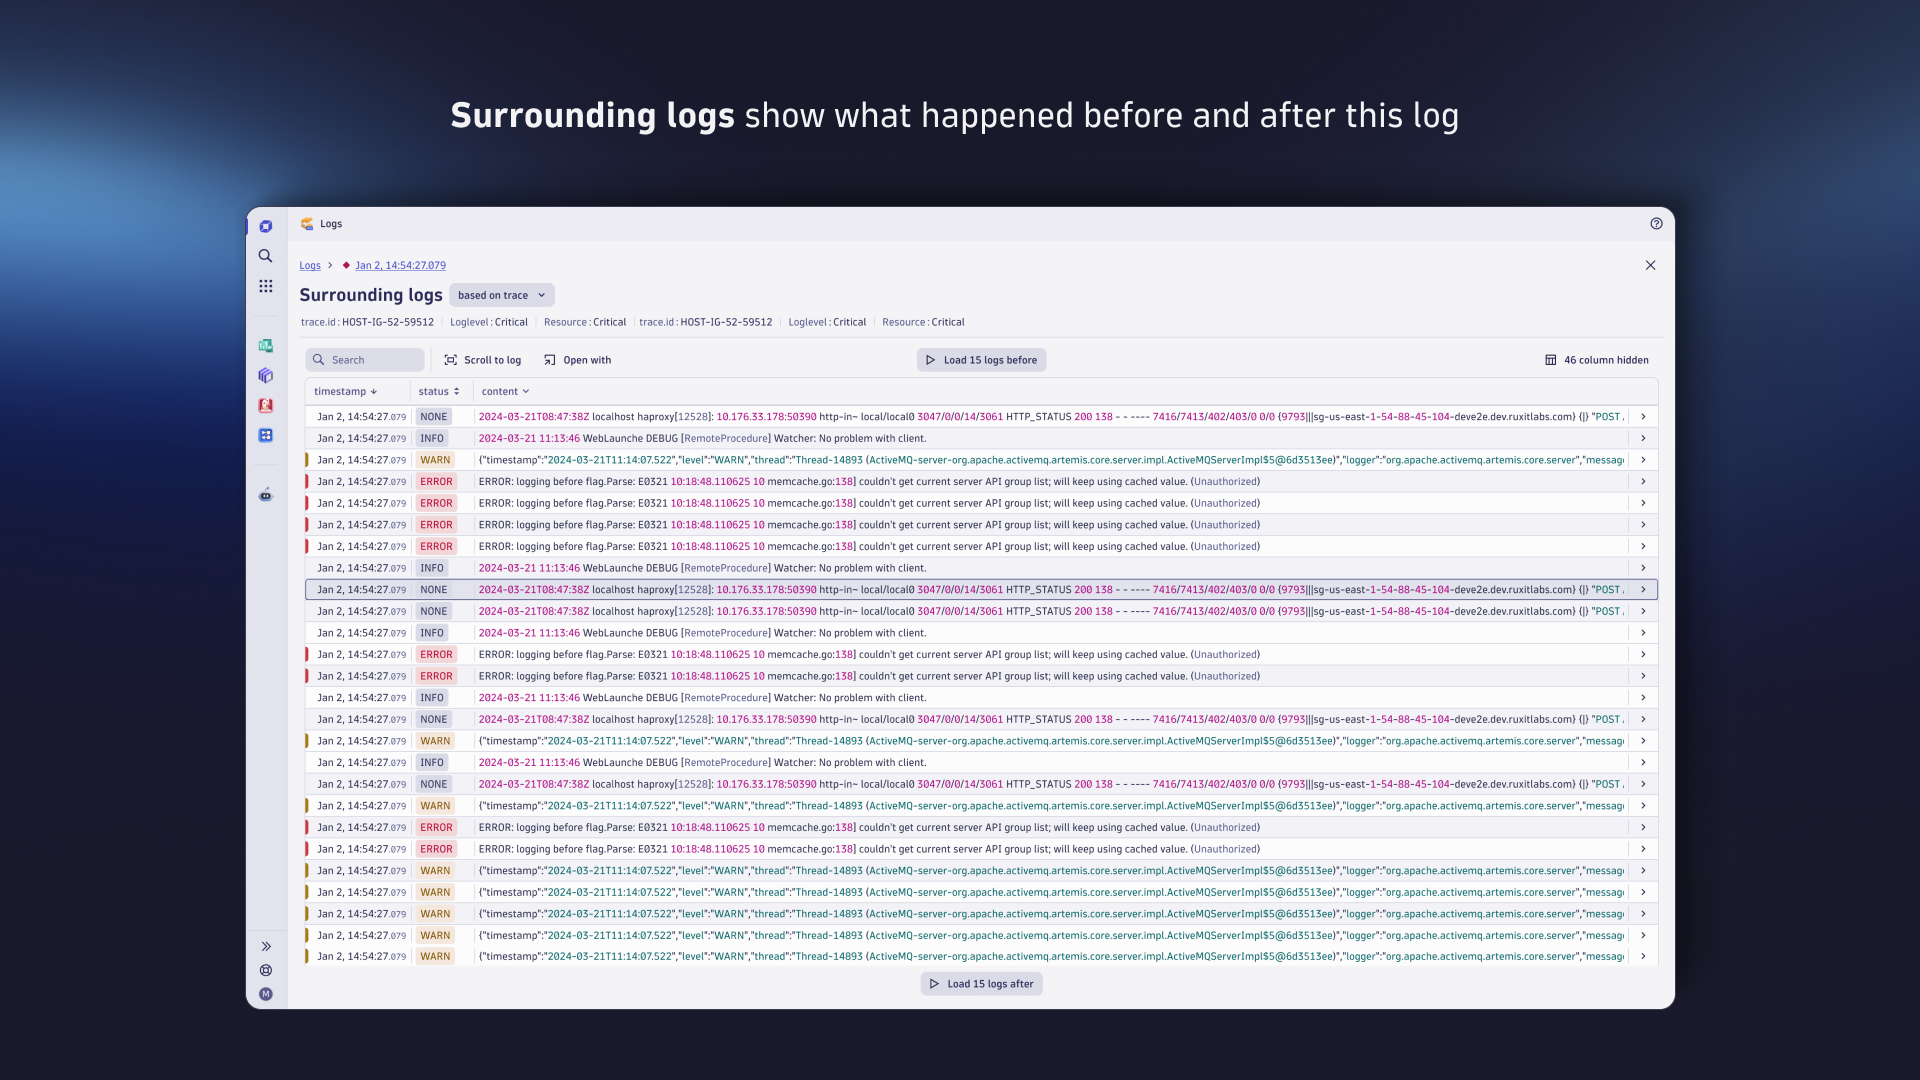
03View surrounding logs
- How-to guide
- Use surrounding logs to understand log data in context in the Dynatrace Logs app.
04Problem investigation mode
- Explanation
- Learn how the Logs app preserves the problem context in Problem investigation mode, how timeframe is inherited, and how to exit when your investigation is complete.
05Filter with facets
- How-to guide
- Filter logs with facets, primary tags, and cloud or Kubernetes tags in the Dynatrace Logs app.
06Adjust the log message
- How-to guide
- Adjust the log message in the Dynatrace Logs app.
07Analyze log patterns
- How-to guide
- Automatically detect log patterns in the Dynatrace Logs app to discover errors, explore log structure, and find outliers without writing DQL.
08Limits in Logs
- Reference
- Learn about the limits that apply to the Logs app and how to modify these limits.


Related tags LogsLog Analytics