Log processing with OpenPipeline
- Latest Dynatrace
- Explanation
- 4-min read
OpenPipeline is the Dynatrace solution for processing data from various sources. It enables effortless data handling at any scale and format on the Dynatrace platform. Using OpenPipeline when processing logs in Dynatrace offers a powerful solution to manage, process, and analyze logs. This approach combines the traditional log processing capabilities with the advanced data handling features of OpenPipeline to get deeper insights into your log data.
We recommend utilizing log processing with OpenPipeline as a scalable, powerful solution to manage, process, and analyze logs. If you don't have access to OpenPipeline, use the classic log processing pipeline.
OpenPipeline advantages
OpenPipeline provides the following advantages:
- Contextual data transformation: OpenPipeline extracts data with context and transforms it into more efficient formats, for example, converting logs to business events.
- Unified processing language: Dynatrace Query Language (DQL) is used as a processing language, offering one syntax for all Dynatrace features and more advanced options for processing.
- Pipeline concepts: You can split log ingest traffic into different pipelines with dedicated processing, data and metric extraction, permissions, and storage.
- Additional processors: You can use additional processors, for example, to add or remove fields. For the complete list, see Processing in OpenPipeline.
- Enhanced data extraction: Extract business events from logs with more data extraction options.
- Increased limits: Benefit from increased default limits.
- Improved performance and higher throughput.
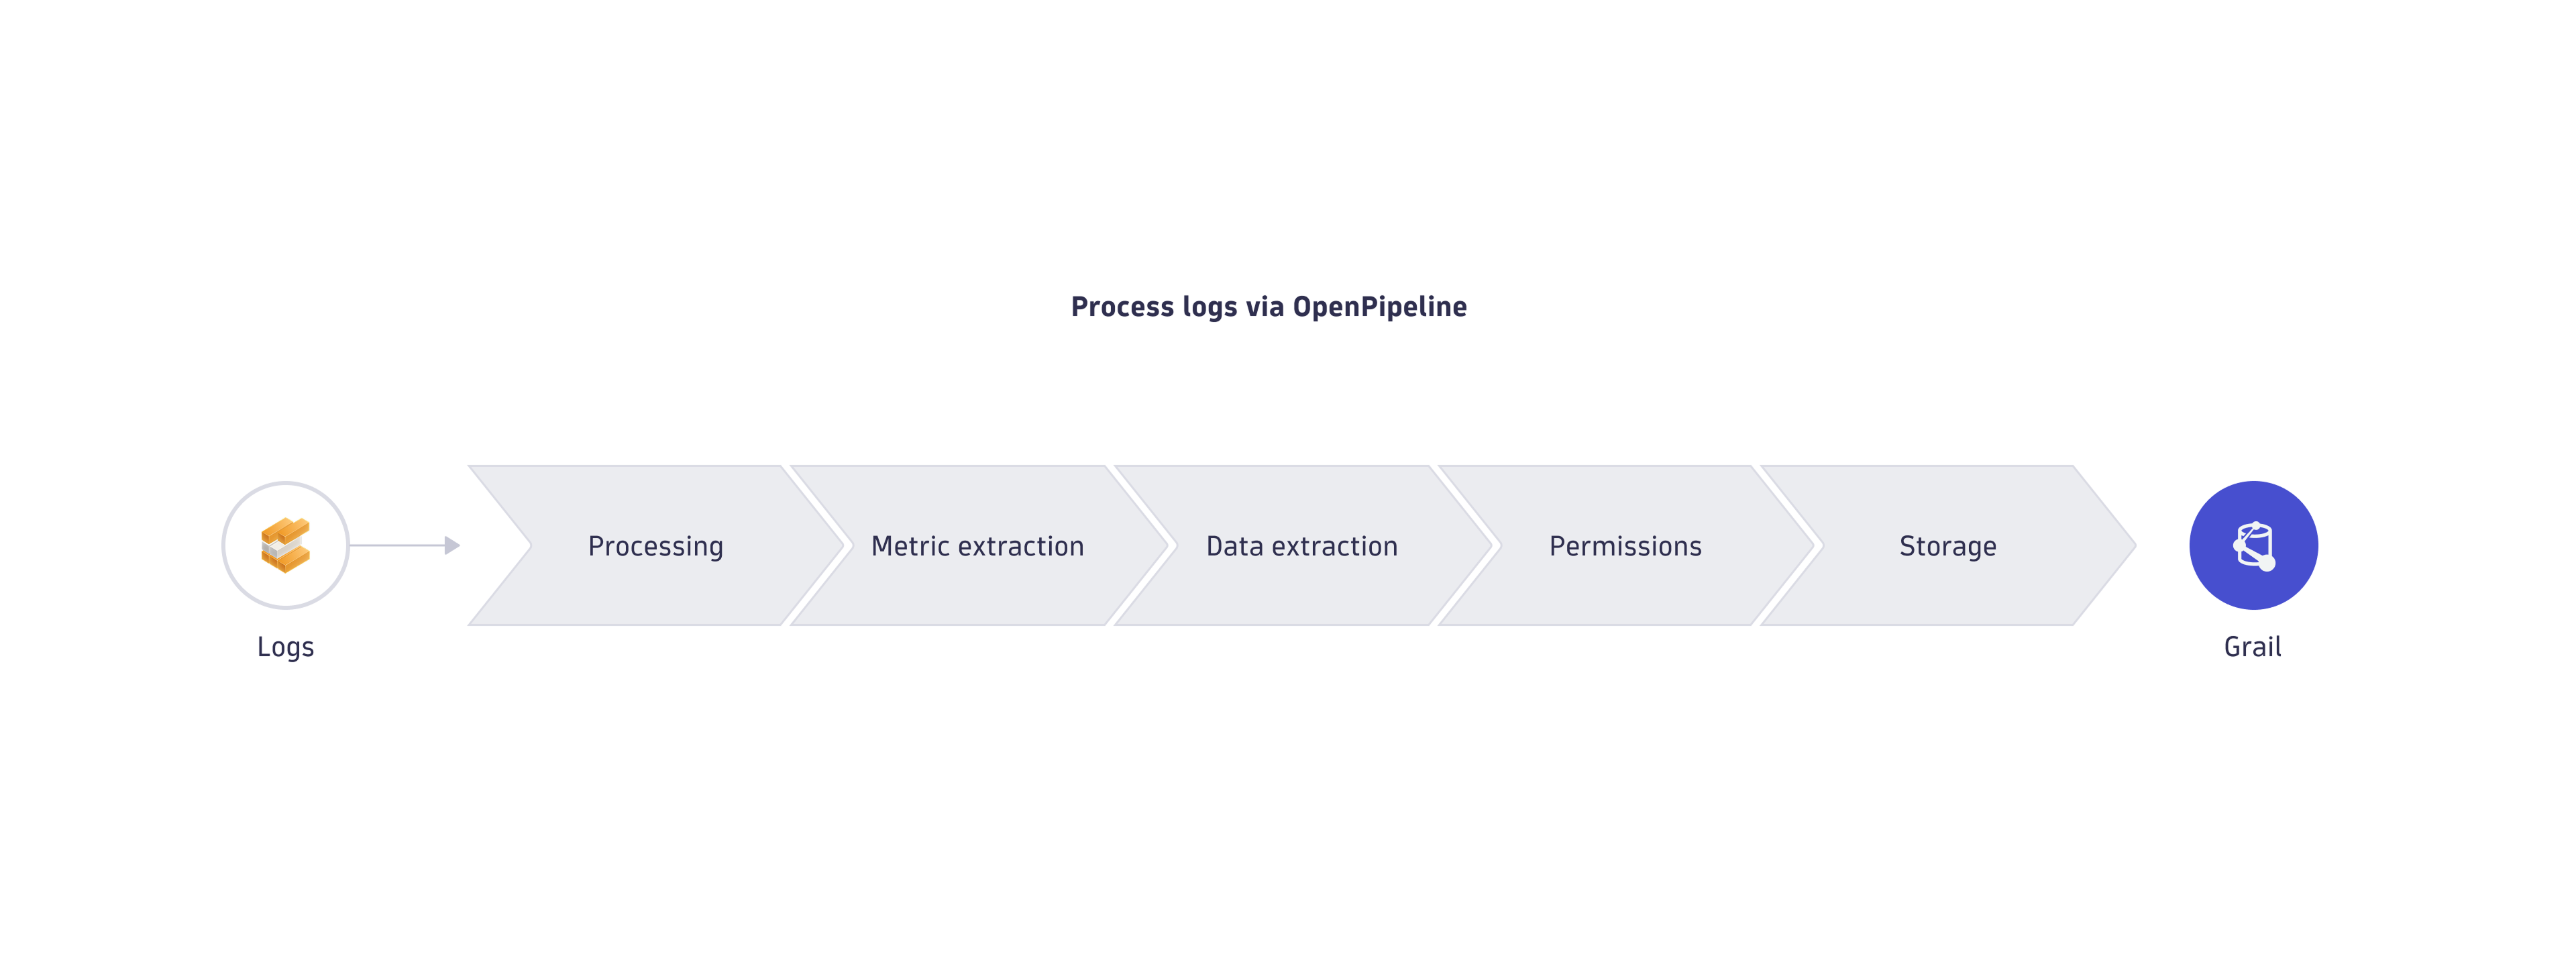
Stages of log processing
The stages of log processing with OpenPipeline are described below.
Specific fields are excluded from matching and processing or restricted. To learn more, see Limits specific to fields.
| Stage | Description | Processors in the stage | Executed processors | Supported data types |
|---|---|---|---|---|
Processing | Prepare data for analysis and storage by parsing values into fields, transforming the schema, and filtering the data records. Fields are edited, and sensitive data is masked. |
| All matches | Logs, Events—Generic, Events—Davis events, Events—Davis, Events—SDLC events, Security events (new) 1, Business events, Spans1 , Metrics, User events, User sessions |
Metric extraction | Extract metrics from the records that match the query. |
| All matches | Logs, Events—Generic, Events—SDLC events, Security events (new)1, Business events, System events, User events, User sessions |
Smartscape Node Extraction | Extract Smartscape nodes for the records that match the query. |
| All matches | Logs, Events—Generic, Events—SDLC events, Security events (new)1, Business events, System events, Spans1, User events, User sessions, Metrics |
Smartscape Edge Extraction | Extract Smartscape edges for the records that match the query. |
| All matches | Logs, Events—Generic, Events—SDLC events, Security events (new)1, Business events, System events, Spans1, User events, User sessions, Metrics |
Metric extraction | Extract metrics from the records that match the query. |
| All matches | Spans |
Data extraction | Extract a new record from a pipeline and re-ingest it as a different data type into another pipeline. |
| All matches | Logs, Events—Generic, Events—SDLC events, Security events (new)1, Business events, System events, Spans1, User events, User sessions |
Davis | Extract a new record from a pipeline and re-ingest it as a Davis events into another pipeline. |
| All matches | Logs, Events—Generic, Events—SDLC events, Security events (new)1, Business events, System events, Spans1 |
Cost allocation | Advanced option to assign cost center usage to specific records that match a query. Make sure to review Cost Allocation documentation when choosing the best approach for your environment. |
| First match only | Logs, Spans1 |
Product allocation | Advanced option to assign product or application usage to specific records that match a query. Make sure to review Cost Allocation documentation when choosing the best approach for your environment. |
| First match only | Logs, Spans1 |
Permissions | Apply security context to the records that match the query. |
| First match only | Logs, Events—Generic, Events—Davis events, Events—Davis, Events—SDLC events, Security events (new)1, Business events, Spans1, Metrics, User events, User sessions |
Storage | Assign records to the best-fit bucket. |
| First match only | Logs, Events—Generic, Events—Davis events, Events—Davis, Events—SDLC events, Security events (new)1, Business events, Spans1 |
The data remains in its original, structured form. This is important for detailed analysis and troubleshooting, as it ensures that no information is lost or altered.
Extracted metrics are sent to Grail only, except for the security events (new) and span configuration scopes.
Ingested logs are routed by the default route to built-in pipelines to ensure Grail storage. For log processing with OpenPipeline, the built-in pipeline is the default pipeline that ensures Grail storage. Create custom routes and pipelines to customize processing and storage in OpenPipeline. Processing is based on available records and doesn't take into account record enrichment from external services.
If you have created custom pipelines and your logs are routed to them by the dynamic route definition, these logs are not processed by the default pipeline. If logs aren't routed to custom pipelines, they are processed by the default pipeline.
Enable technology bundles
OpenPipeline provides technology bundles for common technologies and log formats. You can manually enable the required technology bundles.
To enable technology bundles in OpenPipeline
-
Go to
 Settings > Process and contextualize > OpenPipeline > Logs.
 -
Go to the Pipelines tab, and select
 Pipeline to add a new pipeline.
If you see Classic pipeline in the Pipelines tab, it means that you still use the classic log processing pipeline. We recommend migrating all your log processing rules (that is, classic pipeline) to log processing with OpenPipeline by creating the required pipelines as described on this page.
-
Enter a name for your new pipeline.
-
Select
Processor in the Processing tab, and choose Technology bundle. -
Choose the required technology, and then select Choose.
-
Select Run sample data to test the configuration, and view the result.
-
Select Save.
To process logs, you need to enable dynamic routing. For details, see Route data.
Add a custom pipeline
To create a custom pipeline in OpenPipeline
- Go to Settings > Process and contextualize > OpenPipeline > Logs.
- Go to the Pipelines tab, and select Pipeline to add a new pipeline.
- Enter a name for your new pipeline.
- Select one of the tabs representing stages of log processing: Processing, Metric Extraction, Data extraction, Permission, or Storage.
- Select Processor, and choose from the available processors.
- For each processor, specify the name and matching condition. Additional required fields vary based on the processor and are specified in the user interface.
- If available, select Run sample data to test the configuration, and view the result.
- Select Save.
You can review or edit any pipeline by selecting the record and making the necessary changes.
Use cases
Check the following use cases to learn how to leverage log processing with OpenPipeline.