Parse log lines and extract a metric
- Latest Dynatrace
- Tutorial
- 5-min read
This tutorial shows you how to parse important information from log lines into separate fields and extract a metric from it. Dedicated fields help with querying and extracting metrics, allowing you to show long-term data on a dashboard.
Who this is for
This article is intended for administrators controlling log ingestion configuration, data storage and enrichment, and transformation policies.
What you will learn
In this article, you will learn to narrow thousands of log lines to just the log lines of a user adding a product to their cart, transform the raw input into structured results with new dedicated fields (userId, productId, and quantity), and extract a metric measuring the quantity per product.
The following log line is an example of the raw data this article focuses on.
{"content": "AddItemAsync called with userId=6517055a-9fcc-4707-8786-e33a767a90c4, productId=OLJCESPC7Z, quantity=4","k8s.namespace.name": "online-boutique"}
Before you begin
Prior knowledge
Prerequisites
- Dynatrace SaaS environment powered by Grail and AppEngine
- License Dynatrace license with Log Analytics overview (DPS) capabilities
Steps

Find the relevant log lines in Grail

Configure a pipeline for parsing and metric extraction

Route data to the pipeline

Verify the configuration
 Find the relevant log lines in Grail
-
Go to Notebooks.
-
Use a DQL query to narrow down to the relevant log lines.
The following example query fetches the first 250 logs from
online-boutiquecontainingAddItemAsyncthat have a timestamp.fetch logs| filter k8s.namespace.name == "online-boutique"| filter matchesValue(content, "AddItemAsync*")| fields timestamp, content| limit 250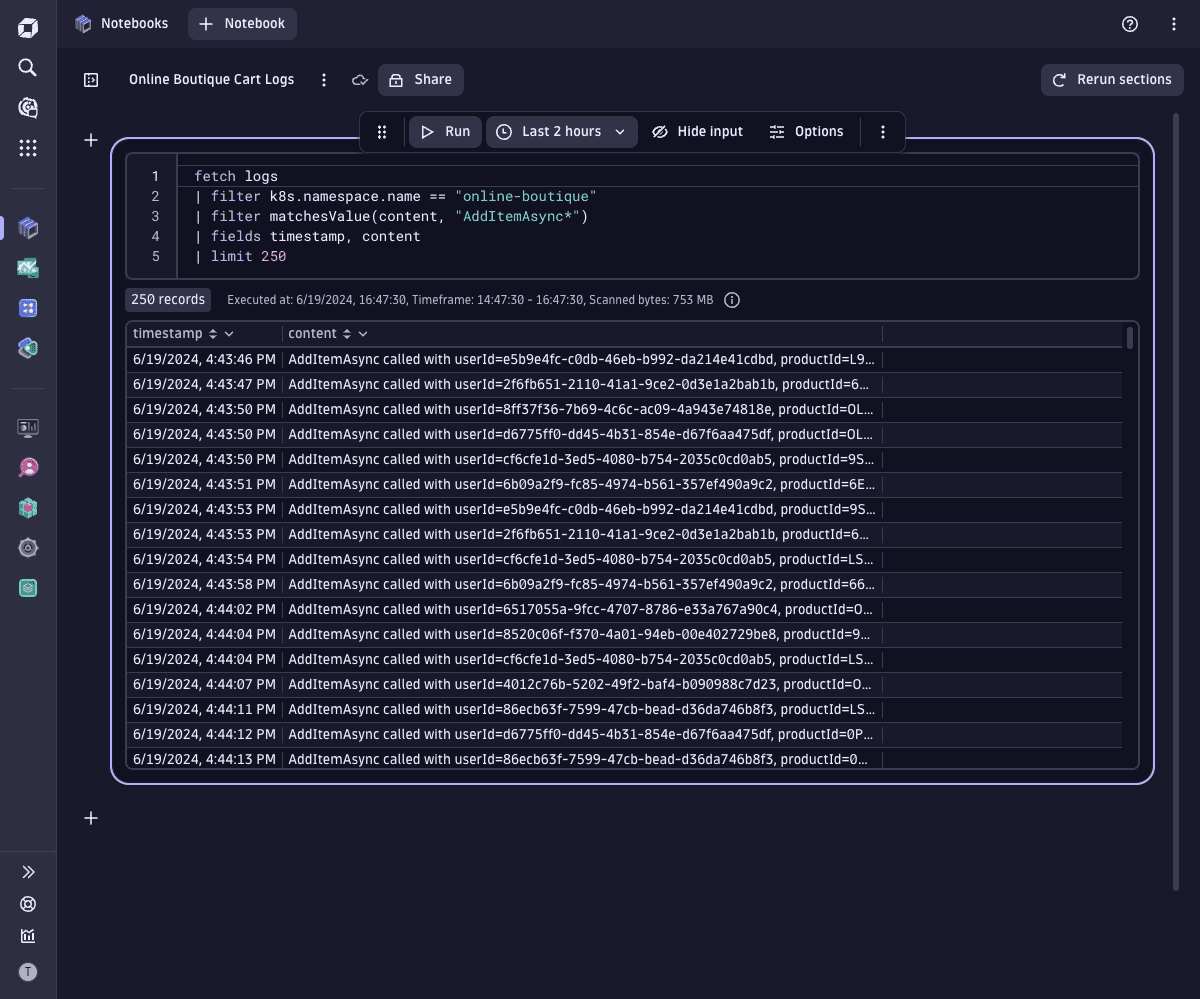 Find relevant logs lines via DQL query
 Create a pipeline for parsing and extraction
-
Go to
 Settings > Process and contextualize > OpenPipeline: > Logs > Pipelines.
 -
To create a new pipeline, select
Pipeline and enter a name (
Online Boutique). -
To configure parsing
-
Go to Processing >
Processor > DQL and define the processor by entering:
-
A descriptive name (
Parse product, user, and quantity). -
A matching condition.
In our example, the matching condition is
matchesValue(content, "AddItemAsync*") -
A processor definition. In our example, the processor definition
parse content, "\"AddItemAsync called with userId=\"LD:userId\", productId=\"LD:productId, \"quantity=\"INT:quantity"
-
-
Optional To verify the processor
-
Enter a data sample. In our example, the sample data is
{"content": "AddItemAsync called with userId=6517055a-9fcc-4707-8786-e33a767a90c4, productId=OLJCESPC7Z, quantity=4", "k8s.namespace.name": "online-boutique"} -
Select Run sample data.
-
Observe the preview result and, if necessary, modify the matching condition and/or the processor definition.
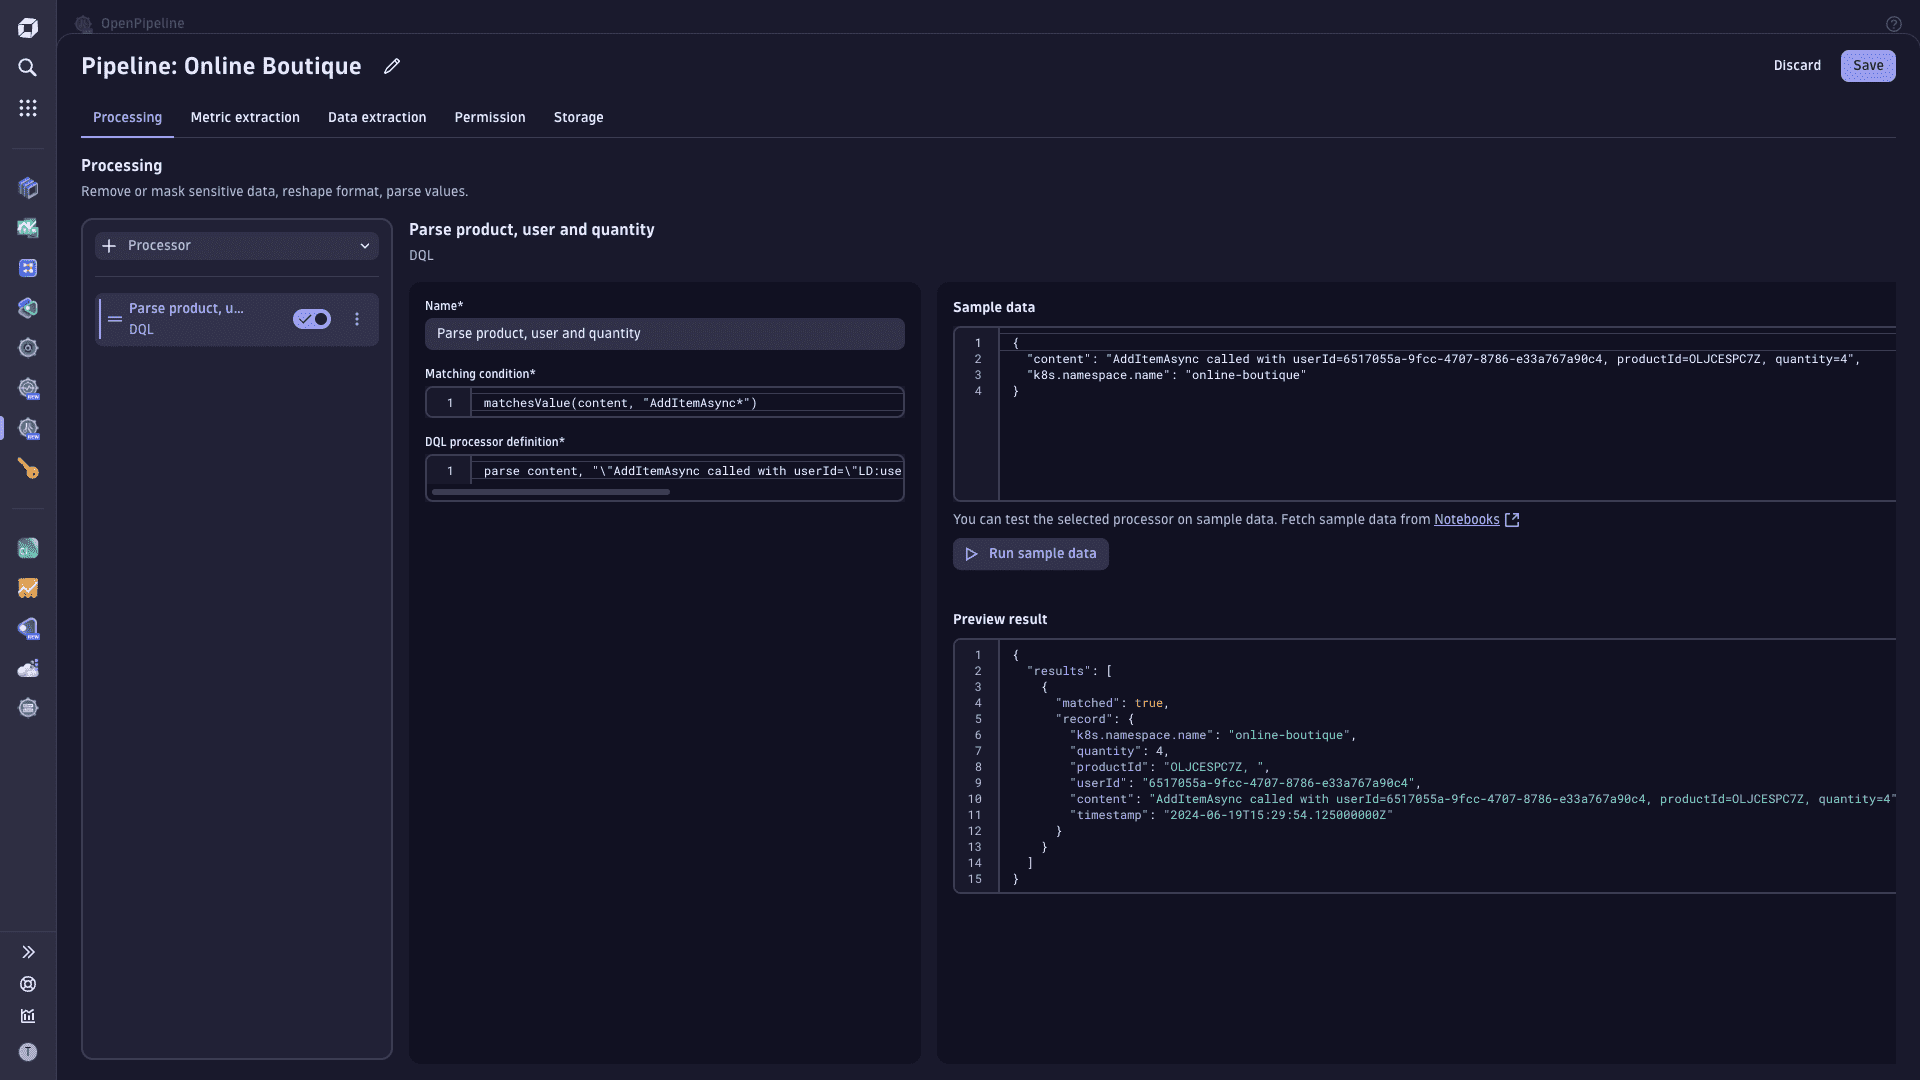 Parse log data into a structured format via OpenPiepeline
-
-
-
To configure metric extraction, go to Metric extraction >
Processor > Value metric and define the processor by entering:
- A descriptive name (
Extract quantity by product for AddItem). - The same matching condition you used for parsing.
- The field name from which to extract the value (
quantity). - A metric key for the field (
add_item_product_quantity_by_product). - A metric dimension
- Select Custom dimensions.
- Enter a metric dimension (
productId). - Select Add.
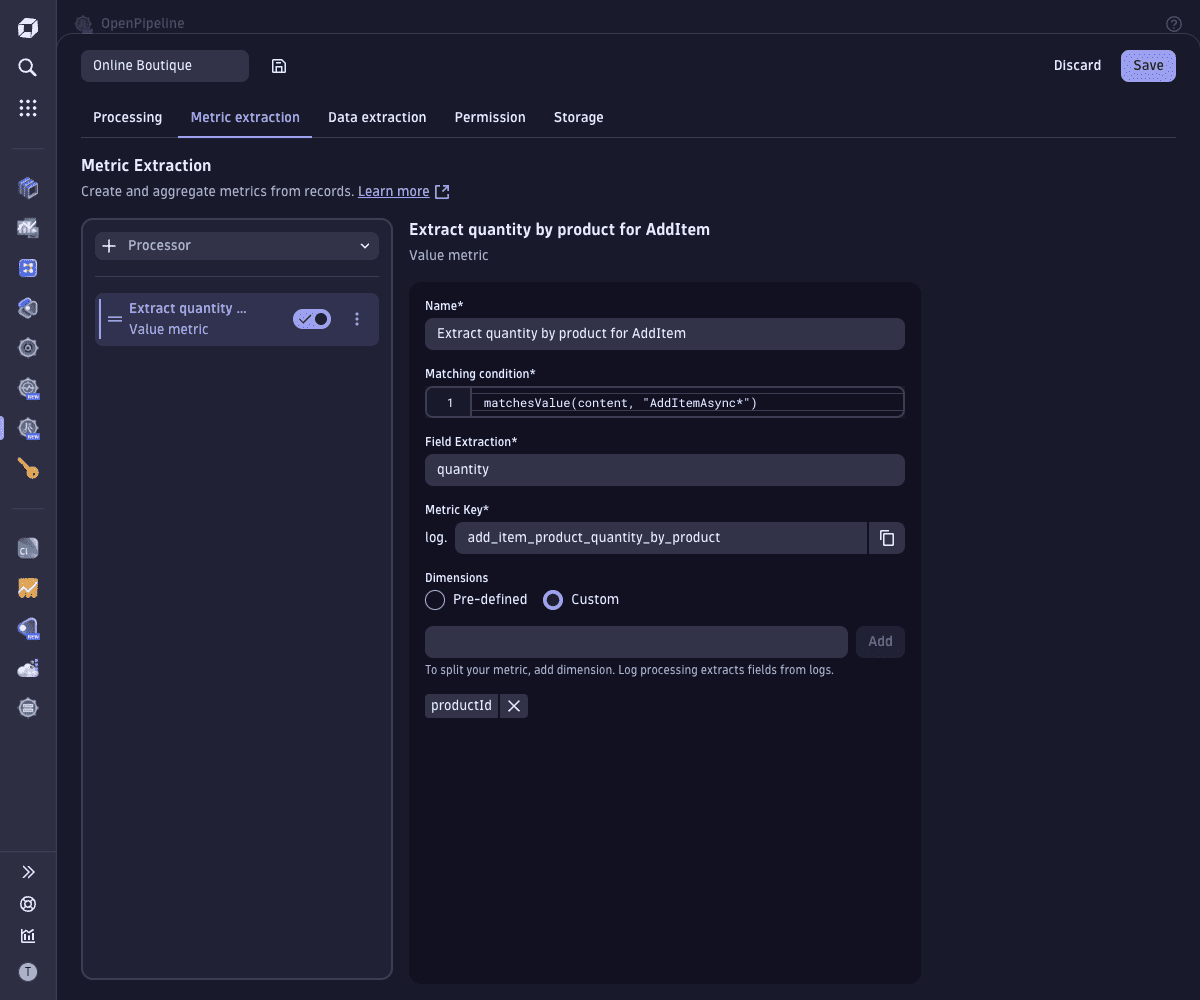 Extract a metric via OpenPipeline
 - A descriptive name (
-
Select Save.
You've successfully configured a new pipeline with two processors—one for parsing and one for metric extraction. The new pipeline is in the pipeline list.
 Route data to the pipeline
-
Go to
 Settings > Process and contextualize > OpenPipeline: > Logs > Dynamic routing.
 -
To create a new route, select
Dynamic route and specify:
-
A descriptive name (
Online Boutique). -
A matching condition.
In our example, the matching condition is
k8s.namespace.name == "online-boutique" -
The pipeline containing the processing instructions (
Online Boutique).
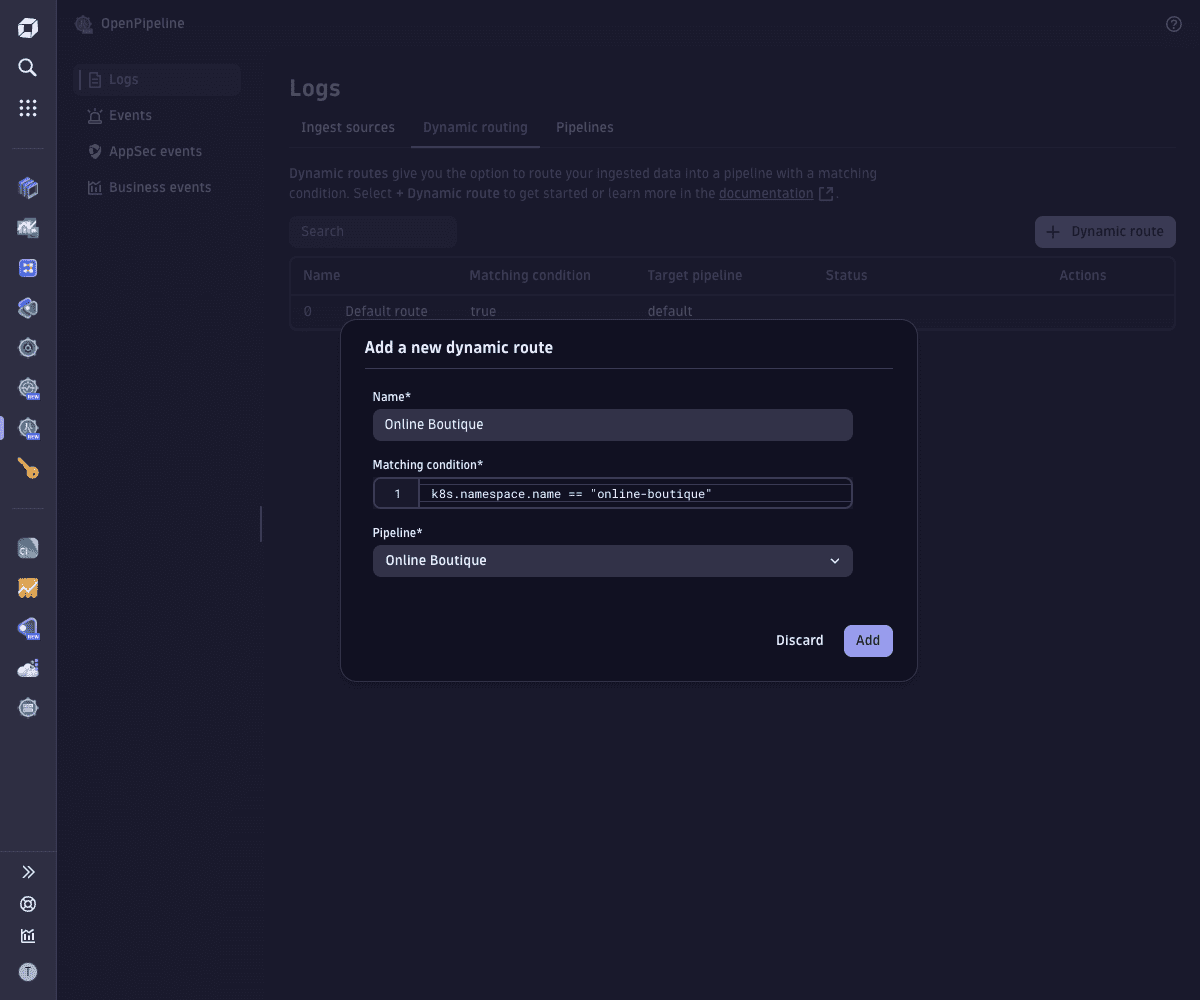 Configure a dynamic route for log processing in OpenPipeline
 -
-
Select Add.
You've successfully configured a new route. The new route is in the routes' list.
 Verify the configuration
-
Generate an access token.
- Go to Access Tokens > Generate new token and specify:
- A token name.
- The token scope—Ingest logs (
logs.ingest).
- Select Generate token.
- Select Copy and then paste the token to a secure location. It's a long string that you need to copy and paste back into Dynatrace later.
- Go to Access Tokens > Generate new token and specify:
-
Send a log record.
Run the following sample command to send a log record to your environment endpoint
/api/v2/logs/ingestviaPOSTrequest.The sample command indicates a JSON content type and provides the JSON event data using the
-dparameter. Make sure to substitute{your-environment-id}with your environment ID.<your-API-token>with the token you generated.
curl -i -X POST "https://{your-environment-id}.live.dynatrace.com/api/v2/logs/ingest" \-H "Content-Type: application/json" \-H "Authorization: Api-Token <your API token>" \-d "{\"k8s.namespace.name\":\"online-boutique\",\"content\":\"AddItemAsync called with userId=6517055a-9fcc-4707-8786-e33a767a90c4, productId=OLJCESPC7Z, quantity=4\"}"Your request is successful if the output contains the 204 response code.
-
Verify parsing by querying the log record and the metric in a notebook.
- Open an existing or new notebook in Notebooks.
- Select
> DQL and add two new sections with a DQL query input field.
-
To verify the log record, add a section with a DQL query input field.
In our example, the DQL query is
fetch logs| filter userId == "6517055a-9fcc-4707-8786-e33a767a90c4" -
To verify the metric, add another section with a DQL query input field.
In our example, the DQL query is
timeseries avg(log.add_item_product_quantity_by_product), by:{productId}| fieldsAdd sum = arraySum(`avg(log.add_item_product_quantity_by_product)`)| fields sum, productId
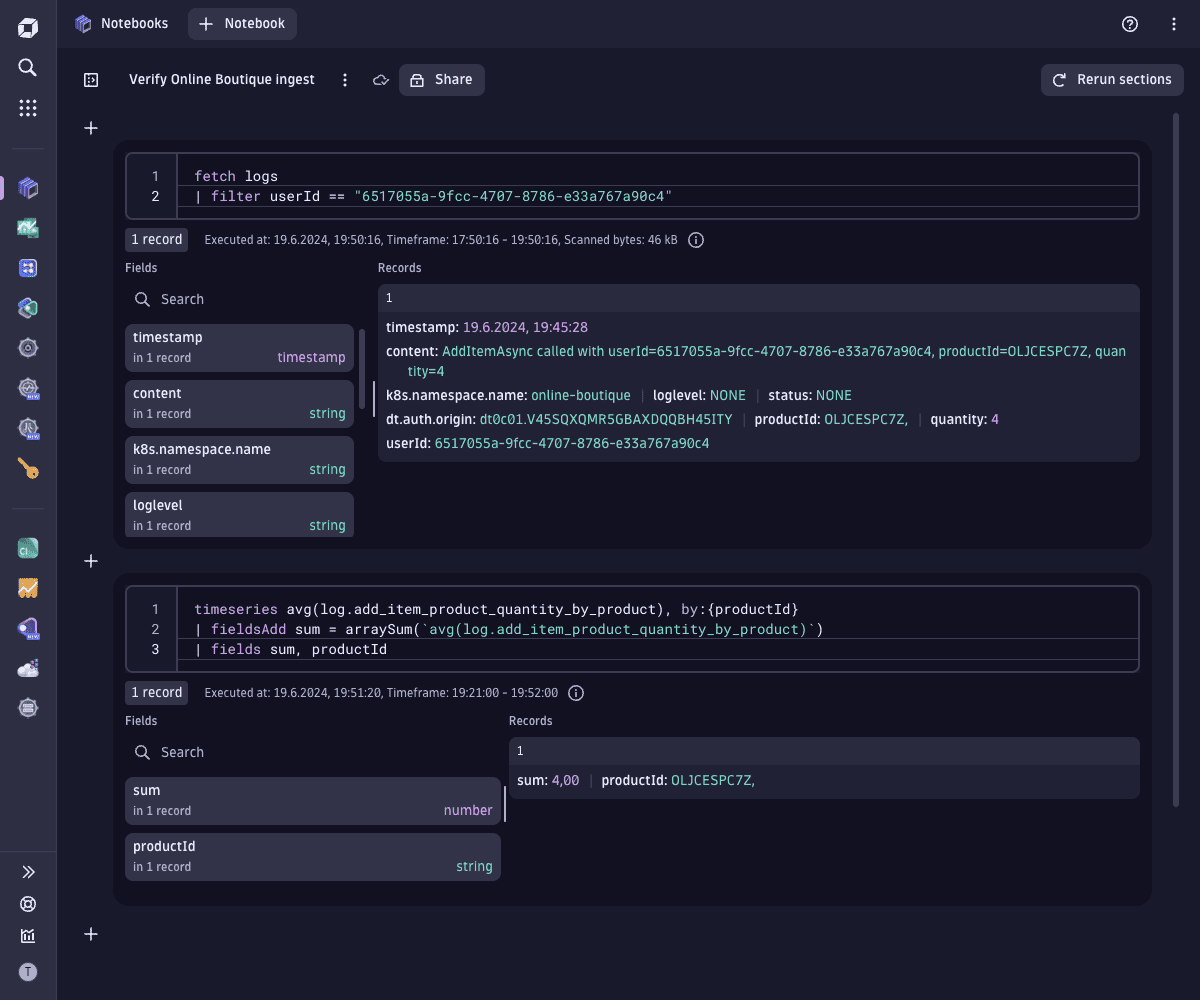 Verify OpenPipeline processing output
 -
Conclusion
You have successfully created a pipeline to parse log data and extract a metric. The log records of the user adding a product to their cart are transformed from raw information to structured information according to your rules. They now specify dedicated fields (userId, productId, and quantity), from which you extracted a new metric for better analytics.
Raw log record
{"content": "AddItemAsync called with userId=6517055a-9fcc-4707-8786-e33a767a90c4, productId=OLJCESPC7Z, quantity=4","k8s.namespace.name": "online-boutique"}
Structured log record
{"k8s.namespace.name": "online-boutique","quantity" : 4,"productId": "OLJCESPC7Z","userId": "6517055a-9fcc-4707-8786-e33a767a90c4","content": "AddItemAsync called with userId=6517055a-9fcc-4707-8786-e33a767a90c4, productId=OLJCESPC7Z, quantity=4","timestamp": "2024-06-19T15:29:54.125000000Z"}
 OpenPipeline