Monitor log source health with SFM events
- Latest Dynatrace
- How-to guide
- 14-min read
OneAgent version 1.333+
The Log module features a built-in self-monitoring and troubleshooting functionality. The functionality is called Log module self-monitoring events (SFM events).
The Log module provides the list of monitored log sources along with their statuses and metadata. The log source status shows whether a log source is detected correctly and is configured to be ingested, as well as informs about the source type (for example, whether a log source was detected automatically or provided by a user).
The functionality also warns about suspicious issues and malfunctions. In case such an issue appears, the context (for example, the log source name or host ID) is provided along with the information on where to find more help and how to examine and solve the issue. Each type of a malfunction is communicated using a specific SFM event type.
Availability and state
-
The functionality is generally available and turned on by default in OneAgent version 1.339+ and SaaS version 1.340+.
-
The additional performance footprint of the functionality is negligible.
Prerequisites
- The Log module is deployed with either OneAgent or Dynatrace Operator.
Configure SFM events via API
SFM events are enabled by default. To customize this functionality, update your configuration via the Settings API. Use the builtin:logmonitoring.log-sfm-settings schema ID. If you're familiar with configuring log ingest rules, the same workflow applies here.
Prerequisites for SFM event configuration
- An access token with
settings.writeandsettings.readpermissions. - An API client of your choice (the examples below use cURL).
Configuration scopes
You can configure SFM event rules for the following scopes:
tenant: The configuration object affects all hosts in a given environment.host_group: The configuration object affects all hosts assigned to a given host group.kubernetes_cluster: The configuration object only affects the given Kubernetes cluster.host: The configuration object only affects the given host.
We recommend configuring the SFM event rules at the highest appropriate scope for easier management. Use fewer, broader rules instead of many small, overlapping rules.
Exclude a particular SFM event type
If you've enabled all SFM events but need to exclude a particular SFM event type, create an additional exclusion SFM event rule.
This exclusion rule must have a higher priority than the rule that enables all SFM events. To add the exclusion rule at the top of the rule list, set insertAfter to an empty value in the payload. If you don't include the insertAfter parameter, the rule is placed at the bottom of the rule list and can be overridden by all other rules within the given configuration scope. See the POST an object parameters for more information.
Follow the instructions in Enable SFM events, but use the following example payload.
[{"schemaId": "builtin:logmonitoring.log-sfm-settings","scope": "tenant","insertAfter": "","value": {"enabled": true,"config-item-title": "Suppress warning about the absence of timestamp pattern","send-to-storage": false,"matchers": [{ "attribute": "event.type", "operator": "MATCHES", "values": ["timestamp.no_pattern"]}]}}]
By creating this additional rule, you exclude the timestamp.no_pattern SFM event type on the tenant configuration scope.
There can be situations when you don't want to suppress an SFM event type everywhere, but you only want to suppress it for one log source you already know about, while still being notified if the same event occurs elsewhere.
For example, suppose one of your log sources, a.log, has no timestamp in its content. You're aware of that and don't want to be notified about it. However, you still want to be notified about the timestamp.no.pattern event for any other log source.
To do this, create an exclusion rule similar to the one above, but add a second matcher for log.source:
[{"schemaId": "builtin:logmonitoring.log-sfm-settings","scope": "tenant","insertAfter": "","value": {"enabled": true,"config-item-title": "Suppress 'no timestamp pattern' warning only for a.log","send-to-storage": false,"matchers": [{ "attribute": "event.type", "operator": "MATCHES", "values": ["timestamp.no_pattern"] },{ "attribute": "log.source", "operator": "MATCHES", "values": ["*a.log"] }]}}]
Both matchers must match for the rule to apply, so the event is suppressed only when its type is timestamp.no.pattern and its log source is a.log. The event is still raised for every other log source.
Keep the suppression scope as narrow as needed. A good exclusion rule must match the exact situation which you've already investigated and accepted. If you find yourself adding very broad matchers (for example, suppressing an entire event type across an entire host), confirm that you aren't also hiding events that point to a real issue elsewhere.
Delete all types of SFM events
To delete all SFM event types, use the DELETE an object endpoint. This operation doesn't require a JSON payload.
curl -X DELETE \"<environment_url>/api/v2/settings/objects/<objectId>" \-H "Authorization: Api-Token <token>"
To get the required object ID, use the GET objects endpoint.
Create or update SFM event rules
SFM events are enabled by default. If you've deleted your SFM event rules and want to re-enable them, follow these steps.
To create or update SFM event rules:
-
Use the GET a schema endpoint to learn the JSON format required to post your SFM event configuration.
curl -X GET \"<environment_url>/api/v2/settings/schemas/builtin:logmonitoring.log-sfm-settings" \-H "Authorization: Api-Token <token>"You can also use the GET objects endpoint to get all SFM event rules available on the specified scope.
curl -X GET \"<environment_url>/api/v2/settings/objects?schemaIds=builtin:logmonitoring.log-sfm-settings&scopes=<tenant/entityId>" \-H "Authorization: Api-Token <token>" -
Build a
payload.jsonfile using the acquired schema as a reference.
If you want all types of SFM events enabled, you can use the example payload below.[{"schemaId": "builtin:logmonitoring.log-sfm-settings","scope": "tenant","value": {"enabled": true,"config-item-title": "Enable all SFMs","send-to-storage": true,"matchers": []}}] -
Optional To validate the created
payload.jsonpayload, use the POST an object endpoint and setvalidateOnlytotrue.curl -X POST \"<environment_url>/api/v2/settings/objects?validateOnly=true" \-H "Authorization: Api-Token <token>" \-H "Content-Type: application/json" \--data @payload.json -
Create an SFM event rule using the POST an object endpoint.
curl -X POST \"<environment_url>/api/v2/settings/objects" \-H "Authorization: Api-Token <token>" \-H "Content-Type: application/json" \--data @payload.json -
Verify that the rule has been created using the GET objects endpoint.
curl -X GET \"<environment_url>/api/v2/settings/objects?schemaIds=builtin:logmonitoring.log-sfm-settings&scopes=<scope>" \-H "Authorization: Api-Token <token>"
Explore the self-monitoring dashboard
The Log module self-monitoring dashboard provides an end-to-end view of the Log module health in Dynatrace. It focuses on log ingestion quality, active self-monitoring events, and log source coverage across hosts and Kubernetes environments. You can use it to quickly detect gaps in log collection, troubleshoot parsing and timestamp issues, and verify that all required log sources are monitored.
At the top of the dashboard, the global filters help you narrow the view to specific environments or entities. Each filter applies only to related tiles. For example, the file status and ingest status apply only to log source tiles.
The following global filters are available:
- Timeframe
- Event type
- Host
- Host group
- Process group
- Log source
- File status
- Ingest status
- Kubernetes cluster
- Namespace
- Pod
Import the dashboard
The built-in Log ingest overview dashboard will be upgraded with SFM events tiles in Dynatrace version 1.342+. Until then, import the dashboard JSON manually as described below.
To import the Log module self-monitoring dashboard into your Dynatrace environment
-
Expand the Log module SFM dashboard JSON section below, copy the provided code, and create the
Log module self-monitoring.jsonfile with the provided dashboard JSON definition below:Log module SFM dashboard JSON
{"version": 21,"variables": [{"version": 2,"key": "EventType","type": "query","visible": true,"editable": true,"input": "fetch dt.system.events, from: now() - 24h\n| filter event.provider == \"Log Module\"\n| fields event.type\n| dedup event.type\n| summarize entries = array(\"*\", collectArray(event.type))\n| expand entries\n","multiple": false,"defaultValue": "*"},{"version": 2,"key": "Host","type": "query","visible": true,"editable": true,"input": "fetch dt.entity.host, from: now() - 24h\n| fields entity.name\n| sort entity.name asc\n| limit 999\n// if no clusters, add * placeholder to avoid errors\n| summarize entries = array(\"*\", collectArray(entity.name))\n| dedup entries\n| expand entries","multiple": false,"defaultValue": "*"},{"version": 2,"key": "HostGroup","type": "query","visible": true,"editable": true,"input": "fetch dt.entity.host_group, from: now() - 24h\n| fields entity.name\n| limit 999\n// if no clusters, add * placeholder to avoid errors\n| summarize entries = array(\"*\", collectArray(entity.name))\n| dedup entries","multiple": false,"defaultValue": "*"},{"version": 2,"key": "ProcessGroup","type": "query","visible": true,"editable": true,"input": "fetch dt.entity.process_group, from: now() - 24h\n| fields entity.name\n| limit 999\n// if no clusters, add * placeholder to avoid errors\n| summarize entries = array(\"*\", collectArray(entity.name))\n| dedup entries","multiple": false,"defaultValue": "*"},{"version": 2,"key": "LogSource","type": "query","visible": true,"editable": true,"input": "fetch dt.system.events, from: now() - 24h\n| filter event.provider == \"Log Module\" and isNotNull(log.source)\n| limit 999\n| dedup log.source\n| summarize entries = array(\"*\", collectArray(log.source))\n| expand entries","multiple": false,"defaultValue": "*"},{"version": 2,"key": "FileStatus","type": "query","visible": true,"editable": true,"input": "fetch dt.system.events, from: now() - 24h\n| filter event.provider == \"Log Module\" and isNotNull(log.source.file_status)\n| limit 999\n| dedup log.source.file_status\n| summarize entries = array(\"*\", collectArray(log.source.file_status))\n| expand entries","multiple": false,"defaultValue": "*"},{"version": 2,"key": "IngestStatus","type": "query","visible": true,"editable": true,"input": "fetch dt.system.events, from: now() - 24h\n| filter event.provider == \"Log Module\" and isNotNull(log.source.ingest_status)\n| limit 999\n| dedup log.source.ingest_status\n| summarize entries = array(\"*\", collectArray(log.source.ingest_status))\n| expand entries","multiple": false,"defaultValue": "*"},{"version": 2,"key": "K8sClusterName","type": "query","visible": true,"editable": true,"input": "fetch dt.system.events, from: now() - 24h\n| filter event.provider == \"Log Module\" and isNotNull(k8s.cluster.name)\n| limit 999\n| dedup k8s.cluster.name\n| summarize entries = array(\"*\", collectArray(k8s.cluster.name))\n| expand entries","multiple": false,"defaultValue": "*"},{"version": 2,"key": "K8sPodName","type": "query","visible": true,"editable": true,"input": "fetch dt.system.events, from: now() - 24h\n| filter event.provider == \"Log Module\" and isNotNull(k8s.pod.name)\n| limit 999\n| dedup k8s.pod.name\n| summarize entries = array(\"*\", collectArray(k8s.pod.name))\n| expand entries","multiple": false,"defaultValue": "*"},{"version": 2,"key": "K8sNamespaceName","type": "query","visible": true,"editable": true,"input": "fetch dt.system.events, from: now() - 24h\n| filter event.provider == \"Log Module\" and isNotNull(k8s.namespace.name)\n| limit 999\n| dedup k8s.namespace.name\n| summarize entries = array(\"*\", collectArray(k8s.namespace.name))\n| expand entries","multiple": false,"defaultValue": "*"}],"tiles": {"0": {"title": "Active issues - Kubernetes log modules","description": "\n","type": "data","query": "fetch dt.system.events, from: toTimestamp($dt_timeframe_from) - 24h, to: toTimestamp($dt_timeframe_to)\n| filter event.provider == \"Log Module\" and event.type != \"log_source.status\" \n| filter exists(k8s.node.name)\n| filter $EventType == \"*\" or in(event.type, $EventType)\n| filter $Host == \"*\" or in(host.name, $Host)\n| filter $HostGroup == \"*\" or in(dt.host_group.id, $HostGroup)\n| filter $ProcessGroup == \"*\" or in(dt.process_group.detected_name, $ProcessGroup)\n| filter $LogSource == \"*\" or in(log.source, $LogSource)\n| filter $K8sClusterName == \"*\" or in(k8s.cluster.name, $K8sClusterName)\n| filter $K8sPodName == \"*\" or in(k8s.pod.name, $K8sPodName)\n| filter $K8sNamespaceName == \"*\" or in(k8s.namespace.name, $K8sNamespaceName)\n| dedup event.id, sort: { timestamp desc }\n| filter event.status == \"Active\"\n| filter toTimestamp($dt_timeframe_to) - timestamp <= 24h\n| fieldsAdd logsQuery = concat(\n \"fetch logs, from:\\\"\", toString($dt_timeframe_from), \"\\\", to:\\\"\", toString($dt_timeframe_to), \"\\\"\\n\",\n \"| filter dt.smartscape_source.id == \\\"\", dt.smartscape_source.id, \"\\\"\\n\",\n if(isNotNull(log.source), concat(\"| filter log.source == \\\"\", escape(log.source),\"\\\"\\n\")),\n \"| sort timestamp asc\")\n| fieldsAdd logsJson = concat(\"{\\\"dt.query\\\":\\\"\", escape(logsQuery),\"\\\"}\")\n| fieldsAdd linkEncoded = replaceString(escape(encodeUrl(logsJson)), \"+\", \"%20\")\n| fieldsAdd `Source entity` = if(isNotNull(dt.entity.process_group_instance), dt.entity.process_group_instance, \n else: if(isNotNull(dt.entity.host), dt.entity.host,\n else: if(isNotNull(k8s.pod.name), k8s.pod.name)))\n| fields event.start, event.type, log.source, dt.entity.kubernetes_cluster, k8s.pod.name, linkEncoded\n| limit 1000\n\n// If you want to create a query yourself use this:\n// fetch dt.system.events\n// | filter event.provider == \"Log Module\" and event.type == \"Log Source status\"","visualization": "table","visualizationSettings": {"table": {"hiddenColumns": [["dt.kubernetes.node.system_uuid"],["dt.source_entity"],["gcp.region"],["gcp.project.id"],["k8s.cluster.name"],["dt.smartscape.container"],["process.technology"],["dt.smartscape.process"],["dt.process_group.detected_name"],["app"],["other"],["container.image.name"],["container.id"],["container.name"],["link"],["on-prem"],["dt.security_context"],["timestamp"],["dt.smartscape_source.type"],["loglevel"],["event.status"],["status"],["dt.openpipeline.pipelines"],["event.provider"],["event.status_transition"],["dt.openpipeline.source"],["event.kind"],["event.id"],["dt.smartscape.host"],["dt.entity.host_group"],["dt.host_group.id"],["owner"],["logsQuery"],["logsJson"],["linkEncoded"]],"hideColumnsForLargeResults": false,"sortBy": [{ "columnId": "[\"timestamp\"]", "direction": "descending" }],"columnWidths": { "[\"content\"]": 730 },"columnTypeOverrides": [{"fields": ["content"],"id": 1768304842632,"value": "log-content"}],"columnOrder": ["[\"event.start\"]","[\"event.type\"]","[\"linkEncoded\"]","[\"log.source\"]","[\"dt.entity.kubernetes_cluster\"]","[\"k8s.pod.name\"]"]},"autoSelectVisualization": true},"querySettings": {"maxResultRecords": 1000,"defaultScanLimitGbytes": 500,"maxResultMegaBytes": 1,"defaultSamplingRatio": 10,"enableSampling": false},"customLinkSettings": {"version": 1,"customLinks": [{"name": "Go to pod/host logs","icon": "LogsIcon","urlPattern": "/ui/apps/dynatrace.logs/#{{linkEncoded}}","added": 1768909366996}]},"davis": {"enabled": false,"davisVisualization": { "isAvailable": true }},"timeframe": {"tileTimeframeEnabled": true,"tileTimeframe": { "from": "now()-24h", "to": "now()" }}},"3": {"type": "markdown","content": "# 🪵 Log module log sources status\nThe Dynatrace log module delivers insights into available log sources and their status. Automatically detected log sources and custom log sources are included.\n\nExamine the log monitoring coverage to identify gaps and investigate issues in the log collection process.\n\nFor focused analysis, apply filtering or select the menu icon (ellipsis) next to the row or entity to navigate to affected entities or logs. The filters above affect dashboard's tiles with event lists. (Filtering lists limits apply: 1000 items, including wildcard.)\n\n"},"5": {"title": "📋 Log source status events","description": "\n","type": "data","query": "fetch dt.system.events, from: toTimestamp($dt_timeframe_from)-24h, to: toTimestamp($dt_timeframe_to)\n| filter event.provider == \"Log Module\" and event.type == \"log_source.status\" \n| filter $EventType == \"*\" or in(event.type, $EventType)\n| filter $Host == \"*\" or in(host.name, $Host)\n| filter $HostGroup == \"*\" or in(dt.host_group.id, $HostGroup)\n| filter $ProcessGroup == \"*\" or in(dt.process_group.detected_name, $ProcessGroup)\n| filter isNotNull(log.source) and ($LogSource == \"*\" or in(log.source, $LogSource))\n| filter $FileStatus == \"*\" or in(log.source.file_status, $FileStatus)\n| filter $IngestStatus == \"*\" or in(log.source.ingest_status, $IngestStatus)\n| filter $K8sClusterName == \"*\" or in(k8s.cluster.name, $K8sClusterName)\n| filter $K8sPodName == \"*\" or in(k8s.pod.name, $K8sPodName)\n| filter $K8sNamespaceName == \"*\" or in(k8s.namespace.name, $K8sNamespaceName)\n| dedup event.id, sort: { timestamp desc }\n| filter event.status == \"Active\"\n| filter toTimestamp($dt_timeframe_to) - timestamp <= 24h\n| fieldsAdd logsQuery = concat(\n \"fetch logs, from:\\\"\", toString($dt_timeframe_from), \"\\\", to:\\\"\", toString($dt_timeframe_to), \"\\\"\\n\",\n \"| filter dt.smartscape_source.id == \\\"\", dt.smartscape_source.id, \"\\\"\\n\",\n if(isNotNull(log.source), concat(\"| filter log.source == \\\"\", escape(log.source),\"\\\"\\n\")),\n \"| sort timestamp asc\")\n| fieldsAdd logsJson = concat(\"{\\\"dt.query\\\":\\\"\", escape(logsQuery),\"\\\"}\")\n| fieldsAdd linkEncoded = replaceString(escape(encodeUrl(logsJson)), \"+\", \"%20\")\n| fieldsAdd `Source entity` = if(isNotNull(dt.entity.process_group_instance), dt.entity.process_group_instance, \n else: if(isNotNull(dt.entity.host), dt.entity.host,\n else: if(isNotNull(k8s.pod.name), k8s.pod.name)))\n| fields event.start, log.source, `Source entity`, log.source.file_status, log.source.ingest_status, log.source.origin, linkEncoded\n| limit 1000\n\n// If you want to create a query yourself use this:\n// fetch dt.system.events\n// | filter event.provider == \"Log Module\" and event.type == \"Log Source status\"\n\n","visualization": "table","visualizationSettings": {"table": {"hiddenColumns": [["on-prem"],["dt.kubernetes.node.system_uuid"],["container.image.name"],["container.id"],["container.name"],["link"],["timestamp"],["event.type"],["content"],["loglevel"],["dt.smartscape_source.type"],["event.status"],["status"],["dt.openpipeline.pipelines"],["event.provider"],["event.status_transition"],["dt.openpipeline.source"],["event.kind"],["dt.smartscape_source.id"],["dt.smartscape.process"],["dt.source_entity"],["dt.smartscape.host"],["dt.process_group.detected_name"],["process.technology"],["dt.entity.host_group"],["dt.host_group.id"],["owner"],["dt.smartscape.container"],["gcp.project.id"],["gcp.region"],["k8s.cluster.name"],["k8s.node.name"],["dt.security_context"],["app"],["other"],["logsQuery"],["logsJson"],["linkEncoded"]],"hideColumnsForLargeResults": false,"columnWidths": {"[\"log.source.file_status\"]": 178.39,"[\"log.source\"]": 342},"sortBy": [{"columnId": "[\"log.source.file_status\"]","direction": "descending"}],"columnTypeOverrides": [{"fields": ["content"],"id": 1768304842632,"value": "log-content"}],"columnOrder": ["[\"event.start\"]","[\"log.source\"]","[\"Source entity\"]","[\"log.source.file_status\"]","[\"log.source.ingest_status\"]","[\"linkEncoded\"]","[\"log.source.origin\"]"]},"autoSelectVisualization": false},"querySettings": {"maxResultRecords": 1000,"defaultScanLimitGbytes": 500,"maxResultMegaBytes": 100,"defaultSamplingRatio": 10,"enableSampling": false},"customLinkSettings": {"version": 1,"customLinks": [{"name": "Open Host","icon": "ZoomToSelectionIcon","urlPattern": "/ui/apps/dynatrace.infraops/explorer/Hosts?fullPageId={{dt.entity.host}}","added": 1768580290502},{"name": "Open Kubernetes Cluster","icon": "ZoomToSelectionIcon","urlPattern": "/ui/intent/dynatrace.kubernetes/view-entity-dt.entity.kubernetes_cluster/#{\"id\":\"{{dt.entity.kubernetes_cluster}}\"}","added": 1768580315895},{"name": "Go to pod/host logs","icon": "LogsIcon","urlPattern": "/ui/apps/dynatrace.logs/#{{linkEncoded}}","added": 1768909408216}]},"davis": {"enabled": false,"davisVisualization": { "isAvailable": true }},"timeframe": {"tileTimeframeEnabled": true,"tileTimeframe": { "from": "now()-24h", "to": "now()" }}},"6": {"title": "Currently active issues (24 hours)","type": "data","query": "fetch dt.system.events, from: now() - 24h\n| filter event.provider == \"Log Module\" and event.type != \"log_source.status\"\n| dedup event.id, sort: {timestamp desc}\n| filter event.status == \"Active\"\n| makeTimeseries {count = count(default:0)}, by: {loglevel, event.type}\n| fieldsAdd severity = if(loglevel == \"ERROR\", 0, else: if(loglevel == \"WARN\", 1, else: if(loglevel == \"NONE\", 2, else: 3))), `Count` = arraySum(count)\n| sort severity, `Count` desc\n| fieldsRename Event=event.type, `24h Distribution`=count, Status=loglevel","visualization": "table","visualizationSettings": {"table": {"colorThresholdTarget": "background","hiddenColumns": [["timeframe"], ["interval"], ["severity"]],"hideColumnsForLargeResults": false,"linewrapEnabled": true,"monospacedFontEnabled": true,"selectedColumnForRowThreshold": "Status","columnWidths": { "[\"Event\"]": 175.69, "[\"Count\"]": 49.59 },"columnTypeOverrides": [{"fields": ["24h Distribution"],"value": "sparkline","id": 1769429484606,"disableRemoval": false},{"id": 403279.40000000014,"fields": ["Count"],"value": "text","disableRemoval": false}],"columnOrder": ["[\"timeframe\",\"start\"]","[\"timeframe\",\"end\"]","[\"interval\"]","[\"Status\"]","[\"Event\"]","[\"Count\"]","[\"24h Distribution\"]","[\"severity\"]"]},"autoSelectVisualization": false,"unitsOverrides": [{"identifier": "Active count","unitCategory": "unspecified","baseUnit": "count","displayUnit": null,"decimals": 0,"suffix": "","delimiter": false,"added": 1768392932496}],"coloring": {"colorRules": [{"value": "INFO","comparator": "=","field": "Status","colorMode": "custom-color","customColor": {"Default": "var(--dt-colors-charts-categorical-themed-blue-steel-color-05-default, #134fc9)"},"type": "string"},{"value": "WARN","comparator": "=","field": "Status","colorMode": "custom-color","customColor": {"Default": "var(--dt-colors-charts-status-warning-default, #eea53c)"},"type": "string"},{"value": "ERROR","comparator": "=","field": "Status","colorMode": "custom-color","customColor": {"Default": "var(--dt-colors-charts-apdex-unacceptable-default, #cd3741)"},"type": "string"},{"value": "NONE","comparator": "=","field": "Status","colorMode": "custom-color","customColor": {"Default": "var(--dt-colors-charts-categorical-themed-blue-steel-color-05-default, #134fc9)"},"type": "string"}]}},"querySettings": {"maxResultRecords": 1000,"defaultScanLimitGbytes": 500,"maxResultMegaBytes": 1,"defaultSamplingRatio": 10,"enableSampling": false},"davis": {"enabled": false,"davisVisualization": { "isAvailable": true }},"timeframe": {"tileTimeframe": { "from": "now()-24h", "to": "now()" },"tileTimeframeEnabled": false}},"7": {"title": "Self-monitoring events over time","type": "data","query": "fetch dt.system.events, from: toTimestamp($dt_timeframe_from) - 24h, to: toTimestamp($dt_timeframe_to)\n| filter event.provider == \"Log Module\" and not event.type == \"log_source.status\"\n| sort timestamp asc\n| summarize {\n start = takeFirst(if(event.status_transition == \"Created\", timestamp)),\n closed_at = takeLast(if(event.status == \"Closed\", timestamp)),\n last_refresh = takeLast(timestamp),\n type = takeLast(event.type)\n },\n by: { event.id }\n| fieldsAdd inferred_end = coalesce(\n closed_at,\n if((toTimestamp($dt_timeframe_to) - last_refresh) >= 24h, last_refresh + 24h, else: null))\n| makeTimeseries activeProblems = count(),\n from: toTimestamp($dt_timeframe_from),\n to: toTimestamp($dt_timeframe_to),\n spread: timeframe(\n from: coalesce(start, toTimestamp($dt_timeframe_from)-24h),\n to: coalesce(inferred_end, toTimestamp($dt_timeframe_to))),\n nonempty:true,\n by: { type }","visualization": "areaChart","visualizationSettings": {"chartSettings": { "xAxisScaling": "auto" },"legend": { "ratio": 42 },"autoSelectVisualization": false,"unitsOverrides": [{"identifier": "activeProblems","unitCategory": "unspecified","baseUnit": "count","displayUnit": null,"decimals": null,"suffix": "","delimiter": false,"added": 1768576240503}]},"querySettings": {"maxResultRecords": 1000,"defaultScanLimitGbytes": 500,"maxResultMegaBytes": 1,"defaultSamplingRatio": 10,"enableSampling": false},"davis": {"enabled": false,"davisVisualization": { "isAvailable": true }},"timeframe": {"tileTimeframe": { "from": "now()-24h", "to": "now()" },"tileTimeframeEnabled": false}},"9": {"title": "Log sources status over time","type": "data","query": "fetch dt.system.events, from: toTimestamp($dt_timeframe_from) - 24h, to: $dt_timeframe_to\n| filter event.provider == \"Log Module\"\n and event.type == \"log_source.status\"\n| fieldsAdd category =\n if(log.source.file_status == \"FILE_STATUS_OK\" and log.source.ingest_status == \"Ingested\", \"Detected and available | Ingestion configured\", else:\n if(log.source.file_status == \"FILE_STATUS_OK\" and log.source.ingest_status == \"Not ingested\", \"Detected and available | Ingestion NOT configured\", else:\n if(log.source.file_status != \"FILE_STATUS_OK\" and log.source.ingest_status == \"Ingested\", \"Unsupported or issues | Ingestion configured\", else:\n if(log.source.file_status != \"FILE_STATUS_OK\" and log.source.ingest_status == \"Not ingested\", \"Unsupported or issues | Ingestion NOT configured\", else:\n if(log.source.file_status != \"FILE_STATUS_OK\" and log.source.ingest_status == \"Partially ingested\", \"Unsupported or issues | Partial ingestion configured\", else:\n if(log.source.file_status == \"FILE_STATUS_OK\" and log.source.ingest_status == \"Partially ingested\", \"Detected and available | Partial ingestion configured\",\n else: \"Other\"))))))\n| sort timestamp asc\n| summarize {\n start = takeFirst(if(event.status == \"Active\", timestamp)),\n closed_at = takeLast(if(event.status == \"Closed\", timestamp)),\n last_refresh = takeLast(timestamp),\n category = takeLast(category)\n },\n by: { event.id }\n| fieldsAdd inferred_end = coalesce(\n closed_at,\n if((toTimestamp($dt_timeframe_to) - last_refresh) >= 24h, toTimestamp(last_refresh) + 24h, else: null))\n| makeTimeseries activeProblems = count(),\n from: toTimestamp($dt_timeframe_from),\n to: toTimestamp($dt_timeframe_to),\n spread: timeframe(\n from: coalesce(start, toTimestamp($dt_timeframe_from) - 24h),\n to: coalesce(inferred_end, $dt_timeframe_to)),\n nonempty: true,\n by: { category }","visualization": "lineChart","visualizationSettings": {"legend": { "ratio": 32 },"autoSelectVisualization": false},"querySettings": {"maxResultRecords": 1000,"defaultScanLimitGbytes": 500,"maxResultMegaBytes": 1,"defaultSamplingRatio": 10,"enableSampling": false},"davis": {"enabled": false,"davisVisualization": { "isAvailable": true }},"timeframe": {"tileTimeframe": { "from": "now()-24h", "to": "now()" },"tileTimeframeEnabled": false}},"10": {"type": "markdown","content": "# 📊 Log module self-monitoring events overview\nLog module self-monitoring events allow you to review log ingestion issues, event types, and affected entities. \nThere are two event categories: issues for logs linked to the log source (ingested but issues detected) and not linked to the log source (not ingested).\n\nFor focused analysis, apply filtering or select the menu icon (ellipsis) next to the row or entity to navigate to affected entities or logs. The filters above affect dashboard's tiles with event lists. (Filtering lists limits apply: 1000 items, including wildcard.) Follow [Troubleshooting guides](https://docs.dynatrace.com/docs) to resolve issues.\n\n\n"},"12": {"title": "Active issues - host based log modules","description": "\n","type": "data","query": "fetch dt.system.events, from: toTimestamp($dt_timeframe_from) - 24h, to: toTimestamp($dt_timeframe_to)\n| filter event.provider == \"Log Module\" and event.type != \"log_source.status\"\n| filter exists(dt.entity.host) and isNull(k8s.node.name)\n| filter $EventType == \"*\" or in(event.type, $EventType)\n| filter $Host == \"*\" or in(host.name, $Host)\n| filter $HostGroup == \"*\" or in(dt.host_group.id, $HostGroup)\n| filter $ProcessGroup == \"*\" or in(dt.process_group.detected_name, $ProcessGroup)\n| filter $LogSource == \"*\" or in(log.source, $LogSource)\n| filter $K8sClusterName == \"*\" or in(k8s.cluster.name, $K8sClusterName)\n| filter $K8sPodName == \"*\" or in(k8s.pod.name, $K8sPodName)\n| filter $K8sNamespaceName == \"*\" or in(k8s.namespace.name, $K8sNamespaceName)\n| dedup event.id, sort: { timestamp desc }\n| filter event.status == \"Active\"\n| filter toTimestamp($dt_timeframe_to) - timestamp <= 24h\n| fieldsAdd logsQuery = concat(\n \"fetch logs, from:\\\"\", toString($dt_timeframe_from), \"\\\", to:\\\"\", toString($dt_timeframe_to), \"\\\"\\n\",\n \"| filter dt.smartscape_source.id == \\\"\", dt.smartscape_source.id, \"\\\"\\n\",\n if(isNotNull(log.source), concat(\"| filter log.source == \\\"\", escape(log.source),\"\\\"\\n\")),\n \"| sort timestamp asc\")\n| fieldsAdd logsJson = concat(\"{\\\"dt.query\\\":\\\"\", escape(logsQuery),\"\\\"}\")\n| fieldsAdd linkEncoded = replaceString(escape(encodeUrl(logsJson)), \"+\", \"%20\")\n| fieldsAdd `Source entity` = if(isNotNull(dt.entity.process_group_instance), dt.entity.process_group_instance, \n else: if(isNotNull(dt.entity.host), dt.entity.host,\n else: if(isNotNull(k8s.pod.name), k8s.pod.name)))\n| fields event.start, event.type, log.source, dt.entity.process_group_instance, dt.entity.host, k8s.pod.name, linkEncoded\n| limit 1000\n\n// If you want to create a query yourself use this:\n// fetch dt.system.events\n// | filter event.provider == \"Log Module\" and event.type == \"Log Source status\"","visualization": "table","visualizationSettings": {"table": {"hiddenColumns": [["dt.kubernetes.node.system_uuid"],["link"],["timestamp"],["logsQuery"],["logsJson"],["dt.host_group.id"],["dt.smartscape.host"],["dt.smartscape.process"],["dt.smartscape_source.type"],["dt.source_entity"],["event.id"],["event.kind"],["event.provider"],["event.status"],["event.status_transition"],["loglevel"],["owner"],["process.technology"],["status"],["dt.openpipeline.source"],["dt.openpipeline.pipelines"],["gcp.project.id"],["gcp.region"],["k8s.cluster.name"],["dt.smartscape.container"],["k8s.node.name"],["app"],["dt.security_context"],["on-prem"],["other"],["container.id"],["container.image.name"],["container.name"],["linkEncoded"]],"hideColumnsForLargeResults": false,"sortBy": [{ "columnId": "[\"timestamp\"]", "direction": "descending" }],"columnTypeOverrides": [{"fields": ["content"],"id": 1768304842632,"value": "log-content"}],"columnOrder": ["[\"event.start\"]","[\"event.type\"]","[\"log.source\"]","[\"linkEncoded\"]","[\"dt.entity.process_group_instance\"]","[\"dt.entity.host\"]","[\"k8s.pod.name\"]"]},"autoSelectVisualization": true},"querySettings": {"maxResultRecords": 1000,"defaultScanLimitGbytes": 500,"maxResultMegaBytes": 1,"defaultSamplingRatio": 10,"enableSampling": false},"customLinkSettings": {"version": 1,"customLinks": [{"name": "Go to pod/host logs","icon": "LogsIcon","urlPattern": "/ui/apps/dynatrace.logs/#{{linkEncoded}}","added": 1768833996854}]},"davis": {"enabled": false,"davisVisualization": { "isAvailable": true }},"timeframe": {"tileTimeframeEnabled": true,"tileTimeframe": { "from": "now()-24h", "to": "now()" }}},"13": {"title": "Log module log sources coverage","type": "data","query": "fetch dt.system.events, from: toTimestamp($dt_timeframe_from) - 24h, to: $dt_timeframe_to\n| filter event.provider == \"Log Module\" and event.type == \"log_source.status\"\n| fields category =\n if(log.source.file_status == \"FILE_STATUS_OK\" and log.source.ingest_status == \"Ingested\", \"Detected and available | Ingestion configured\", else:\n if(log.source.file_status == \"FILE_STATUS_OK\" and log.source.ingest_status == \"Not ingested\", \"Detected and available | Ingestion NOT configured\", else:\n if(log.source.file_status != \"FILE_STATUS_OK\" and log.source.ingest_status == \"Ingested\", \"Unsupported or issues | Ingestion configured\", else:\n if(log.source.file_status != \"FILE_STATUS_OK\" and log.source.ingest_status == \"Not ingested\", \"Unsupported or issues | Ingestion NOT configured\", else:\n if(log.source.file_status != \"FILE_STATUS_OK\" and log.source.ingest_status == \"Partially ingested\", \"Unsupported or issues | Partial ingestion configured\", else:\n if(log.source.file_status == \"FILE_STATUS_OK\" and log.source.ingest_status == \"Partially ingested\", \"Detected and available | Partial ingestion configured\",\n else: \"Other\")))))),\n event.id,\n timestamp,\n event.status\n| dedup event.id, sort: { timestamp desc }\n| filter event.status == \"Active\"\n| filter toTimestamp($dt_timeframe_to) - timestamp <= 24h\n| summarize value = count(), by: {category}","visualization": "pieChart","visualizationSettings": {"chartSettings": { "circleChartSettings": { "valueType": "relative" } },"legend": { "ratio": 35 },"autoSelectVisualization": false},"querySettings": {"maxResultRecords": 1000,"defaultScanLimitGbytes": 500,"maxResultMegaBytes": 1,"defaultSamplingRatio": 10,"enableSampling": false},"davis": {"enabled": false,"davisVisualization": { "isAvailable": true }}},"15": {"type": "markdown","content": "ℹ️ This dashboard is available for download from the official Dynatrace documentation during the Early Access phase of log module self-monitoring events. To populate it with data, you need to **[opt in](https://docs.dynatrace.com/docs)** to allow the OneAgent log module to send self-monitoring events to your Dynatrace environment. \n\nDashboard's content will be migrated to the \"Log ingest Overview\" dashboard for Dynatrace versions 1.339+."}},"layouts": {"0": { "x": 17, "y": 5, "w": 7, "h": 5 },"3": { "x": 0, "y": 10, "w": 24, "h": 3 },"5": { "x": 10, "y": 13, "w": 14, "h": 7 },"6": { "x": 0, "y": 5, "w": 5, "h": 5 },"7": { "x": 5, "y": 5, "w": 5, "h": 5 },"9": { "x": 5, "y": 13, "w": 5, "h": 7 },"10": { "x": 0, "y": 2, "w": 24, "h": 3 },"12": { "x": 10, "y": 5, "w": 7, "h": 5 },"13": { "x": 0, "y": 13, "w": 5, "h": 7 },"15": { "x": 0, "y": 0, "w": 24, "h": 2 }},"importedWithCode": false,"settings": {},"annotations": [{"version": 0,"key": "Annotation1","type": "query","input": "fetch logs","displaySettings": { "referenceIds": [], "pinned": true }}]} -
In Dynatrace, go to
 Dashboards.
 -
In the app header, select Upload.
-
Open the
Log module self-monitoring.jsonfile that you've just created.
Now you can see the Log module self-monitoring dashboard added to your Dynatrace environment.
Dashboard features
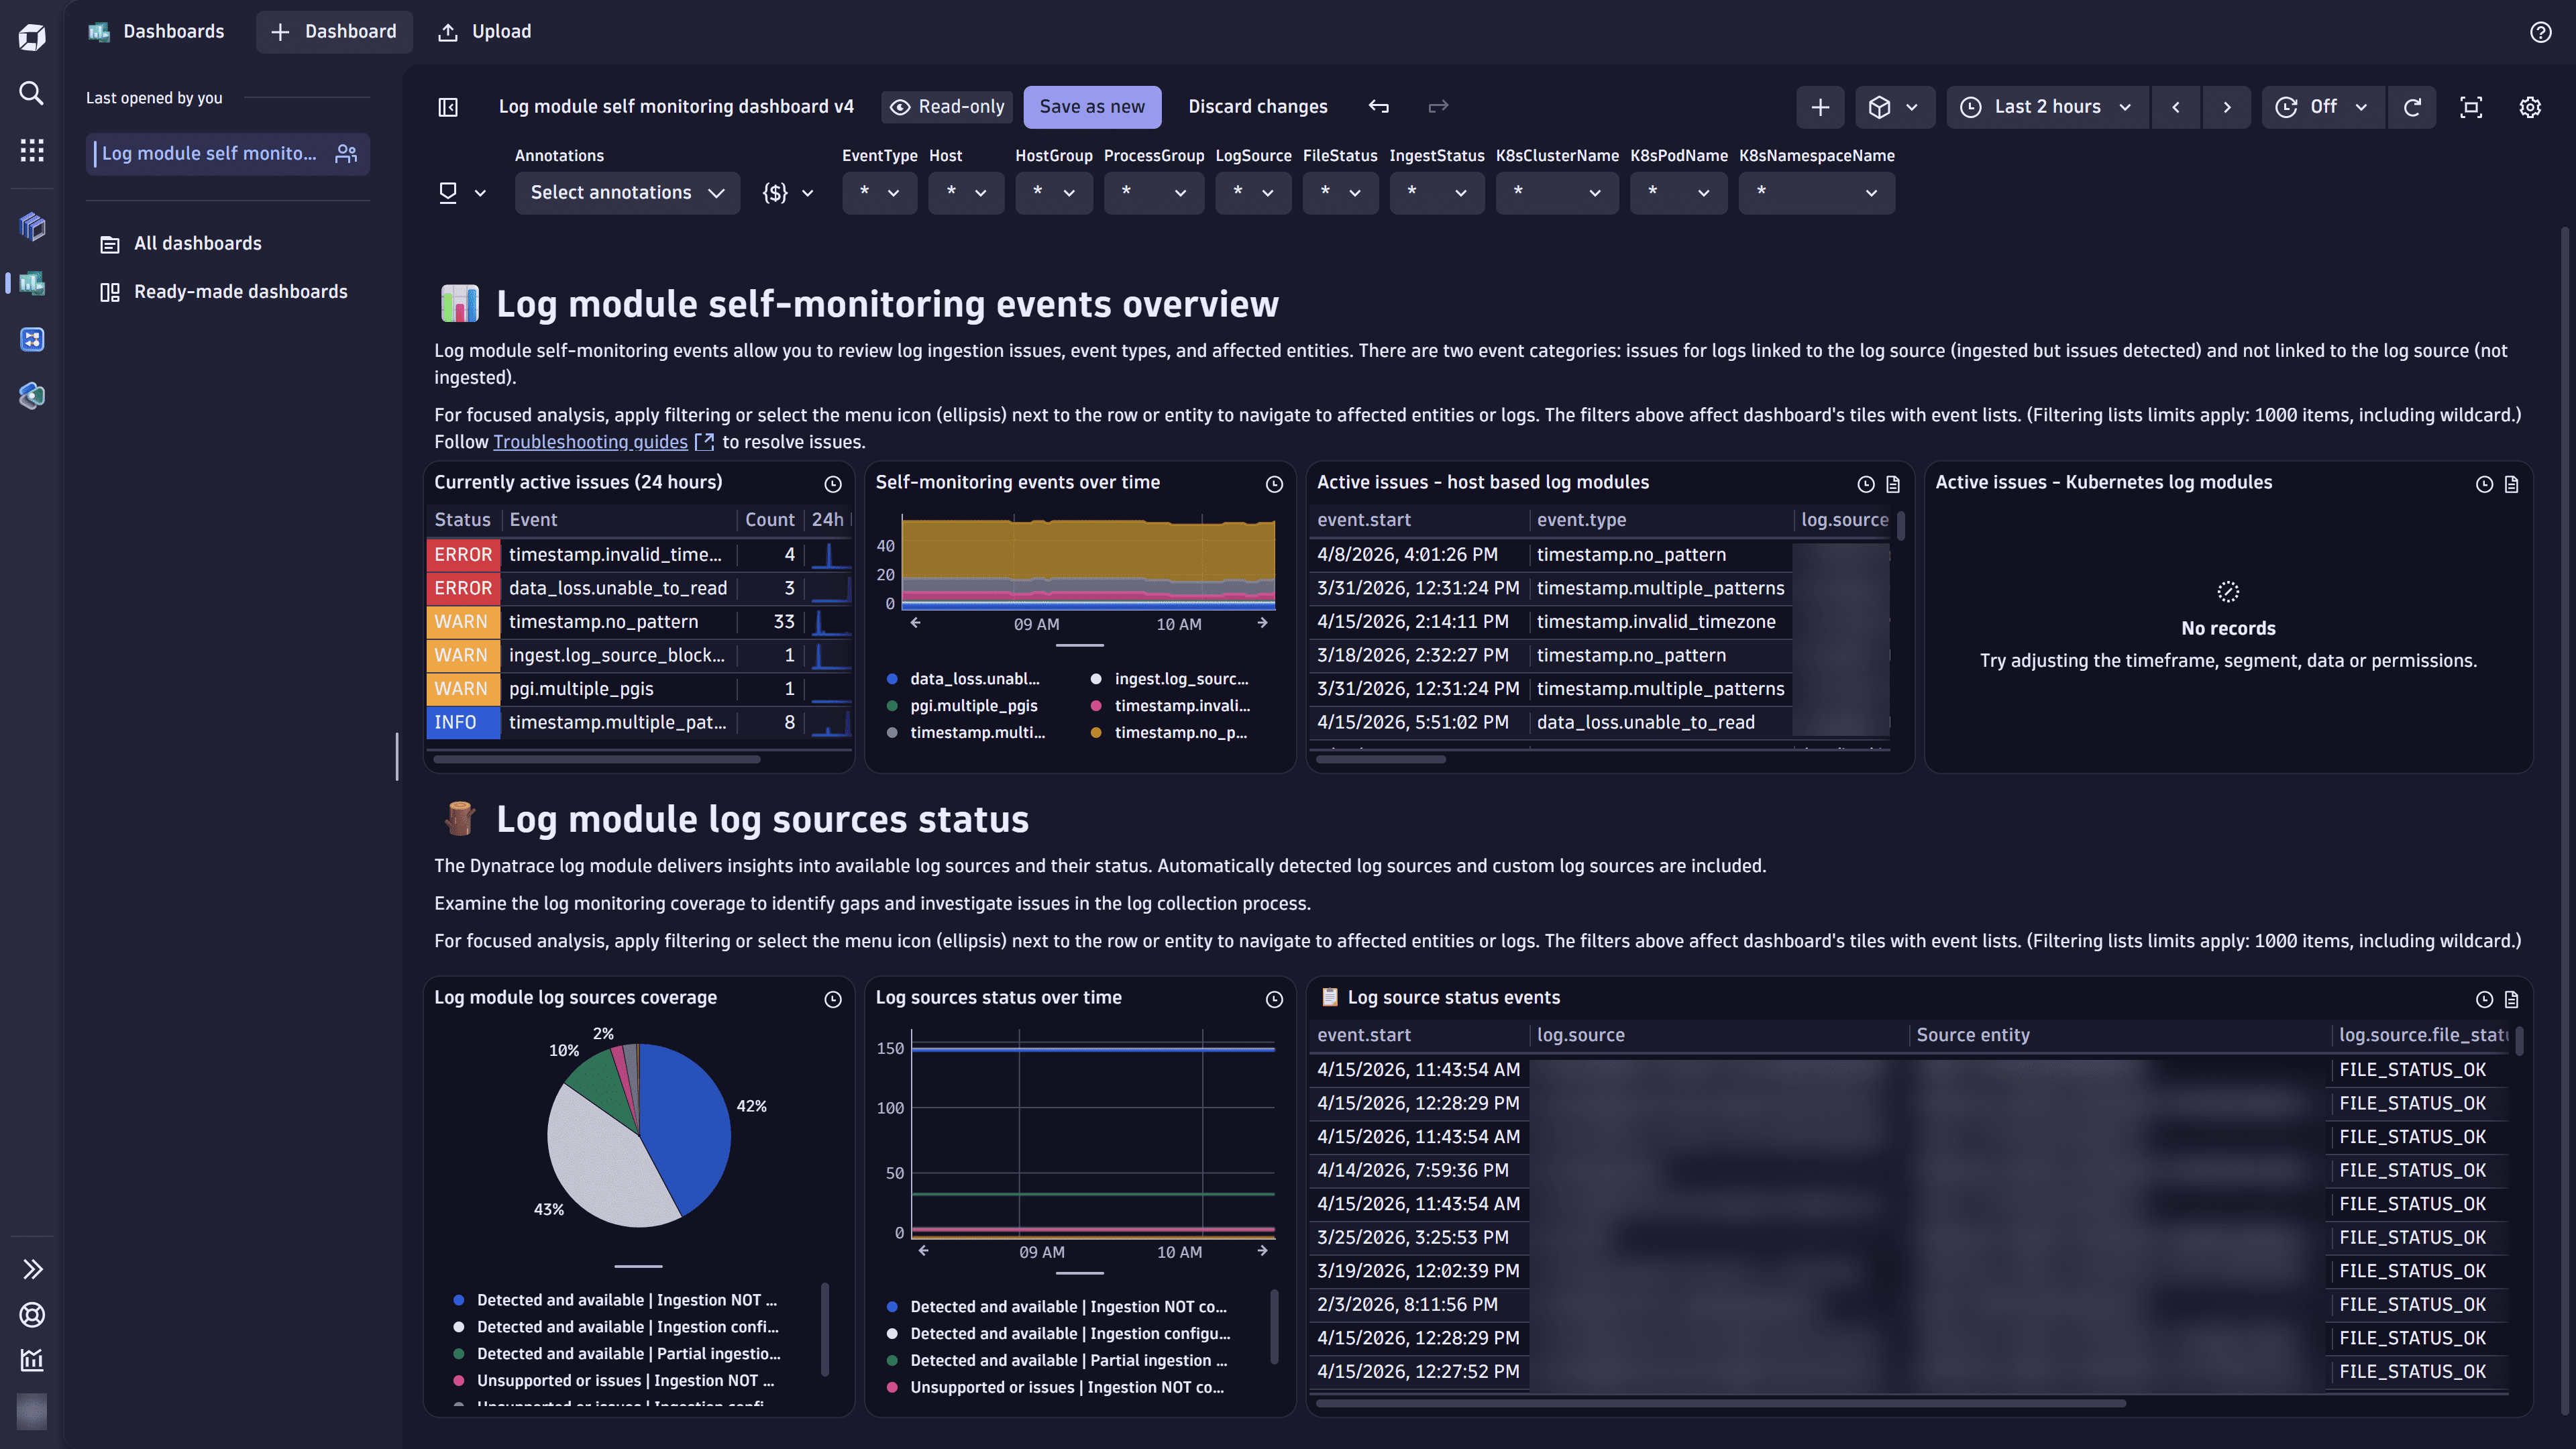
Log module self‑monitoring events overview
This section of the dashboard summarizes problems detected by the Log module.
-
Currently active issues (24 hours): A table showing the most recent SFM events, grouped by status (for example,
WARNorINFO) and event type (such as timestamp pattern issues). It includes a count and a short 24‑hour distribution so that you can see which problems are most frequent right now. -
Self‑monitoring events over time: A time series chart displaying the volume of different SFM event types over the selected period. This helps you identify trends, spikes, or recurring issues in log ingestion and parsing.
-
Active issues – host based log modules: A detailed event list for host-based log sources. For each issue, it shows the start time, event type, affected log file or path, and the corresponding host or process entity. Use this list to drill down into problematic log files on traditional or VM-based hosts.
-
Active issues – Kubernetes log modules: A similar event list focused on Kubernetes log sources. It highlights which containers or Kubernetes entities are currently affected by the Log module issues.
Log module log sources status
This section focuses on coverage and lifecycle of log sources themselves.
-
Log module log sources coverage: A pie chart that breaks down all discovered log sources into coverage categories (for example, detected with ingestion configured, detected without ingestion configured, and other states). This gives a quick indication of how complete your log monitoring setup is.
-
Log sources status over time: A time‑based chart that shows how the number of log sources in each status category changes over the selected period. It helps you see when new sources appeared, were configured, or became unavailable.
-
Log source status events: A chronological table of log source–related events (such as creation, configuration changes, or status changes), including the timestamp, log source identifier or path, the related entity (host, container, and more), and the log source type. This is useful for auditing configuration changes and correlating them with coverage changes or incidents.
Table drilldowns and entity navigation
All dashboard tables provide drill-down actions through (Actions menu) in each row or cell.
- Select Go to pod/host logs to open logs for the selected issue or log source.
- In
dt.entity.*columns (for example,dt.entity.host,dt.entity.kubernetes_cluster, anddt.entity.process_group), select (Actions menu) to open the corresponding entity details page.
On the entity details page, you can see the full context about that host, Kubernetes cluster, process group, or other entity (metrics, topology, problems, and related logs).
Every issue detection, issue state change, log source detection, or log source state change is communicated via SFM events with some time delay, due to the fact that SFM event generation is implemented on the Log module side (edge). The time delay is typically up to 90 seconds, though it may increase if network communication between the Log module and your Dynatrace environment is disrupted.
Use SFM events to resolve log-related issues
The SFM event types and required actions are described below.
log_source.status (info)
Explanation
Provides additional information and is generated for each log source known to the Log module. For each log source, provides context metadata (for example, related process group and host), along with additional string properties.
Additional properties:
log.source.file_status: Current monitoring state of a log source (for example, “OK” or “File not exists”).log.source.ingest_status: Log content ingestion status (for example, “Fully ingested”, “Partially ingested”, or “Not ingested”).log.source.origin: Indicates where the log derives from (for example, “Automatically detected” or “Custom log source”).
Required actions
Use the file status and ingest status to decide what to do next.
-
File status
OK: No action required. -
File status
Not Exist, but the file is actually present on the host (this only happens for a custom log source). Check the following:- The custom log source file path pattern definition for typos.
- Whether the Log module operates in the same filesystem in which you defined the custom log source file pattern.
- Whether the Log module has appropriate privileges to access the file. In particular:
- On Linux: The Log module (with default settings) has OS capabilities to read each file on local disks, but not on remote ones. For remote files, you need read privileges for the user the Log module runs as (by default,
dtuser), and read+execute privileges on each remote directory in the file path. - On Windows: The user under which the OneAgent service runs has sufficient privileges to access the log file. This is usually true for local disks, but remote disks may require additional authentication that OneAgent can't pass through.
- On Linux: The Log module (with default settings) has OS capabilities to read each file on local disks, but not on remote ones. For remote files, you need read privileges for the user the Log module runs as (by default,
- Whether the files matched by the custom file path pattern satisfy security rules. See the
ingest.custom_log_source_blockedSFM event type below for details.
-
File status
Binary, but the file looks like text. There might still be a portion of binary content inside the file, or there used to be binary content in a log file that is part of the log source, even if such a file has already been removed. Consider the following options:-
If it's a custom log source, and some files matching the pattern are binary and you don't want to ingest them, adjust the custom log source pattern, or split the custom log source definition into multiple narrower patterns so that those patterns don't match binary files.
-
If it's a custom log source, and some files matching the pattern have occasional binary content but you still want to ingest them, turn on Allow binary files in the custom log source definition.
-
If it's an automatically detected file, create one or more custom log source definitions and adjust them as in the points above.
-
If you don't want to apply any of the above and the binary content no longer exists (because it was in a file that was deleted) and you don't expect it to appear again, you might consider removing the Log module persistence file. The path to the persistence file (Log Analytics persistence) is described in, for example, OneAgent files and disk space requirements on Linux.
You can safely delete the persistence file only when the Log module isn't running. Deletion might cause some data loss or data duplication around the time of removal.
-
-
File status
Sensitive Masking Timeout: See theingest.masking_timeoutSFM event type below. -
Ingest status isn't as expected: Review your log ingest rules. Typical mistakes are:
- Rules are evaluated from top to bottom, and the first matching rule decides whether a log record is ingested.
- The effective list of rules is a concatenation of the lists from all configuration scopes.
- The log source matcher matches the log source name, not the log file path. For example, a log source matcher
/path/a.2026.logdoesn't match a log source named/path/a.#.log, even if a file path/path/a.2026.logexists in the filesystem.
timestamp.no_pattern (warning)
Explanation
The Log module hasn't detected a timestamp in log content of a log source. In this case, the Log module sets a timestamp from the metadata (if available) or the timestamp when the Log module acquires the log record from the log source.
Required actions
When there's no timestamp:
- Rely on the Log module timestamping. However, when multiline log records are present in the log source, review if custom boundary detection configuration is necessary.
- Reconfigure log producer to change the log source format.
When the timestamp has a non-standard format, configure non-standard timestamp format.
timestamp.multiple_patterns (info)
Explanation
The Log module has detected multiple timestamp patterns being present simultaneously in a single log source.
Required actions
If it's expected, no action is required.
If the Log module incorrectly considers a part of log message as a log record timestamp, configure timestamp format explicitly.
timestamp.invalid_timezone (error)
Explanation
The Log module suspects that the time zone isn't properly detected or configured. For example, the Log module is configured to use the local time zone (for example, UTC+1), while the given log source is writing logs in ETC.
Required actions
The log record timestamps are likely incorrect, and you need to configure the time zone manually.
When working with timestamps, watch for these typical mistakes:
- Forgetting that the UI shows the value in the timestamp column converted to the browser's time zone when crafting a timestamp rule.
- Providing a timestamp pattern without a time zone element when you want to read the time zone from log content.
- Having multiple timestamp rules matching the same log source with the same pattern but different explicit time zones. In this case, the rule selection is undefined, and you should change the configuration to avoid this situation.
data_loss.unable_to_read (error)
Explanation
The Log module was unable to read a log file or a part of it, as the file has been removed, compressed, or moved to another location. This results in data loss.
Required actions
If the log source comes from a containerized application, turning on the Collect all container logs feature flag might resolve the issue.
Otherwise, the Log module supports typical log rotation patterns, but it expects the first rotated file to remain uncompressed and in the same directory. It also expects log files to stay available for a short time after they are written. If files are removed or compressed before the Log module can read them, adjust your log rotation settings so that files are kept longer than the Log module read interval.
The Log module read interval can be unusually long if the Log module experiences performance issues. The most frequent risk factors are:
- A custom log source definition with wildcards on directories that effectively match a large number of files (not necessarily log files).
- The Log module monitoring log directories that contain a large number of files (more than 10,000).
- The Log module monitoring very slow remote disks.
data_loss.network (error)
Explanation
The Log module was unable to send log records to the Dynatrace environment quickly enough. This results in data loss.
Required actions
The issue might be caused by network connectivity issues between the Log module and the Dynatrace environment. Check your network connectivity health.
If the Log module is configured to ingest a large volume of logs, this exceeds the configured ingest limits or the environment's performance. In this case, reduce the number of ingested logs.
The Log module itself can also be too slow to send log records in time. The most frequent risk factors are:
- A custom log source definition with wildcards on directories that effectively match a large number of files (not necessarily log files).
- The Log module monitoring log directories that contain a large number of files (more than 10,000).
- The Log module monitoring very slow remote disks.
ingest.access_flag (warning)
Explanation
The Log module can't ingest log records because the Log Content Access flag (--set-app-log-content-access) is turned off.
Required actions
- For already installed OneAgents, use
onagentctlto unblock log ingest. - For newly installed OneAgents, you can enable log ingest during installation.
ingest.masking_timeout (error)
Explanation
The ingestion of a log source stopped because applying sensitive information masking had timed out. See Sensitive data masking in OneAgent for more details.
This issue is also reflected in the log source status SFM event for the log source.
Required actions
Review the masking rules enabled for the log source. There's a high chance the root cause is an improperly written regular expression. For guidance on writing efficient regular expressions, see Regular expressions in Dynatrace. The log source is ingested again after you change the configuration, or after you restart the Log module.
pgi.multiple_pgis (warning)
Explanation
This event type occurs when multiple process group instances (PGIs) are assigned to a single log source. This might sometimes be problematic—for example, some processing rules might expect that a log record is enriched with a single PGI.
In context of a custom log source, it means that multiple PGIs are configured explicitly. See Custom log source for details.
In context of an automatically detected log source, it can mean one of the following:
- Scenario A: Multiple processes have written to the same log source, and these processes are grouped to different PGIs. Note that this refers to a situation where the PGIs are correctly identified as separate PGIs. The processes might write to the same log source because:
- Scenario A1: The log source is a "sink" log file that gathers data from multiple applications.
- Scenario A2: The log source contains multiple log files, where each file belongs to a single PGI, but different files within the log source might belong to different PGIs.
- Scenario B: One PGI stopped writing to a log file, and shortly afterwards a separate PGI started writing to the same log file (or the PGI ID changed due to a change in process properties or OneAgent configuration). In this case, there's a single log monitoring interval for which the Log module doesn't know whether the log records written in it were written by the "old" or the "new" PGI, and it enriches the log records with both.
- Scenario C: Process group detection isn't working as expected because processes that belong to the same application have different PGI IDs assigned.
Required actions
In context of a custom log source, review the custom log source rule.
In context of an automatically detected log source:
- Scenario A1: No action is required.
- Scenario A2: Provide custom log source rules (at least one rule per PGI involved) that split the log file appropriately.
- Scenario B: No action is required.
- Scenario C: Review your process group detection configuration, or use automatic log enrichment.
The custom log source split solution from Scenario A2 can be applied regardless of whether the initial problem occurred for automatically detected or custom log sources.
Automatic log enrichment may also resolve the issue by injecting a proper PGI ID into log content.
pgi.lgi_explosion (error)
Explanation
The Log module automatically detected too many log sources for a single process group instance.
Required actions
If you need to ingest these log sources, do one of the following:
- Create a custom log source rule with a wildcard pattern that covers all log files written by the process group instance.
ingest.log_source_blocked (warning)
OneAgent version 1.337+
Explanation
Some or all log files detected for a log source have been blocked by security rules.
Required actions
Review the security rules and adjust them to fit your needs. See Security rules for a detailed explanation and instructions on how to alter the security rules.