Threat hunting and forensics
- Latest Dynatrace
- Tutorial
- Published Mar 14, 2024
When threat hunting, time and precision are crucial. You need to be as fast and accurate as possible to find and act upon information. As a security analyst investigating security incidents or threat hunting, you often need to
- Navigate between multiple executed queries and their results
- Manage the evidence gathered during investigations and reuse it when building additional queries
- Ensure that
- The investigation is maintained in context.
- The tools for such activities support quick query creation and a detailed overview of the results.
In the following, we demonstrate how you can achieve these goals using  Investigations.
Target audience
This page is intended for Security teams performing threat hunting or analyzing security incidents, such as the Incident Response team or Security Analysts.
Scenario
In the following, we address a scenario in which you get a notification from an external source about a suspiciously high number of unauthorized requests towards our Kubernetes control plane between 2024-02-13 16:00:00 and 2024-02-13 18:59:59. Your Kubernetes cluster has been set up to AWS EKS cluster, and logs are forwarded to Dynatrace.
As a security analyst, you want to understand if this is related to malicious activities or if it may be an indication of a cyber security incident. During this investigation, you will follow the trail of your findings to illustrate the nature of threat hunting and incident solving.
Prerequisites
-
Set up AWS logging to CloudWatch:
-
Basic knowledge of
-
How DNS name resolving works in Kubernetes clusters
Investigation path 1: Analyze Kubernetes audit logs
First, you want to understand which activities caused the notification about the high number of unauthorized requests in your Kubernetes audit logs.
Open Investigations and create a new investigation.
1. Set the timeframe
In the timeframe section, set the timeframe from 2024-02-13 16:00:00 to 2024-02-13 18:59:59, when the unauthorized requests occurred.
2. Fetch Kubernetes cluster audit logs
-
Kubernetes audit logs are forwarded to Dynatrace with
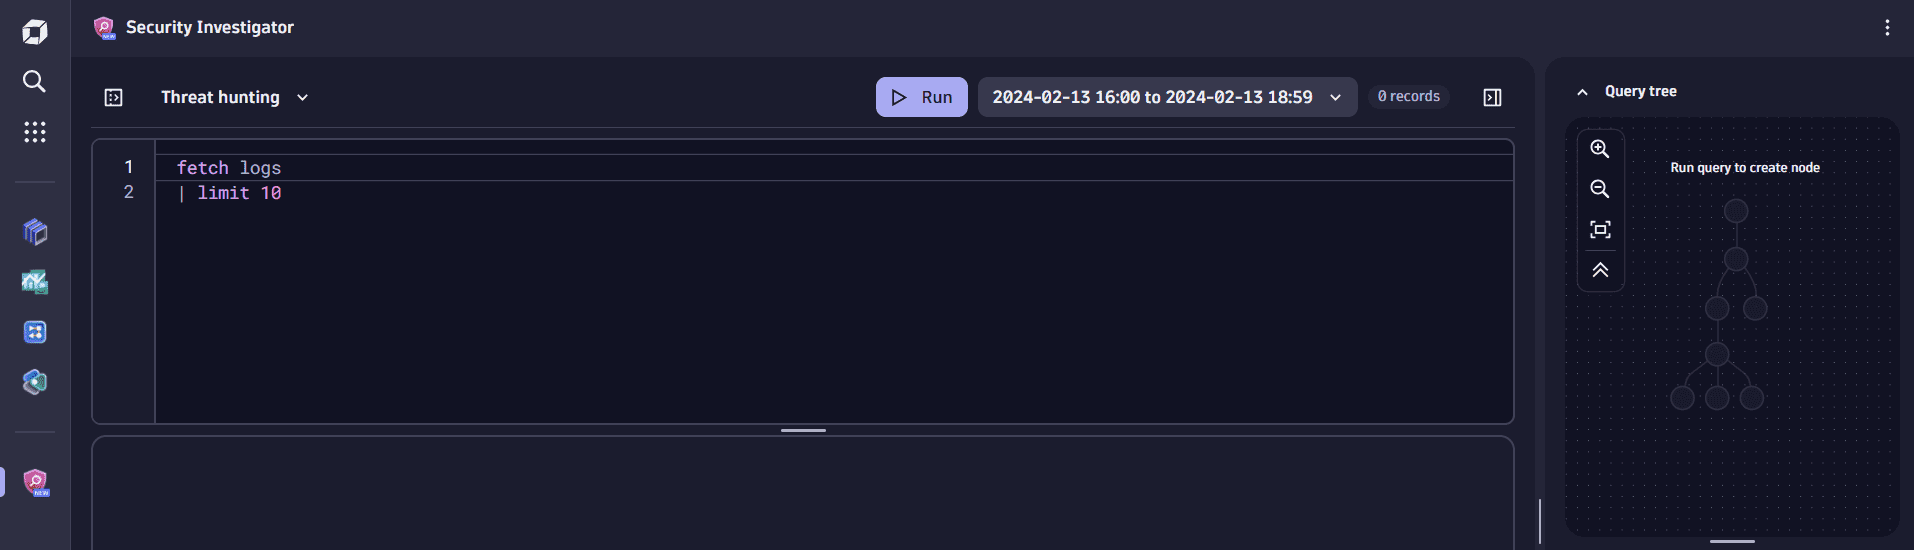
aws.log_groupandlog_streamvalues attached. To fetch all the unique AWS CloudWatch log groups that are ingested to Dynatrace, copy-paste the following DQL query in the query input.fetch logs| summarize count(), by: aws.log_group -
Select Run to execute the query.
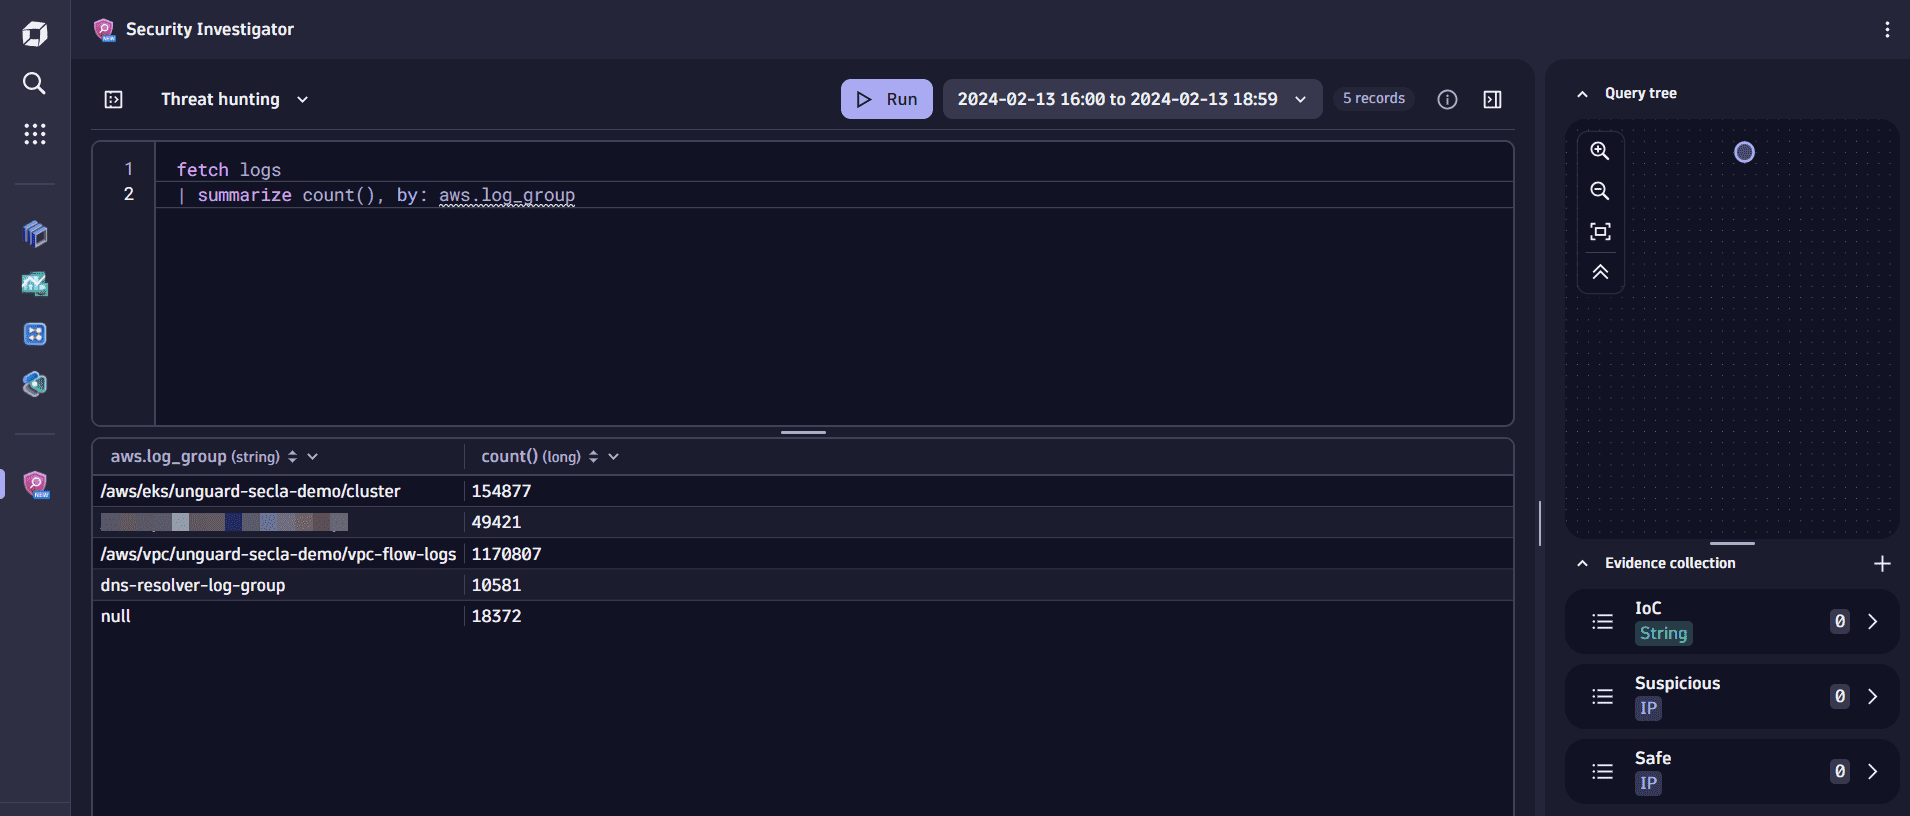 fetch kubernetes cluster audit logs
At this point, you notice a circle has appeared in the Query tree section in the upper right. This is called a root node and marks the starting point of your investigation. From here on, every time you modify and execute a query, a new node will be added in the query tree, allowing you to navigate among queries while keeping the history of your investigation intact. For details, see query tree.
3. Filter by log group name
-
In the query results, find the record with the log group collecting the EKS control plane logs (in our example,
/aws/eks/unguard-secla-demo/cluster) and add it as a filter to your DQL query.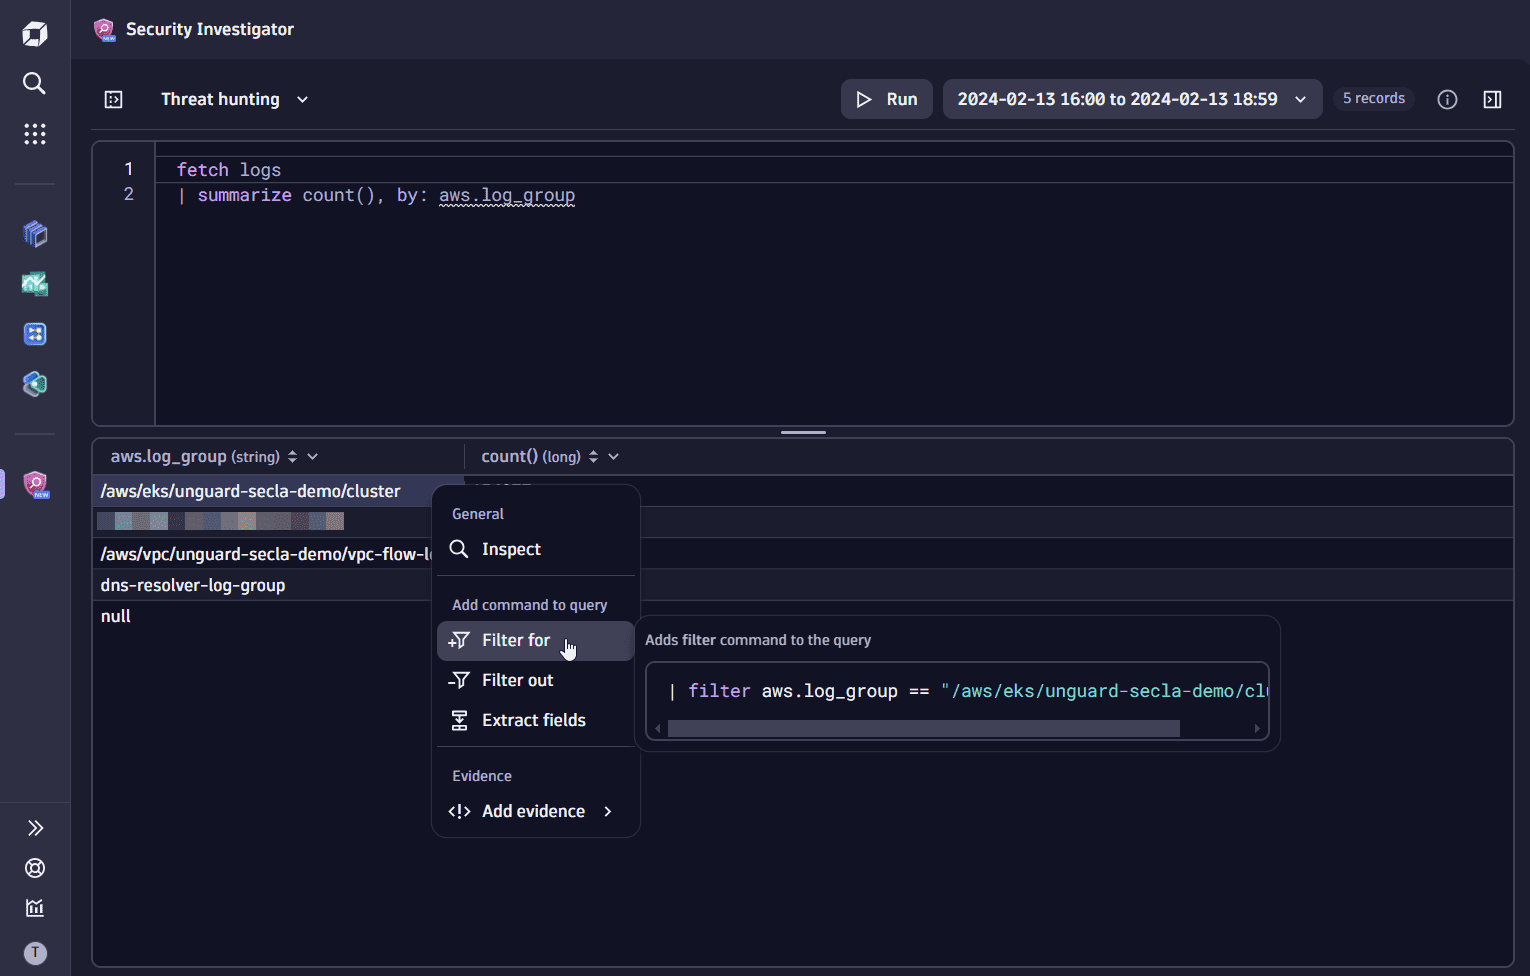 Add a filter for the log group name
 -
To view only the control plane audit events, modify the
filtercommand in the query input by adding theandoperator and thecontainsstring function as follows:| filter aws.log_group == "/aws/eks/unguard-secla-demo/cluster" and contains(aws.log_stream, "audit") -
In the query input, remove the
summarizecommand and select Run to execute the query.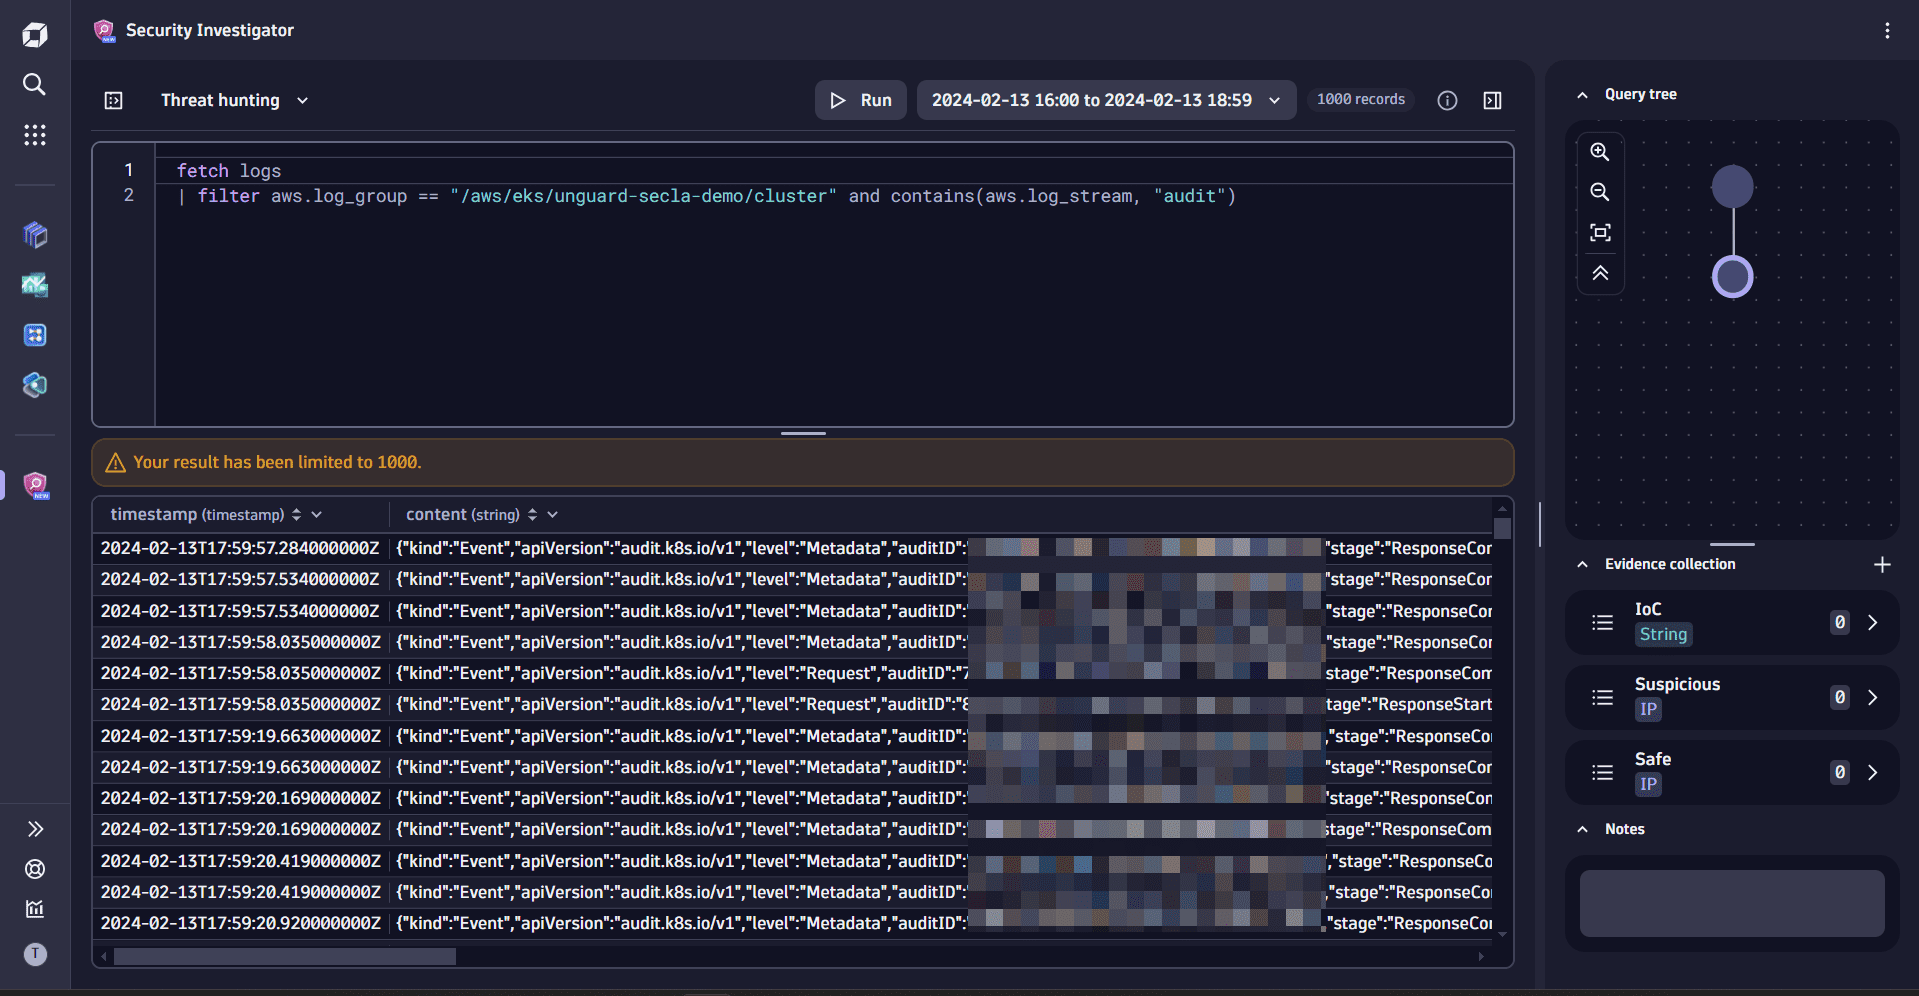 view only the control plane audit events
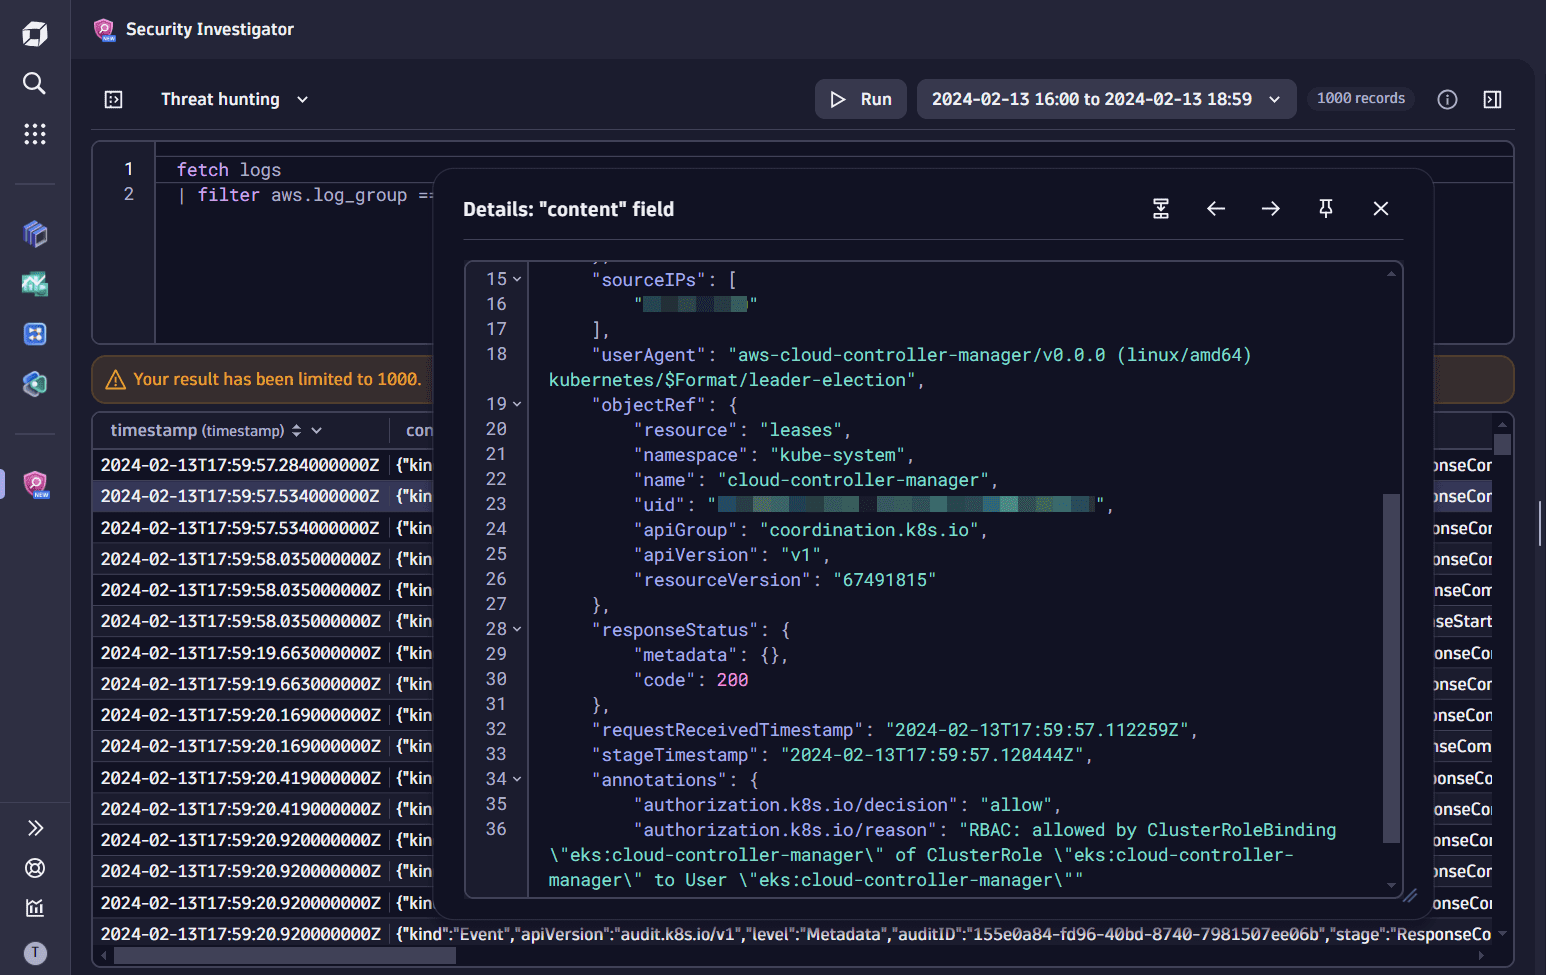
4. Inspect the content
In the query results table, right-click on any cell in the content field and select View field details to view the raw content of the field. For details, see Explore data in the original format.
5. Extract fields from JSON
-
In the query results table, right-click on any cell in the Content field and select Extract fields to navigate to DPL Architect.
-
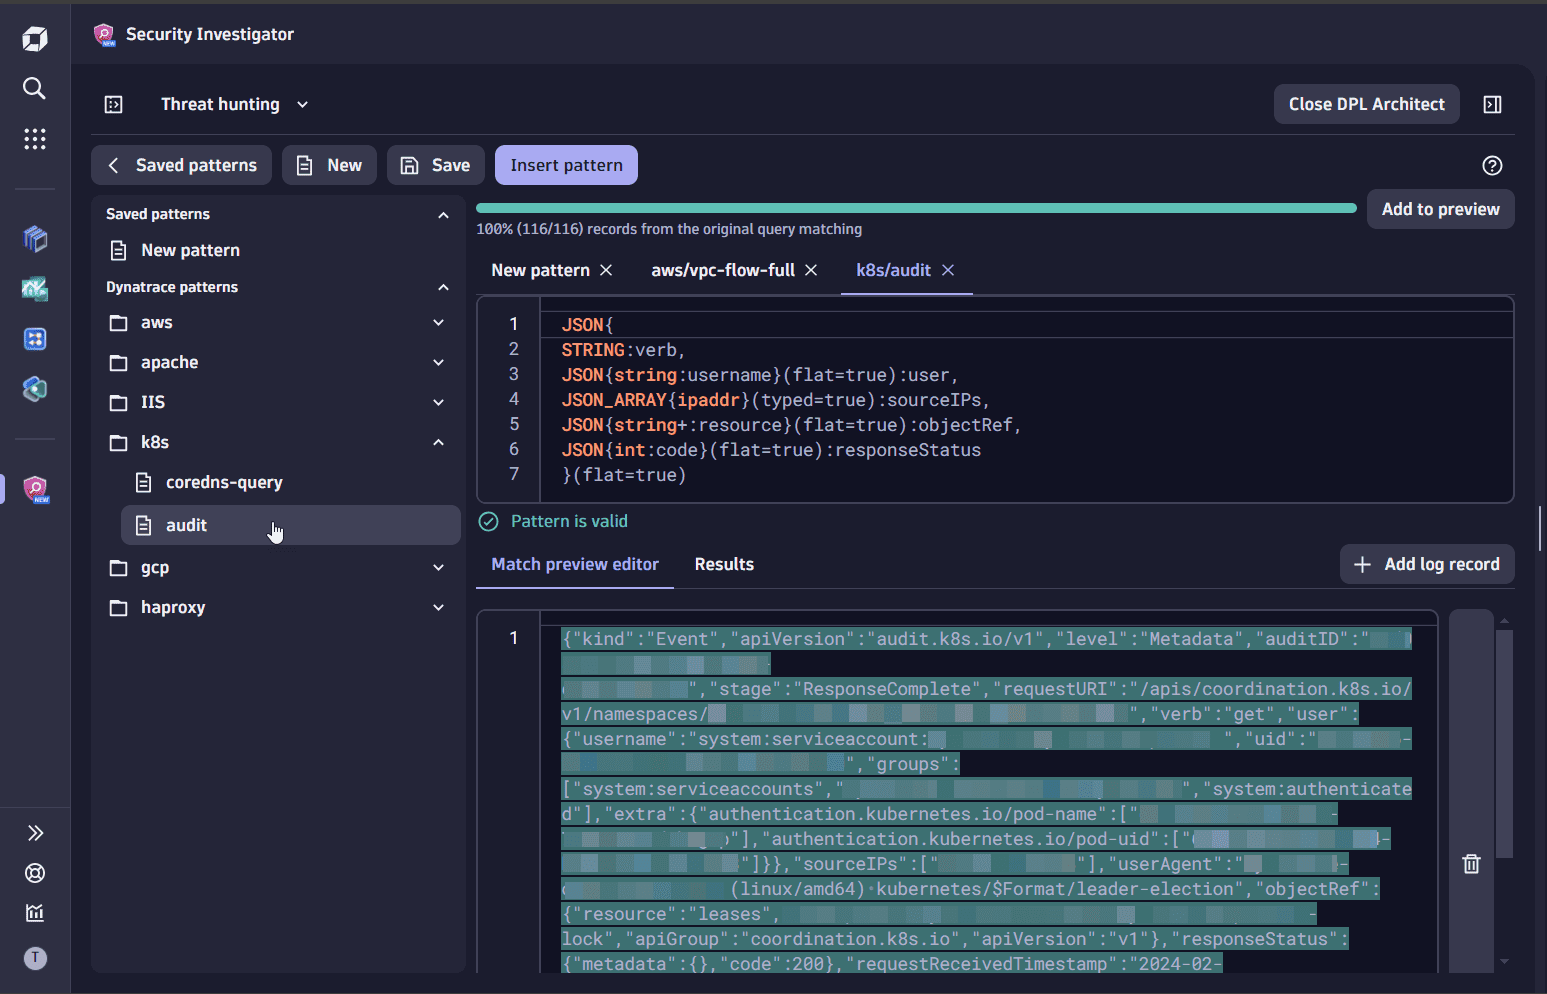
Select Saved patterns.
-
In Dynatrace patterns, select k8s > audit.
 extract field
When extracting fields from a JSON structure, you can define only a partial schema for the fields that are relevant for your use case. To continue your investigation, you need to select only the relevant fields.
-
In the query input of DPL Architect, replace the pattern as follows:
JSON{STRING:verb,JSON{string:username}(flat=true):user,JSON_ARRAY{ipaddr}(typed=true):sourceIPs,JSON{string+:resource}(flat=true):objectRef,JSON{int:code}(flat=true):responseStatus}(flat=true) -
Select Results for an overview of the fields that will be extracted from the match preview dataset.
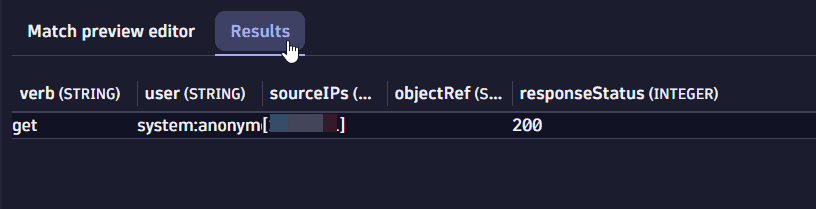 display results
 -
Select Insert pattern to append the pattern to your DQL query.
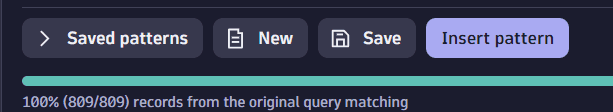 Insert pattern in DPL Architect
 -
Select Run to execute the query.
6. Filter events
To find out which IPs have unauthorized activity, you need to
-
In the query input, add the following DQL snippet, then select Run to execute the query.
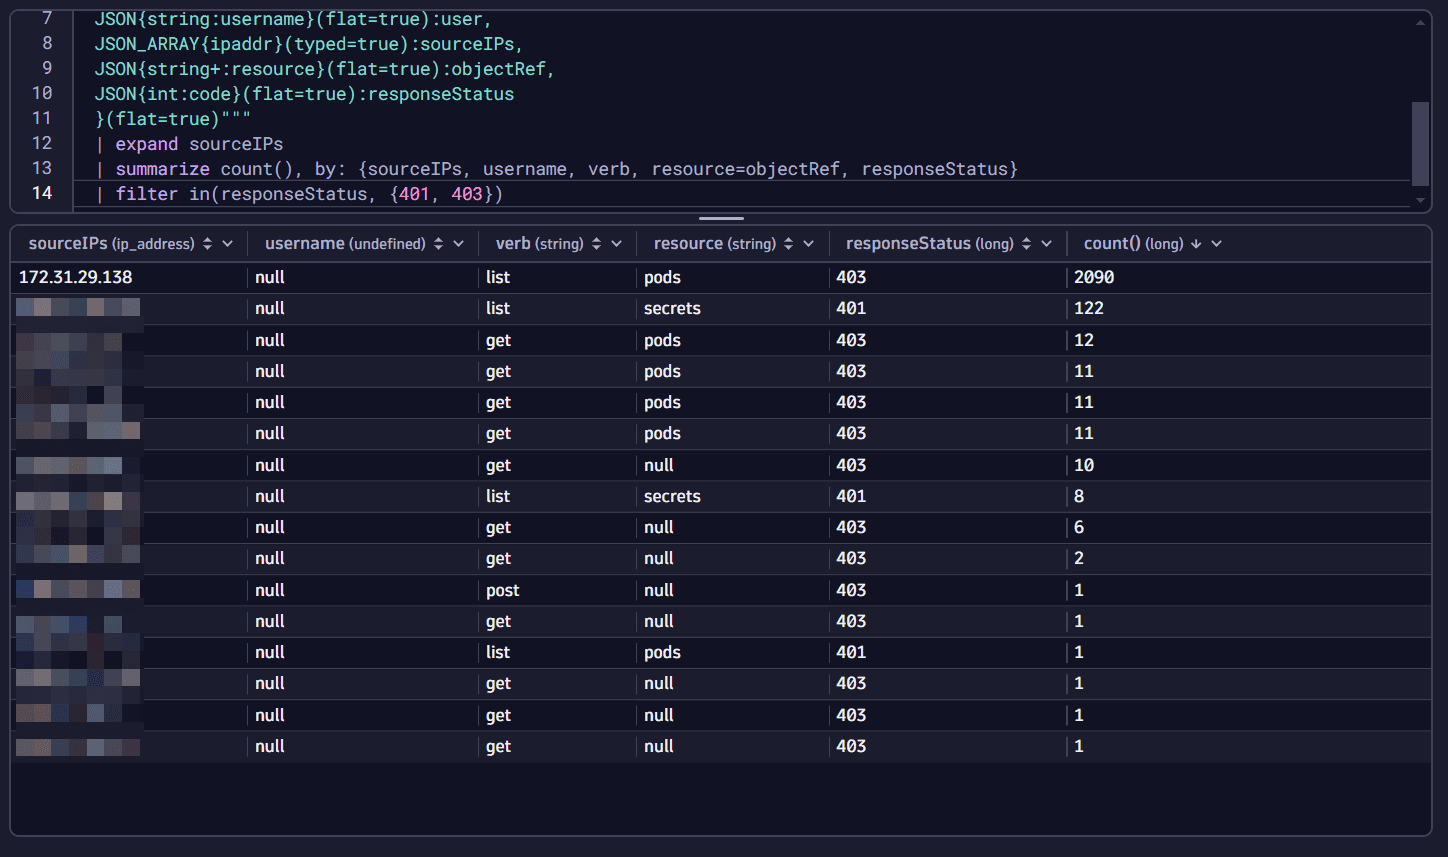
| expand sourceIPs| summarize count(), by: {sourceIPs, username, verb, resource=objectRef, responseStatus}| filter in(responseStatus, {401, 403}) -
In the results table menu, sort results by count to see which IP addresses had the most connections.
 filter the relevant events
It looks like you found the origin of your security notification:
- An unauthorized external IP address is trying to fetch secrets from your control plane (in our example,
198.51.100.2, with401response code and 122 connections). This is not surprising, since security scanners are attempting this daily from the internet. - A private IP address is trying to enumerate pods repeatedly (in our example,
172.31.29.138, with403response code and 2090 connections). It seems to be one of the pods in your Kubernetes cluster, and such behavior might indicate a compromised pod!
7. Add IPs as evidence
Both IP addresses need to be analyzed further, but the one with a 403 response and 2090 attempts is more critical and requires special attention.
To save the IPs as evidence, you can add the first IP (198.51.100.2) to a preset evidence list and the second one (172.31.29.138) to a new customized evidence list:
-
Right-click on
198.51.100.2, then select Add to evidence list > Suspicious IPs. -
Right-click on
172.31.29.138, select Add to evidence list > New evidence list and enter a name, for example, "Suspicious pod".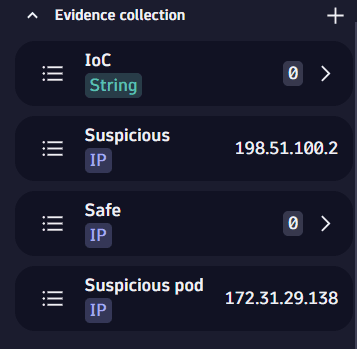 add to IP collections
Investigation path 2: Investigate potential target
To understand what the pod did and which other service logs you need for your investigation, you can start with the network logs. For AWS, the best place to start is the VPC network flow logs.
1. Fetch VPC flow logs
-
Using the query tree created during your investigation, navigate to the Fetch Kubernetes cluster audit logs step.
-
In the query results, find the record with the log group that contains your VPC flow logs (in our example,
/aws/vpc/unguard-secla-demo/vpc-flow-logs), and add it as a filter to the DQL query.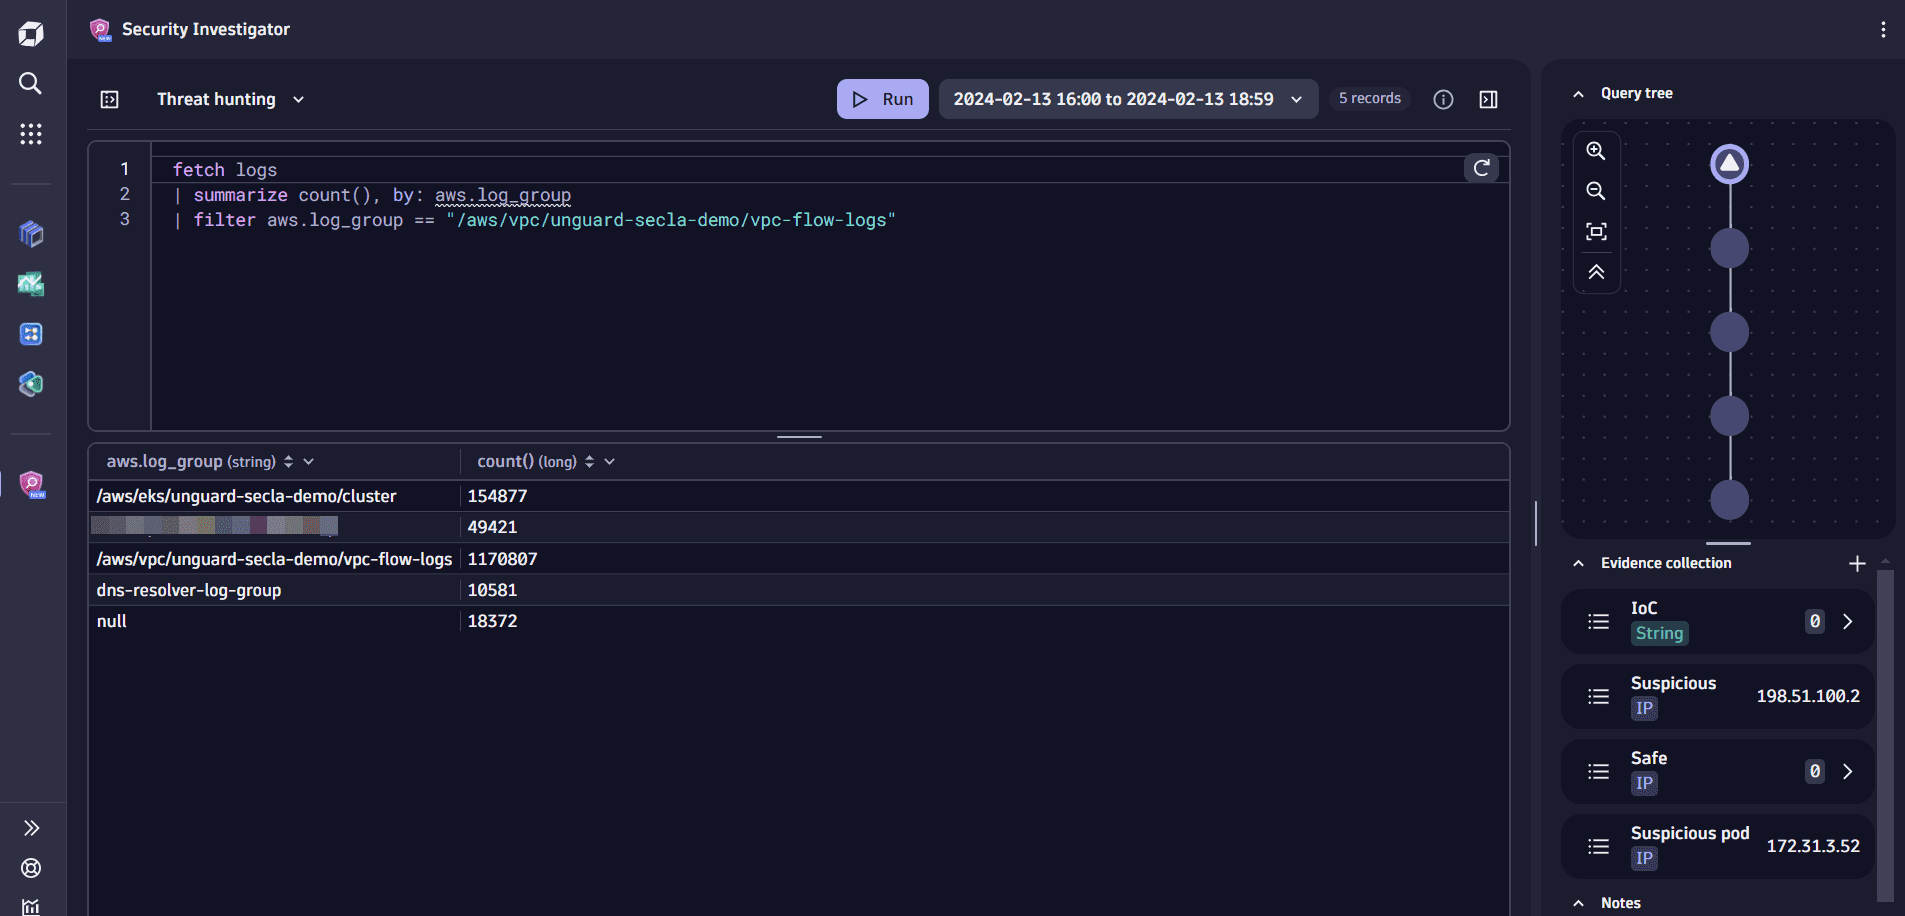 VPC flow logs
The node in the query tree has changed its icon, which means you’re in the middle of editing the query. You can either revert to the original query to update the results table or execute the modified query. When you run the modified query, a new node is created with the respective query and its results. You can give the node a distinctive name and color to recognize it later.
-
In the query input, remove the
summarizecommand, then select Run to execute the modified query.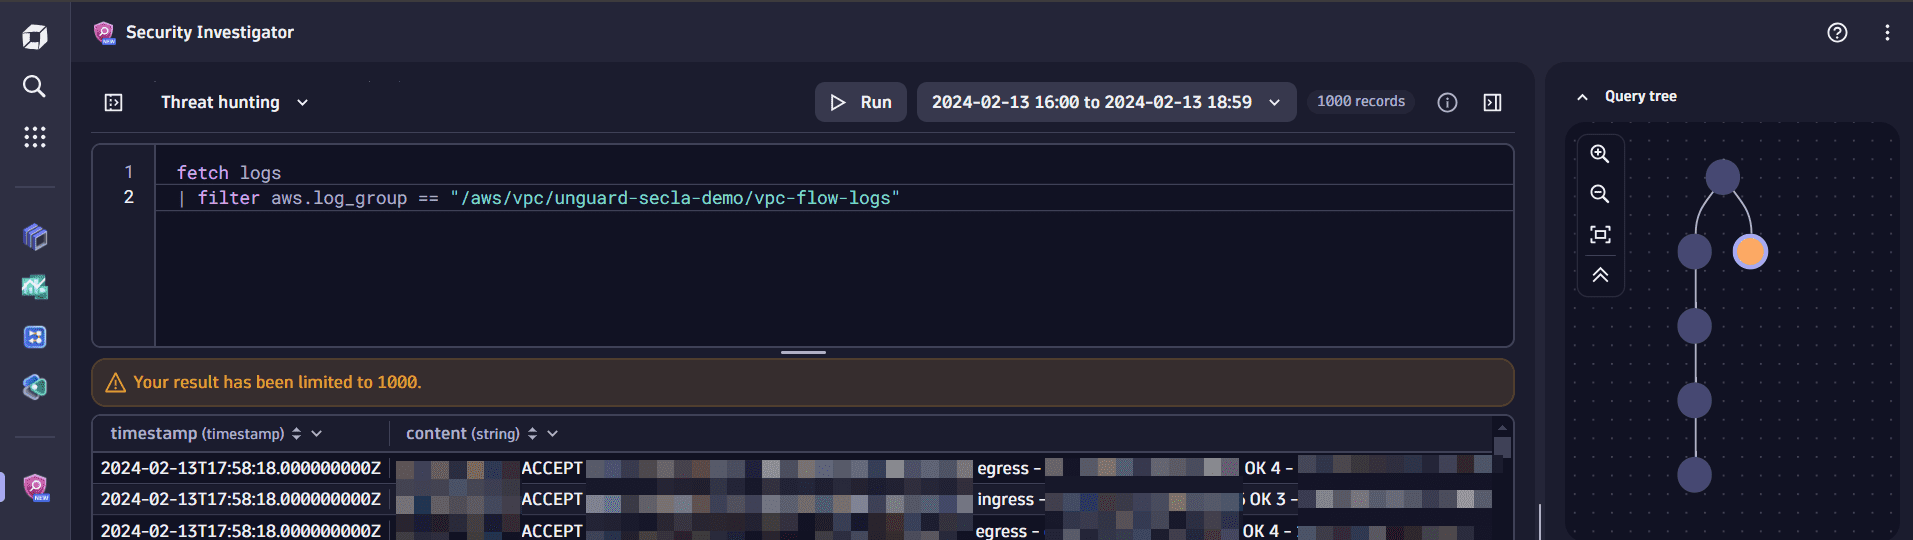 execute modified query
This creates a second branch in the query tree. A branch is the visual representation of an investigation path. Let's see where this new path takes us.
2. Extract fields
For more accurate results, you need to extract fields from the log records with DPL Architect.
- In the query results table, right-click on any cell in the content field and select Extract fields.
- In DPL Architect, select Saved patterns.
- In Dynatrace patterns, select aws > vpc-flow-full.
- Select Insert pattern.
- Select Run to execute the query.
3. Filter results
Since you’re interested only in the results from the suspicious pod, you can add a filter to your DQL query based on the evidence created in the Add evidence for later use step.
-
Go to Evidence lists and select the evidence menu for the
Suspicious podlist to see the filtering options and the suitable field names that match theIPADDRtype. -
Select Filter for > Filter within field
pkt_srcaddr. This appends the filter to your DQL query.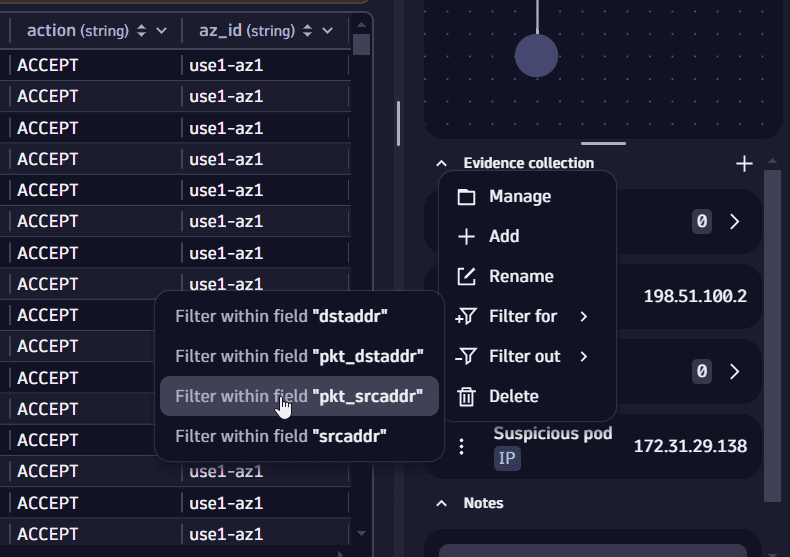 Filter by evidence
 -
To get a better overview about the network connections, append the following command to the DQL query in the query input:
| summarize count(), by: { pkt_dstaddr, protocol, action, dstport}| sort `count()` desc -
Select Run to execute the query.
You can see that the suspicious pod has most often connected to the cluster's DNS service via UDP port 53.
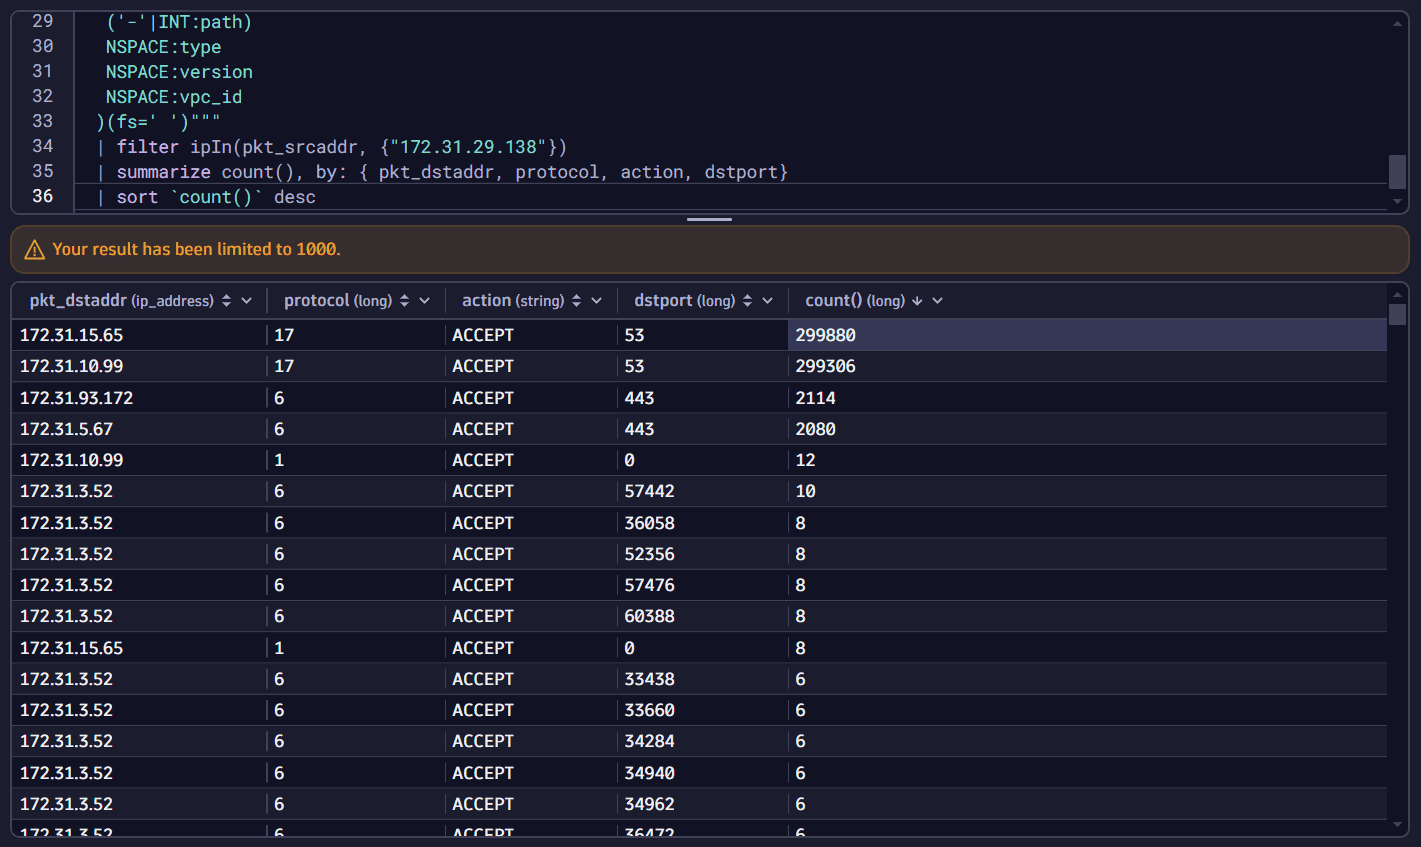
There could be an application misconfiguration or something suspicious might be happening with that pod.
Investigation path 3: Identify what data the pod sent out
To look for the DNS names resolved by a pod you need to check the CoreDNS logs. If configured properly, the query logs are visible in the CoreDNS container logs.
1. Fetch coreDNS logs
-
To fetch CoreDNS container logs, navigate to the Fetch Kubernetes cluster audit logs step and modify the query in the query input as follows:
fetch logs| filter k8s.container.name == "coredns" -
Select Run to execute the query. This creates a third branch in the query tree.
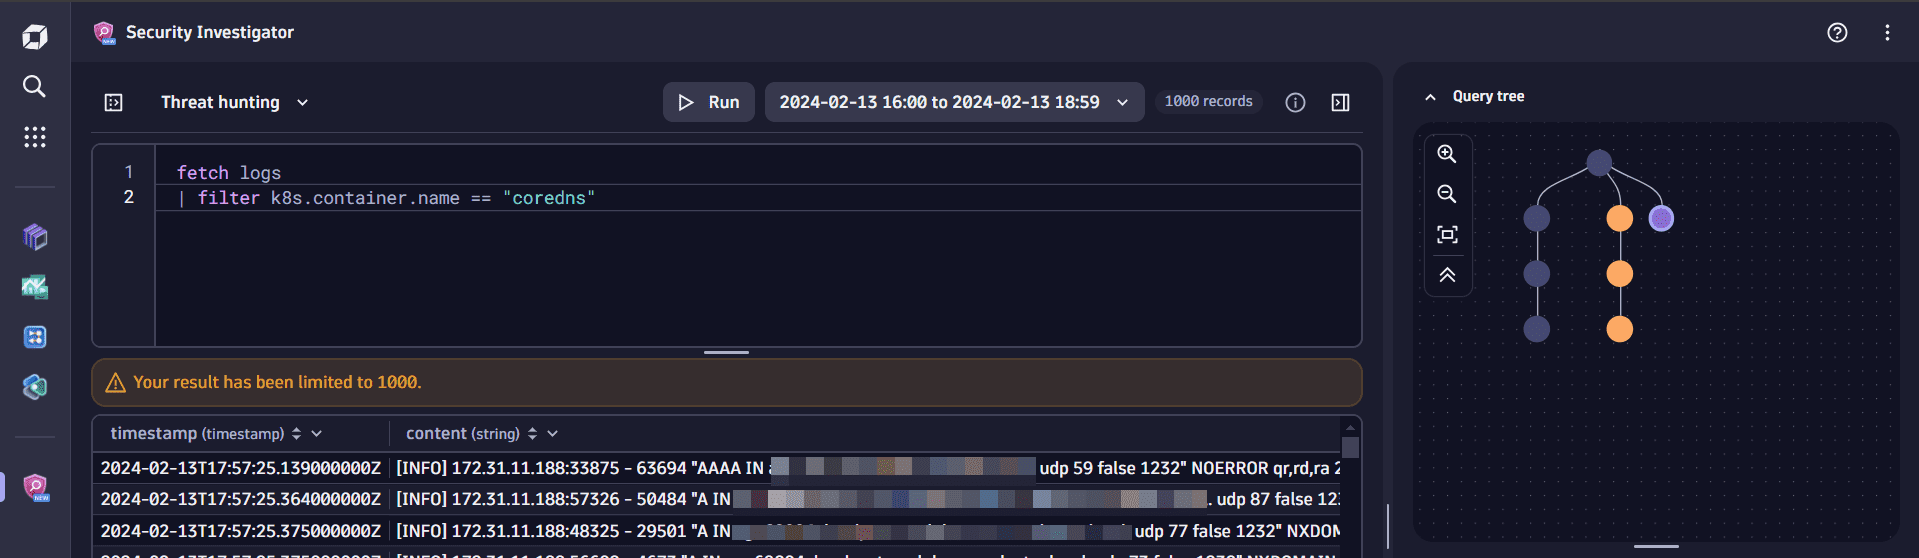 Fetch coreDNS logs
2. Extract fields
- In the query results table, right-click on any cell in the content field and select Extract fields.
- In DPL Architect, select Saved patterns.
- In Dynatrace patterns, select k8s > coredns-query.
- Select Insert pattern.
- Select Run to execute the query.
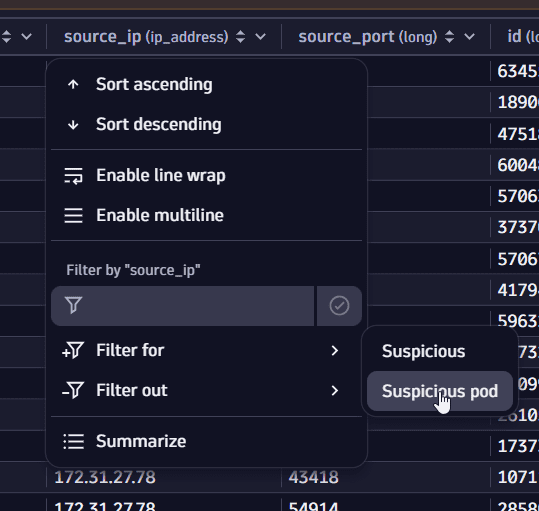
3. Filter results
To view only records containing the DNS requests originating from your suspicious pod, select the source_ip column header, then select Filter for > Suspicious pod.
4. Extract domain name
There could be quite a lot of DNS requests in the results table. For a better understanding of the resolved hostnames, you need to extract the domain name portion from the name field and summarize results based on it.
-
In the query input, add the following snippet to the DQL query:
| parse name, "ld* '.'? ( (ld '.' ld):domain '.' eos)"| summarize count = count(), by: {domain} -
Select Run to execute the query.
You notice that, besides internal or local domains, one suspicious domain (
tiitha-maliciousdomain.com) is being resolved quite a lot!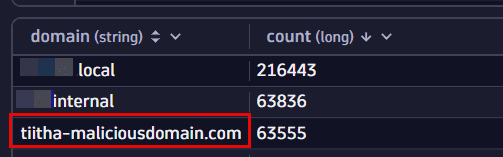 suspicious domain identified
5. Add domain as evidence
-
In the query results table, right-click on the suspicious domain name, then select Add to evidence list > New evidence list.
-
Enter a name for your new evidence list, for example, Attacker domain.
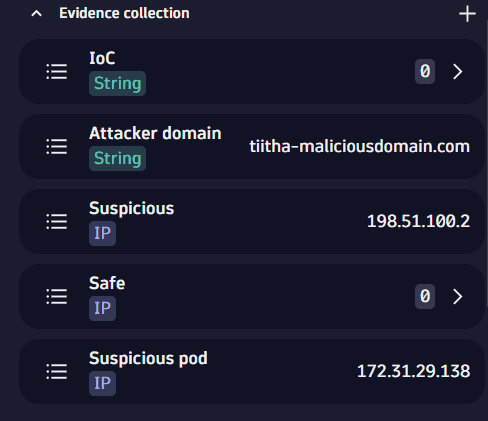 Add attacker domain as evidence
6. Filter by attacker domain
-
In the query results table, select the cell with the suspicious domain, then select Filter for to add a filter to the query that fetches only requests that include the attacker domain.
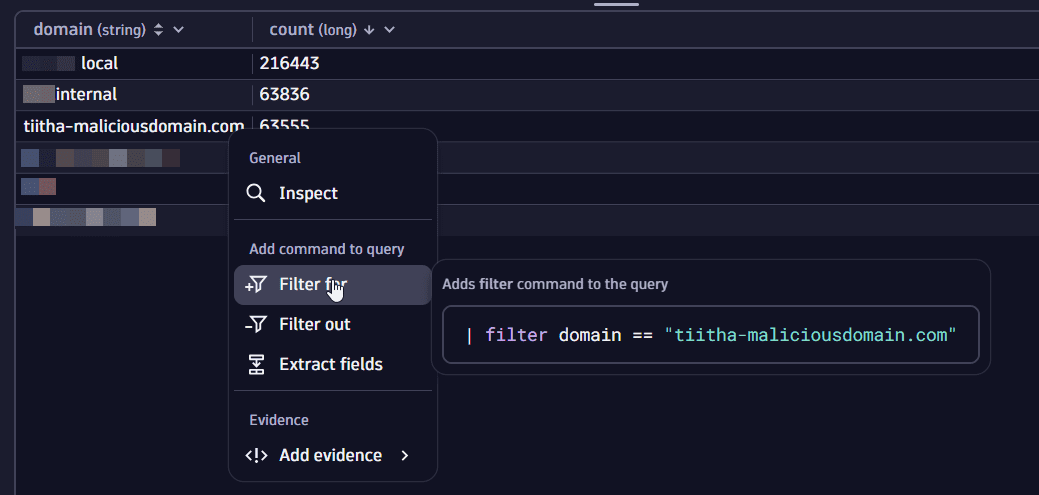 Filter for the malicious domain
 -
In the query input, remove the
summarizecommand and select Run to execute the query.It looks like there's some kind of data movement between the suspicious pod and the attacker domain. Looking at the query names and considering the number of queries, data appears to be extracted via DNS tunneling.
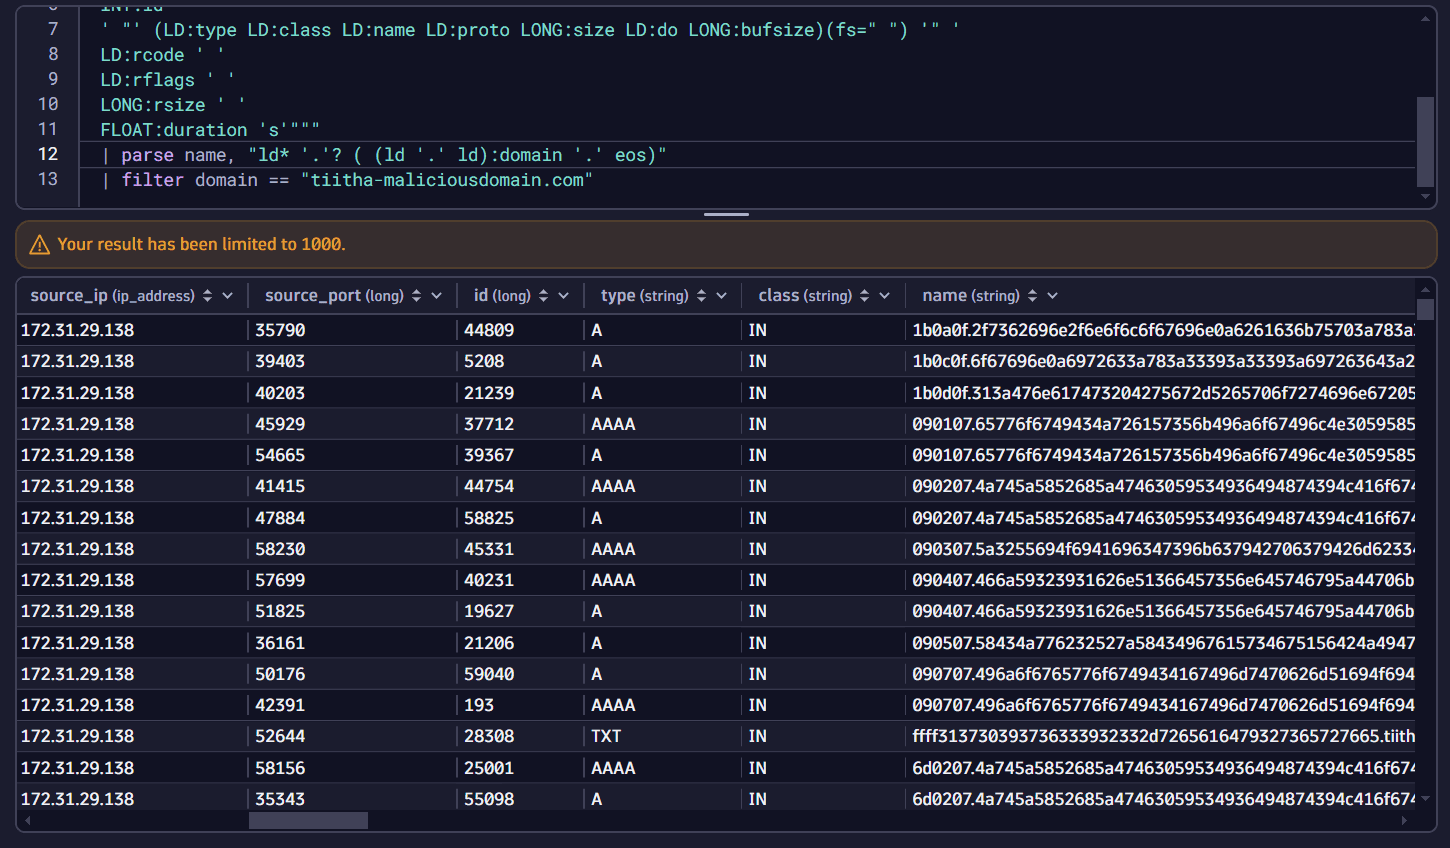 data is being extracted via DNS tunnelling
7. Analyze DNS requests
As there are thousands of DNS requests towards that particular domain, you may want to aggregate the data to determine how to proceed further.
-
In the query results, select the type column header, then select Summarize.
-
Select Run to execute the query.
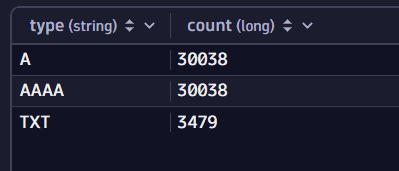 Summarize by type
You notice many A, AAAA, and TXT requests from the pod. You start investigating the A requests.
-
In the query results table, right-click on an A cell and select Filter for to add a filter to the DQL query.
-
In the query input, remove the
summarizecommand and select Run to execute the query.To determine what is being sent out, you need to extract the subdomain portion of the domain. For this, you need to analyze one of the DNS queries that is resolving the attacker domain.
-
Double-click on any cell in the query results table.
-
In the Details (…) window, check the data in the name field.
It seems that the DNS name is structured by an ID followed by the payload portion encoded in hex, and these parts are delimited by
..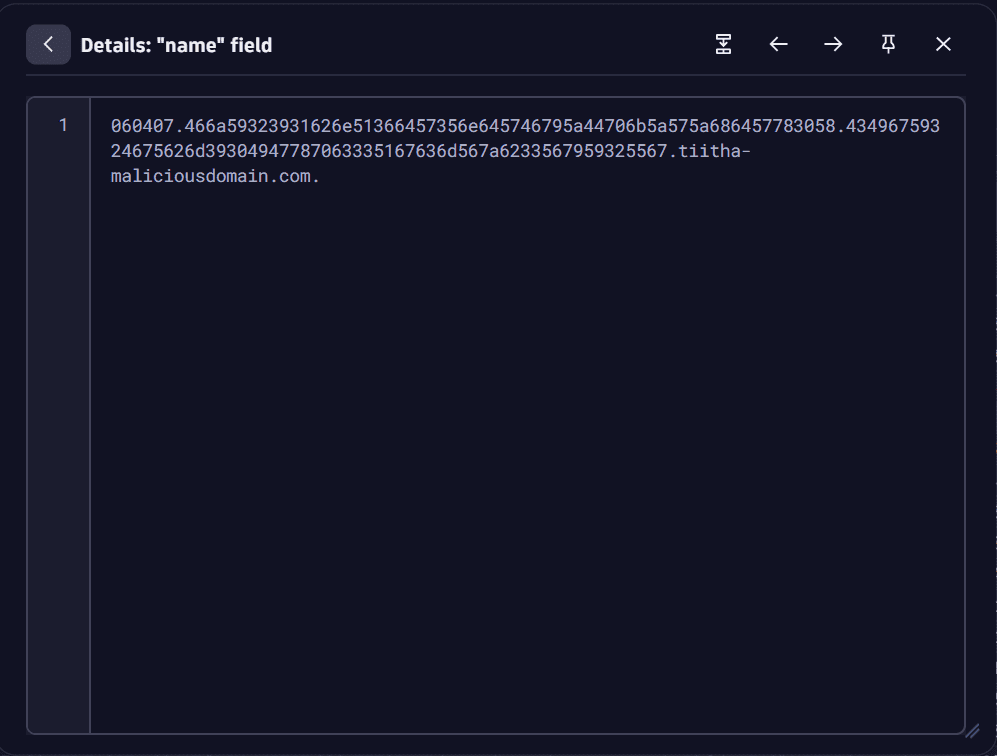 Inspect the name
 -
To parse and decode the payload, add the following DQL snippet to the DQL query:
| parse name, """ld:id '.' ld:payload '.tiitha-maliciousdomain'"""| fieldsAdd payload=replaceString(payload,".","")| fields timestamp, id, payload=decodeBase16ToString(payload)| sort timestamp, idThe result proves that data from your pod is definitely being extracted and sent out!
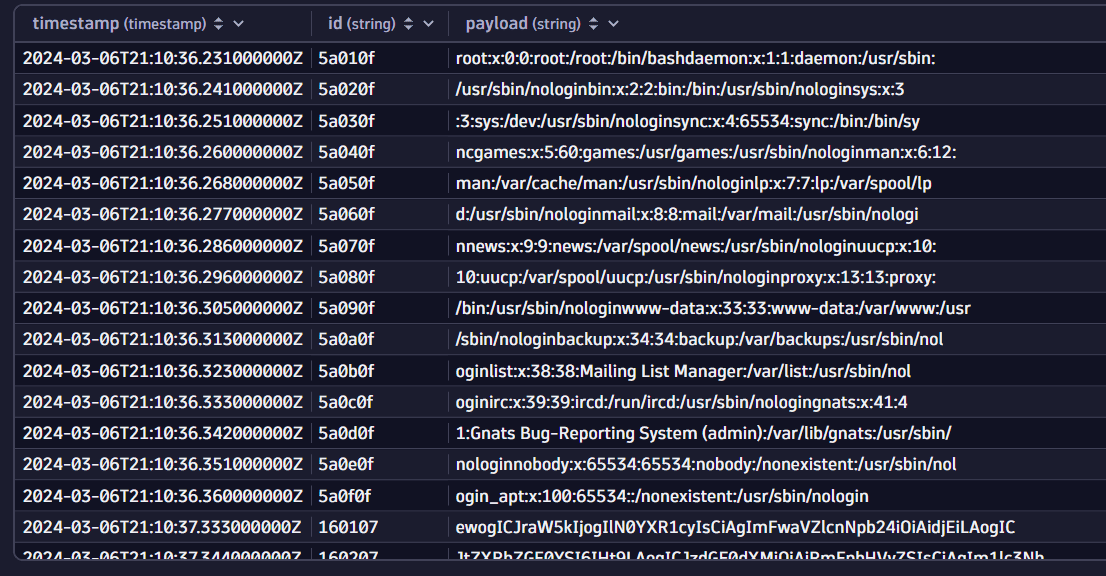 data from pod is extracted and sent out
Investigation path 4: Find out how the commands were sent to the pod
You know for sure the pod is sending information to an external DNS server, but you haven’t figured out how it gets the commands. Since TXT-type DNS queries enable larger responses and are sometimes used for malicious transactions as well, you need to take a look at those requests. Since CoreDNS records don't contain the response payload, you turn to Route53 logs.
1. Analyze TXT records
-
Using the query tree, navigate to the Fetch Kubernetes cluster audit logs step.
-
In the query results, find the record with your Route53 log group (in our example,
/aws/route53/unguard-secla-demo/resolver-logs) and add it as a filter to your DQL query. -
In the query input, remove the
summarizecommand and select Run to execute the query. This creates a fourth branch in the query tree.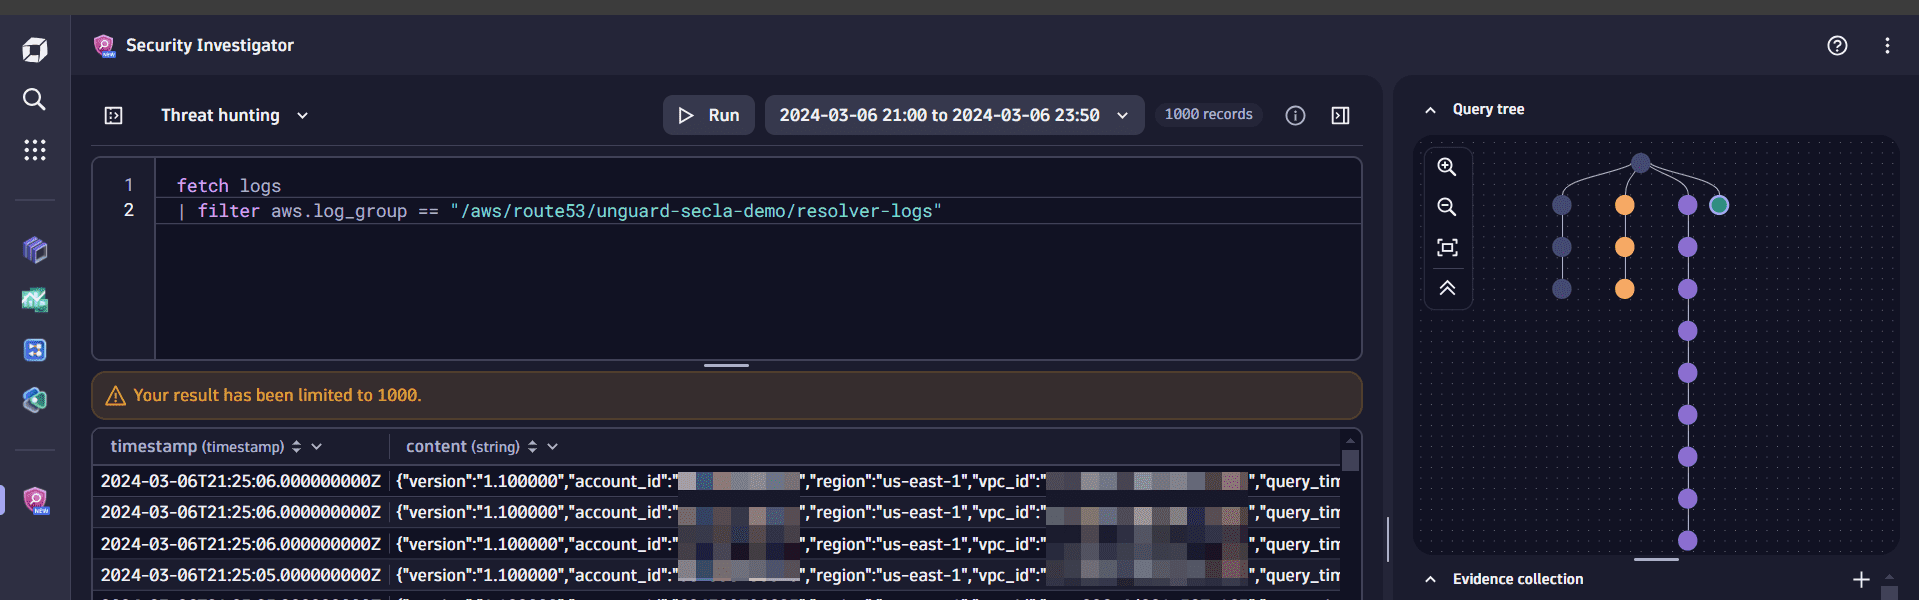 Analyze TXT records
2. Extract fields from log records
-
In the query results table, right-click on any cell in the content field and select Extract fields.
-
In DPL Architect, select Saved patterns.
-
In Dynatrace patterns, select aws > route53-query.
-
You need to extract the
query_name,query_type,srcaddr, andanswersvalues from the log record. In the query input, you can replace the pattern as follows:json{string:query_name,string:query_type,json_array:answers,ipaddr:srcaddr}(flat=true) -
Select Insert pattern.
-
Select Run to execute the query.
3. Filter data
-
In the query results, select the
query_namecolumn header, then select Filter for > Attacker domain. -
Select Run to execute the query.
You only care about the queries with the TXT type, so you can append the filter with the appropriate expression. Since the answers portion is an array, expand the field so that each value in the array is a separate record. The only fields you need are
srcaddr,query_name, and theRdataelement from the answer object. -
In the query input, modify the
filtercommand by adding the following snippet:| filter endsWith(query_name, "tiitha-maliciousdomain.com.") and query_type == "TXT"| expand answers| fields srcaddr, uery_name, answer=answers[Rdata] -
Select Run to execute the query.
Your hypothesis is correct: the TXT DNS queries were used to fetch the commands. The executed commands (including the Kubernetes control plane requests as curl commands) show up as responses in your DNS logs!
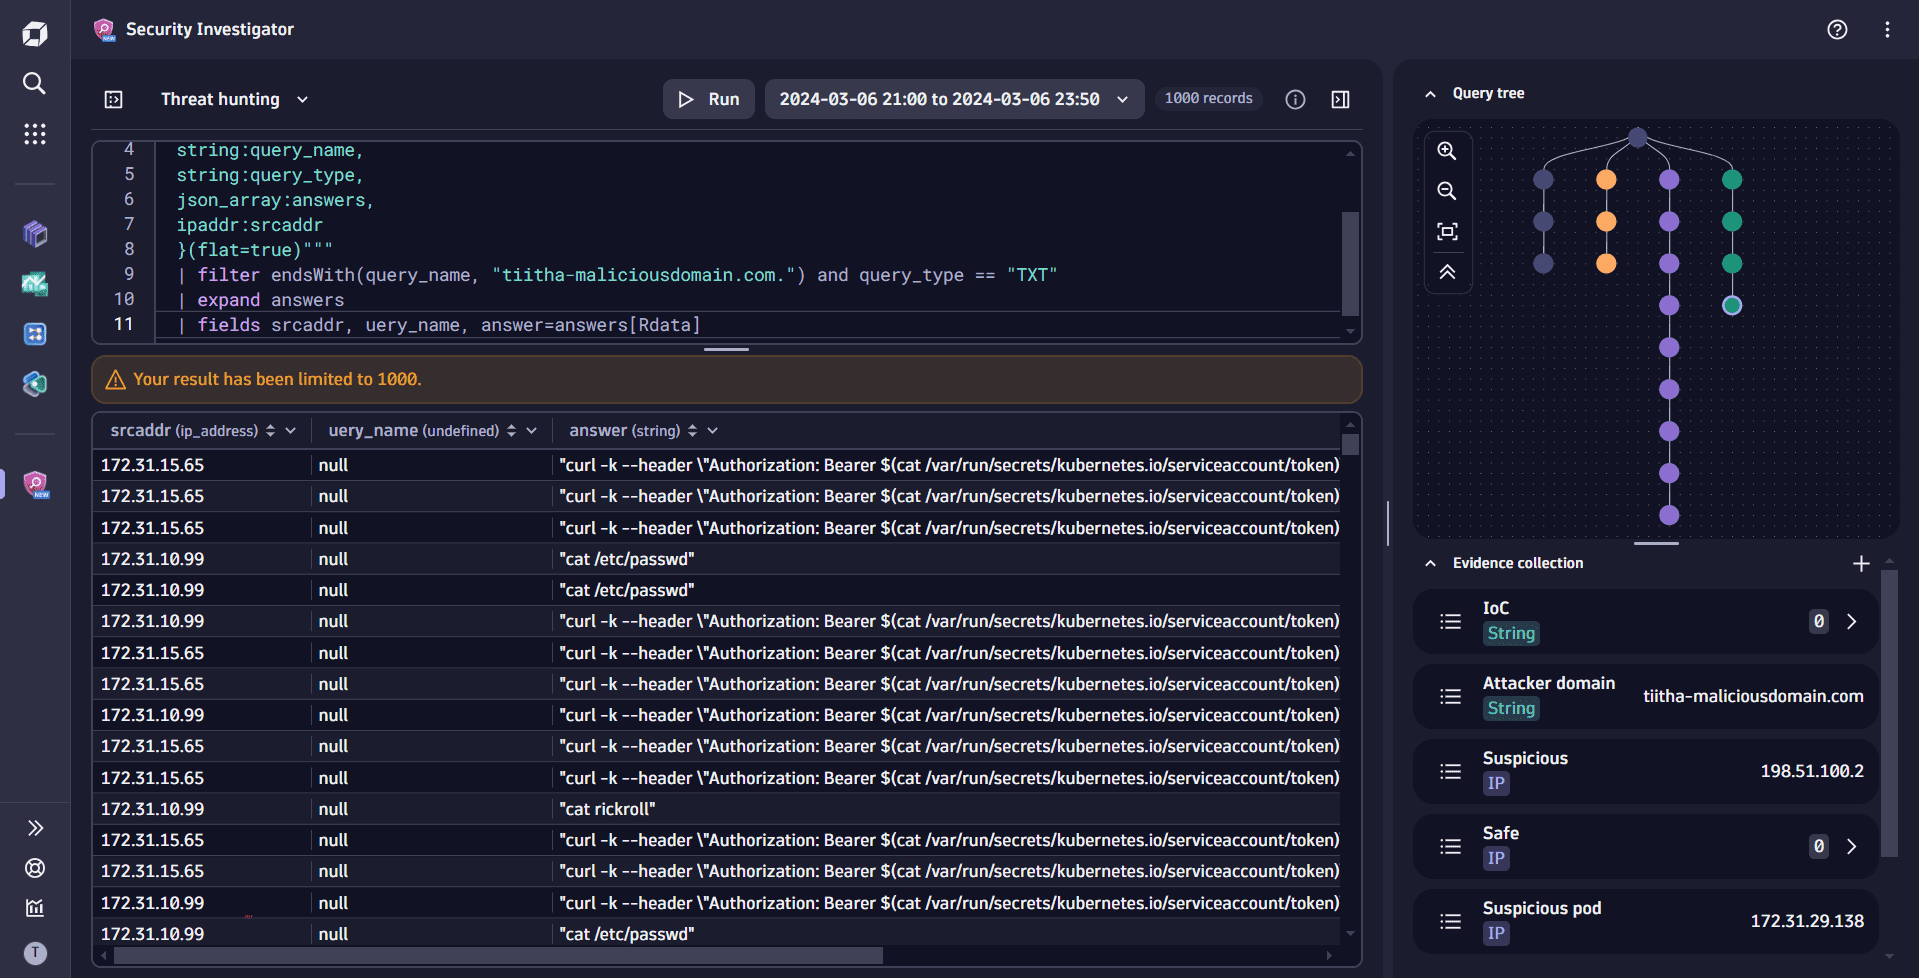 Correct hypothesis: TXT DNS queries were used to fetch the commands
Conclusion
You've found out what happened but haven't figured out what else the pod has done, what process or activity is triggering the DNS requests, who controls the data extraction, how and when the pod was infected, and other relevant aspects of a security incident.
From here on, the complexity of the investigation will only grow, and the ability to navigate between different stages of an investigation is even more crucial. All these questions might trigger a new branch in the query tree, if not a separate investigation. Our investigation introduces many additional questions that require answers.