Analyze Amazon API Gateway access logs with Investigations
- Latest Dynatrace
- Tutorial
- Published Jan 29, 2025
Amazon API Gateway is a powerful service that enables you to build serverless web APIs using Lambda functions or to add "bolt-on security" for existing services. It can range from straightforward actions such as applying TLS encryption or caching to more advanced measures such as Access control, API throttling, or security logging. API Gateway provides an extra layer of security that can be applied to your services quickly without modifying your underlying code.
In the following, you'll learn how  Investigations can help you monitor and identify errors in your Amazon API Gateway access logs.
Target audience
This article is intended for security engineers and site reliability engineers who are involved in maintaining and securing cloud applications in AWS. It shows you how to make the most of the Amazon API Gateway logs ingested to Dynatrace to detect security issues.
Prerequisites
-
Create an Amazon CloudWatch log group for the Amazon API Gateway access logs
-
Set up Amazon Data Firehose for the log group to send the logs to Dynatrace
-
Knowledge of
Before you begin
Enable logging and ensure that the logs are saved to the CloudWatch log group (in this example, /aws/apigateway/my-gateway-demo) and sent to your Dynatrace environment.
1. Enable Amazon API Gateway logging
-
In AWS, go to the API Gateway service page.
-
Select your API Gateway API from the API list.
In this example, an HTTP API has been used (API Gateway supports multiple API types and logging configurations are different for each of them).
-
In the sidebar menu, select Monitor > Logging.
-
Select Choose a stage to configure logging, then select Edit.
-
Turn on Access logging.
-
For Log destination, enter the ARN of the
/aws/apigateway/my-gateway-demolog group. -
For Log format, select
JSONto simplify log record parsing. -
In Additional fields, customize the log format, then select Save.
For a list of available fields, see Customize HTTP API access logs.
This example uses the following log format:
{"requestId": "$context.requestId","ip": "$context.identity.sourceIp","requestTime": "$context.requestTime","httpMethod": "$context.httpMethod","routeKey": "$context.routeKey","path": "$context.path","status": "$context.status","protocol": "$context.protocol","responseLength": "$context.responseLength","responseLatency": "$context.responseLatency","integrationLatency": "$context.integrationLatency","integrationStatus": "$context.integrationStatus","errorMessage": "$context.error.message","integrationErrorMessage": "$context.integrationErrorMessage"}
2. Verify that the API Gateway requests are logged
-
In Dynatrace, open
Investigations and select Investigation to create a new investigation scenario. -
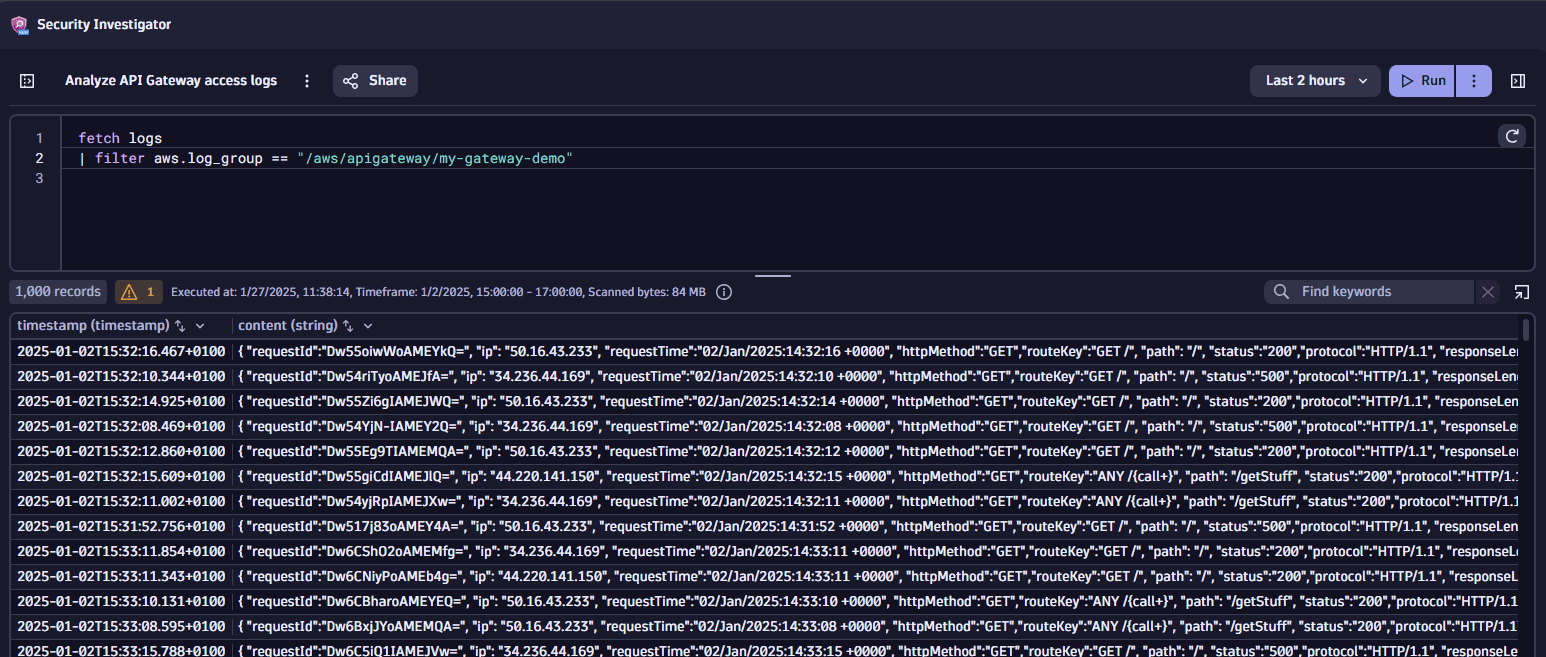
To verify that the logs from the Amazon CloudWatch log group are reaching your Dynatrace environment, run the following query:
fetch logs| filter aws.log_group == "/aws/apigateway/my-gateway-demo"Example result:
 fetch logs
If no logs are displayed, check your CloudWatch subscription filter and Data Firehose settings (including performance metrics, tenant and buffer settings).
Get started
Analyze your Amazon API Gateway logs with Investigations.
1. Discover backend issues using latency metrics
1. How to decide which metrics to use
API Gateway logs contain a lot of helpful information that can be used to debug your backend applications. One standard metric to monitor from an API Gateway is latency. Two types of latencies can be monitored from API Gateway logs:
-
Integration latency: The time between when API Gateway relays a request to the backend and when it receives a response from the backend.
-
Response latency: The time between when API Gateway receives a request from a client and when it returns a response to the client. It includes the integration latency and other API Gateway overhead.
Deciding which metric to use for performance monitoring depends on your use case. Since this example focuses on the backend performance, not the whole request cycle, the integration latency will be used.
Follow the steps below to analyze and discover the services with the highest latency.
-
Fetch your API Gateway logs from Grail:
fetch logs| filter aws.log_group == "/aws/apigateway/my-gateway-demo" -
In the query results table, right-click on a field and select View field details to view the log record in the original format.
Example JSON-formatted log record:
{"requestId": "Dzfa6gNrrks42Tw=","ip": "14.21.74.45","requestTime": "03/Jan/2025:09:22:13 +0000","httpMethod": "GET","routeKey": "ANY /","path": "/getStuff","status": "200","protocol": "HTTP/1.1","responseLength": "33","responseLatency": "1671","integrationLatency": "1665","integrationStatus": "200","errorMessage": "-","integrationErrorMessage": "-"} -
Add the following parse command to the DQL query to extract the
pathandintegrationLatencyproperties from the JSON record.| parse content, "JSON{ STRING:path, INT:integrationLatency }(flat=true)"This example uses Dynatrace Pattern Language and the JSON matcher to extract selected matchers to separate fields.
DPL pattern used:
JSON{STRING:path,INT:integrationLatency}(flat=true)After running the query, you can see two new columns called path and integrationLatency in the results table.
-
To simplify viewing the results, add the following
makeTimeseriescommand to the DQL query to create a metric from the API Gateway logs. The metric should have the path as a dimension and average latency per minute as the metric values.| makeTimeseries {latency = avg(integrationLatency, default:0)},by: { path },interval:1mYour DQL query should look like this:
fetch logs| filter aws.log_group == "/aws/apigateway/my-gateway-demo"| parse content, "JSON{ STRING:path, INT:integrationLatency }(flat=true)"| makeTimeseries {latency = avg(integrationLatency, default:0)}, by: { path }, interval:1mExample result viewed as a chart:
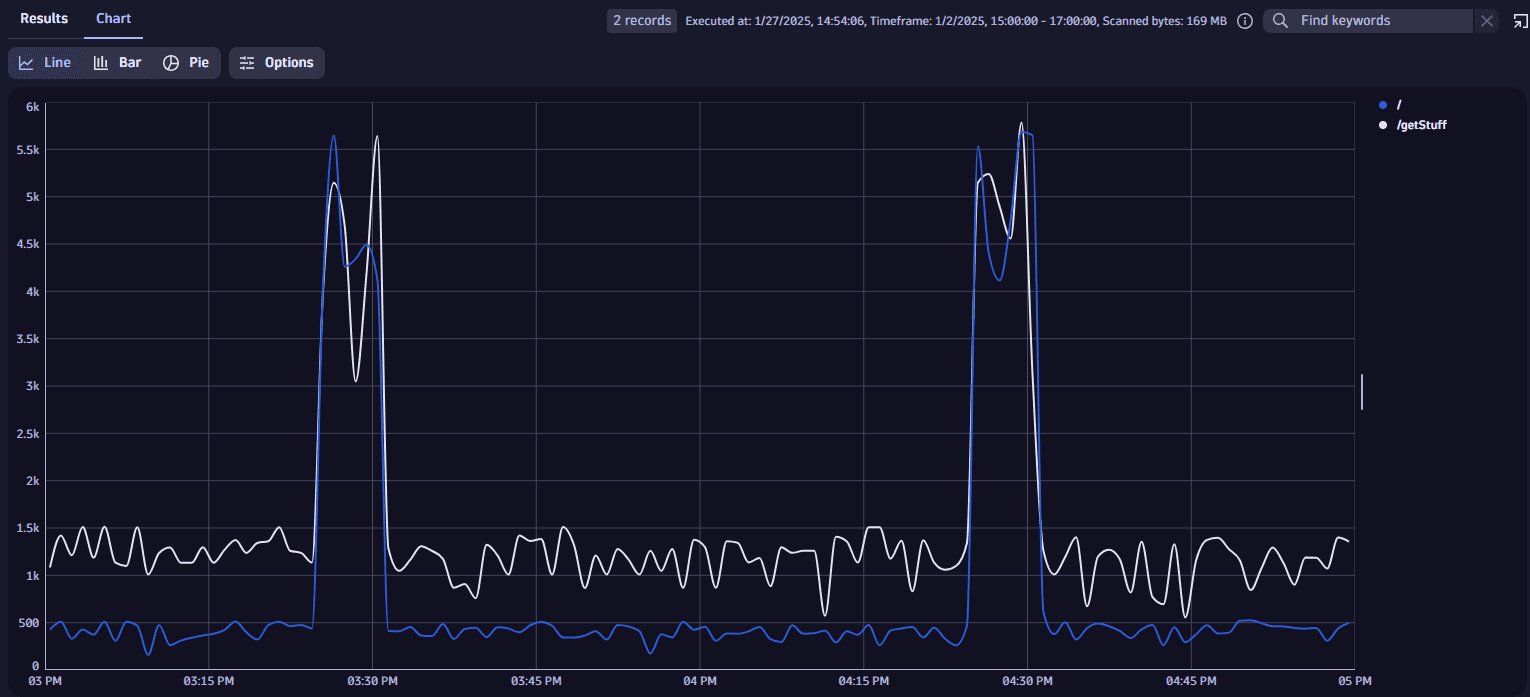 chart1
It turns out you're experiencing some periodical latency issues for both service endpoints.
2. Identify latency issues and troubleshoot response codes
Follow the steps below to dig deeper into the response codes.
-
Extract the response codes as an additional column with an INT matcher, as you're expecting to get an integer value from the field.
DPL pattern used:
JSON{ STRING:path, INT:status, INT:integrationLatency }(flat=true)You can see that the response code is called
status. -
To add the status as one of the dimensions for your metric, add the
statusfield to thebyparameter of yourmaketimeseriescommand.| makeTimeseries {latency = avg(integrationLatency, default:0)},by: { path, status },interval:1mYour DQL query should look like this:
fetch logs| filter aws.log_group == "/aws/apigateway/my-gateway-demo"| parse content, "JSON{ STRING:path, INT:status INT:integrationLatency }(flat=true)"| makeTimeseries {latency = avg(integrationLatency, default:0)}, by: { path, status }, interval:1mExample result viewed as a chart:
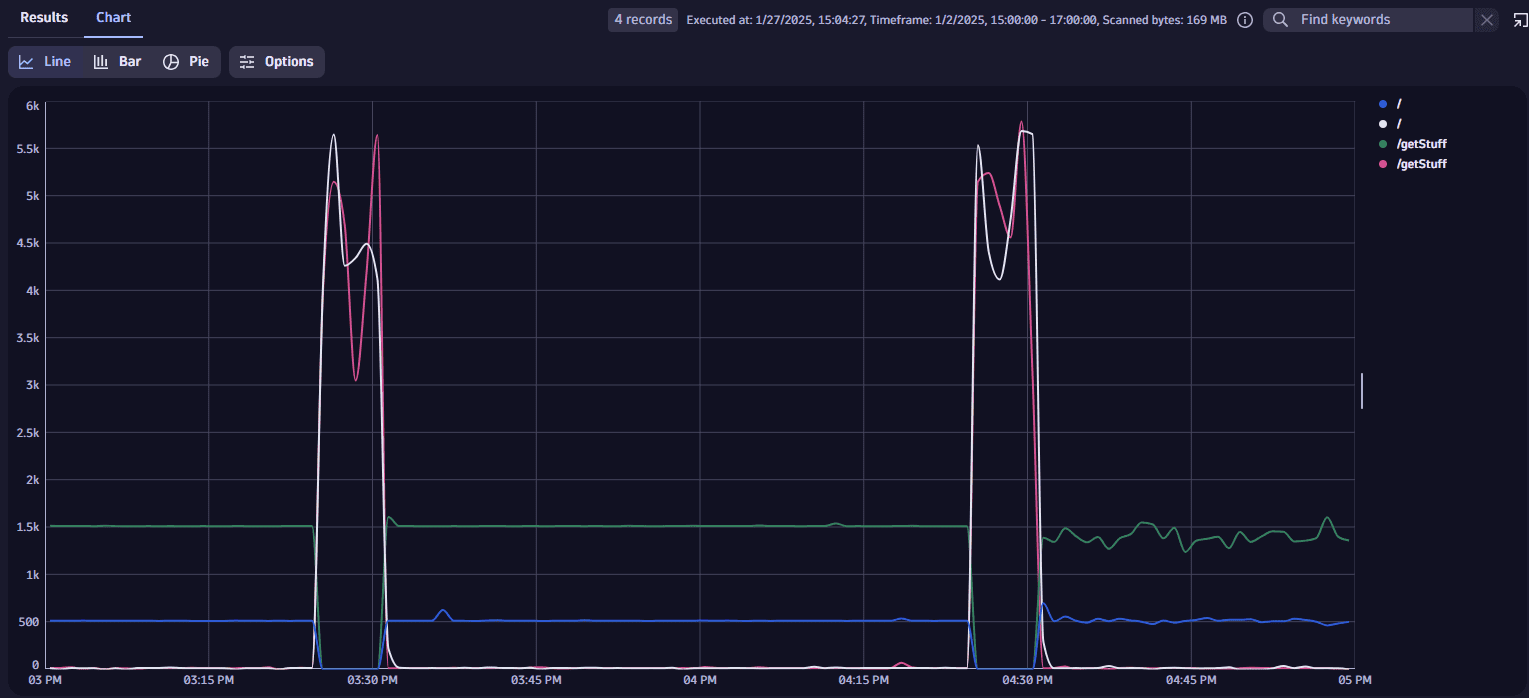 chart 2
It turns out that no successful responses are returned: requests take longer, and all responses return a "Server Error" (HTTP/500).
3. Debug integration errors
Follow the steps below to continue debugging integration errors.
-
To analyze the error messages, extract an additional integrationErrorMessage field from the log record with a string matcher.
DPL pattern used:
JSON{STRING:path,INT:status,INT:integrationLatency,STRING:integrationErrorMessage}(flat=true) -
Add the following snippet to the DQL query to aggregate the error messages and sort them by count:
| summarize count(), by: { integrationErrorMessage }| sort `count()` descYour DQL query should look like this:
fetch logs| filter aws.log_group == "/aws/apigateway/my-gateway-demo"| parse content, "JSON{ STRING:path, INT:status, INT:integrationLatency, STRING:integrationErrorMessage }(flat=true)"| summarize count(), by: { integrationErrorMessage }| sort `count()` descA distinct timeout error message stands out from results:
The Lambda function returned the following error: RequestId: 01fe3839-4974-40d5-960a-173fcb5ec786 Error: Task timed out after 5.00 seconds. Check your Lambda function code and try again. -
Extract the
Errorportion from the log record without the request ID to compare this error message with the others.DPL pattern used:
LD ': RequestId: ' UUIDSTRING ' Error: ' LD:errorYou now have two fields (error and integrationErrorMessage) that can contain the error message.
-
Add the following snippet to the DQL query to merge the two fields into one column with the
iffunction and summarize based on that.| fields error = if(isnull(error), integrationErrorMessage, else: error)| summarize count(), by: { error }Your DQL query should look like this:
fetch logs| filter aws.log_group == "/aws/apigateway/my-gateway-demo"| parse content, "JSON{ STRING:path, INT:status, INT:integrationLatency, STRING:integrationErrorMessage }(flat=true)"| parse integrationErrorMessage, "LD ': RequestId: ' UUIDSTRING ' Error: ' LD:error"| fields error = if(isnull(error), integrationErrorMessage, else: error)| summarize count(), by: { error }Example results:
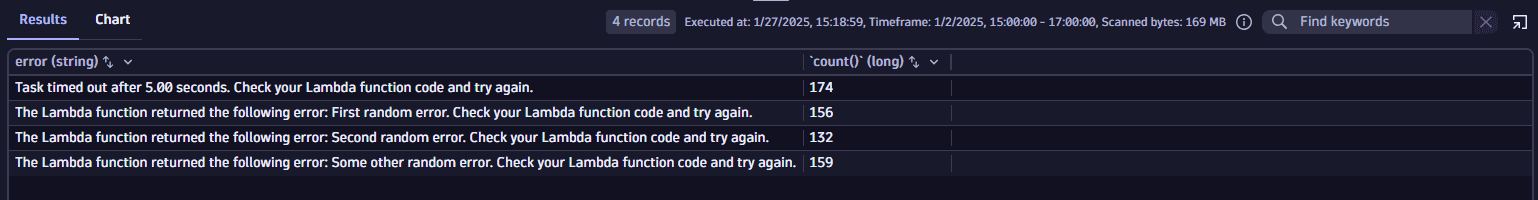 results
It turns out that timeout errors are the most frequent.
-
To see how the error messages distribute over the same period, create a metric based on the timeout errors as follows:
-
Add a
filterOutcommand to remove the successful events -
Add the
timestampfield to thefieldscommand -
Construct the
makeTimeseriescommand to aggregate errors by count in one-minute interval.Your final query should look like this:
fetch logs| filter aws.log_group == "/aws/apigateway/my-gateway-demo"| parse content, "JSON{ STRING:path, INT:status, INT:integrationLatency, STRING:integrationErrorMessage }(flat=true)"| parse integrationErrorMessage, "LD ': RequestId: ' UUIDSTRING ' Error: ' LD:error"| fields timestamp, error = if(isnull(error), integrationErrorMessage, else: error)| filterOut error == "-"| makeTimeseries count(default: 0), by: { error }, interval: 1mExample result viewed as a chart:
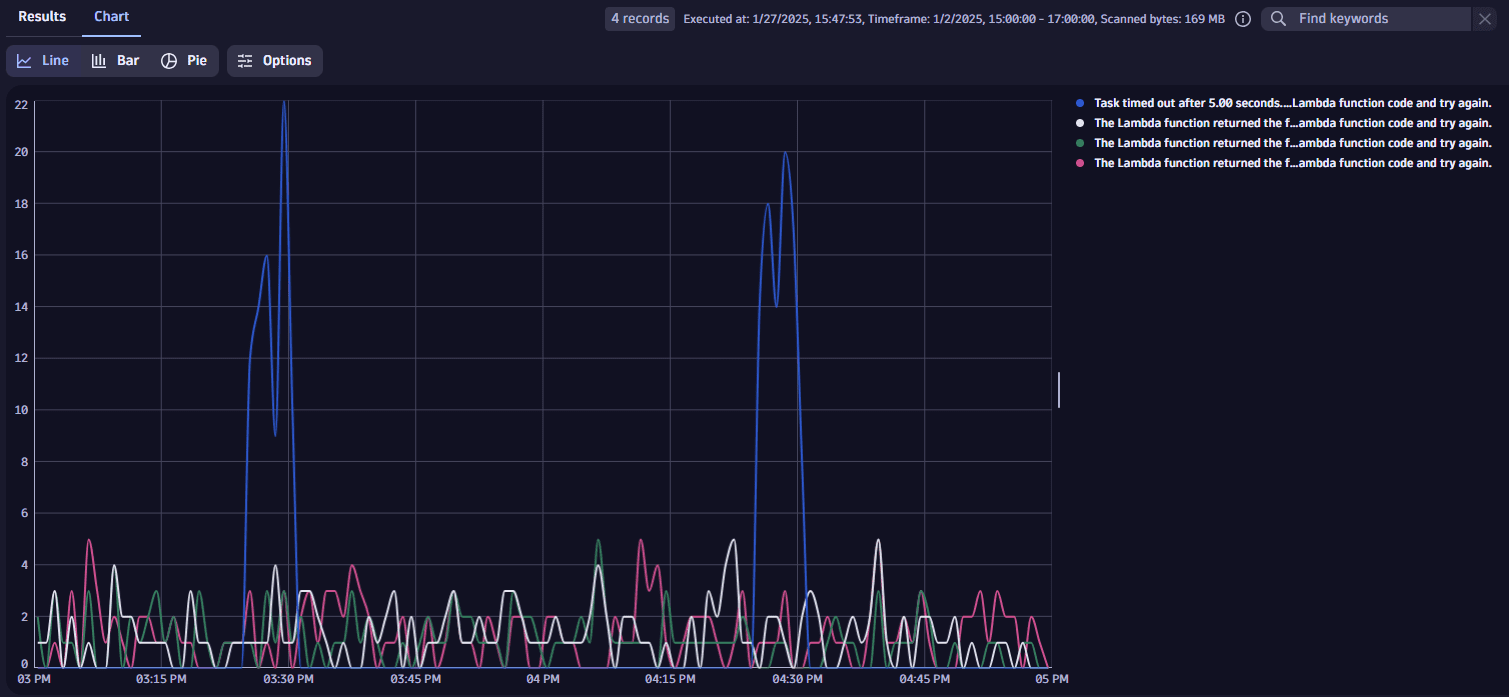 chart 3
It turns out you're experiencing Lambda timeout problems, which are creating latency and server error issues in your API Gateway logs.
To investigate this further, you'd have to look into the Lambda function and see why you're experiencing this behavior precisely at those times. It can be that certain scheduled jobs are running, resources are locked or overloaded, or some other dependencies are causing these issues.