Operationalize DQL query results with Investigations
- Latest Dynatrace
- Tutorial
- Published Mar 13, 2025
When solving incidents or performing threat hunting on data in Grail, security and DevOps engineers' results depend on their findings. They might start from the request that caused an error and work their way to the real root cause of the problem by searching for clues in the logs, events, and traces. To find those clues in Grail, they need to refine the DQL queries based on the results of the previous queries.
In the following, you'll learn how  Investigations can help you speed up your investigations by building DQL queries from your query results faster and more conveniently.
Target audience
This article is intended for security engineers and DevOps engineers who are involved in maintaining and securing their infrastructure, solving incidents, and hunting threats from logs, events, and traces.
Prerequisites
-
Make sure your application logs are ingested into Dynatrace via log ingestion or security events ingest.
-
Basic knowledge of
To follow this article, you have the following options in Dynatrace Playground:
- Create your own investigation from an existing template
- Open a shared investigation
Get started
Once you open Investigations and create an investigation, the first node created when you execute the query displays the logs from which you want to start investigating.
Filter from result table field values
The simplest way to create a filter is to right-click on a field value and select Filter. In the next two examples (Filter by a single value and Filter by multiple values) we'll filter for IP addresses. Still, you can use the same approach for any other data types.
In Playground, field value filters are displayed in the query tree as mint nodes.
Filter by a single value
To display only events from a single IP address, right-click on an IP address in the src_ip field of the results table and select Filter.
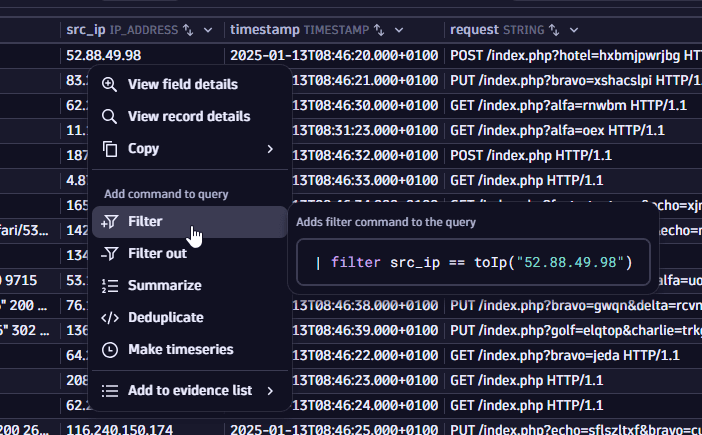
A similar command would be added to the query input:
| filter src_ip == toIp("52.88.49.98")
To remove events from an IP address, right-click on an IP address in the src_ip field of the results table and select Filter out.
Filter by multiple values
Suppose you find many IP addresses in your authentication logs and want to see other requests initiated from these IP addresses. In this case, you can filter by multiple values at once. You have two options:
-
Option 1: Select a range of values (while holding the Shift key, select the first and last value in the table), right-click on them, and select Filter.
-
Option 2: Select individual values (while holding the Ctrl key, select the desired values), right-click on them, and select Filter.
To save space and increase query performance, only unique values are added to the filter.
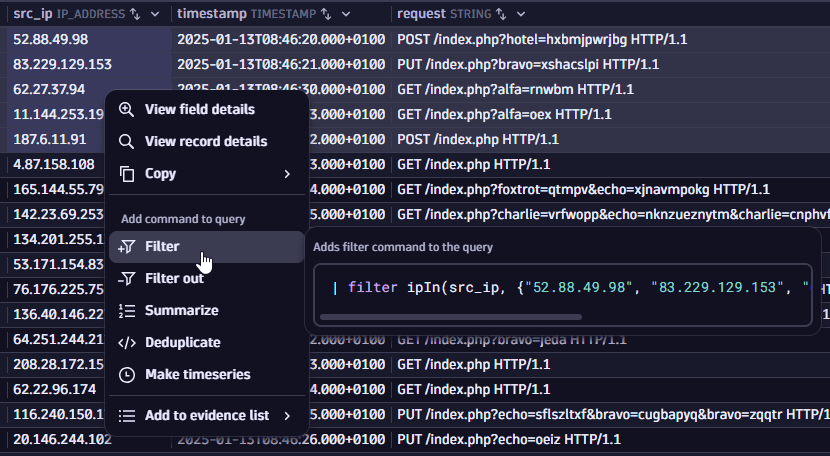
A similar command would be added to the query input:
| filter ipIn(src_ip, {"11.144.253.191", "187.6.11.91", "4.87.158.108", "165.144.55.79"})
Filter by a portion of the value
Suppose you want to find only events with the Intel Mac OS X 10_15_7 portion in the user-agent value. In this case, you can filter from a selected portion of the value: select the relevant part with the cursor, right-click, and select Filter.
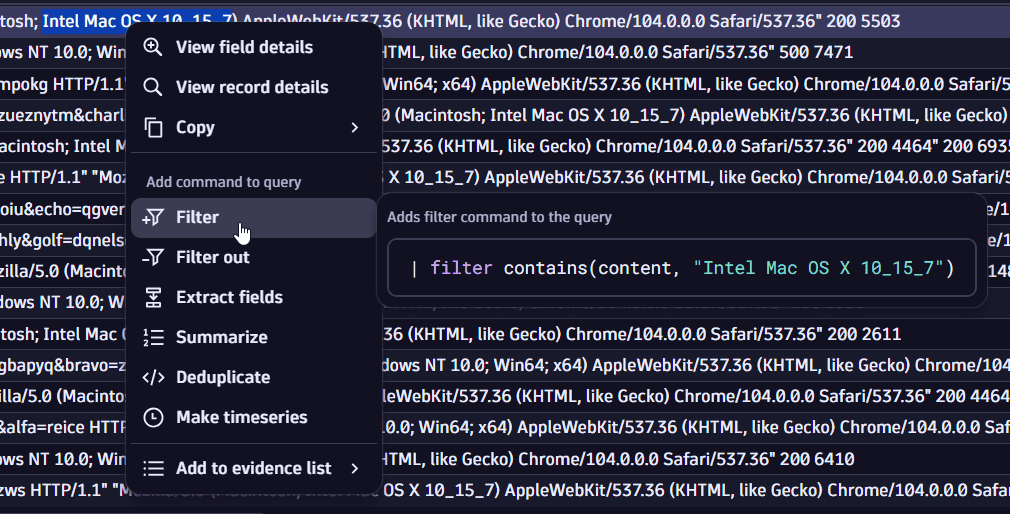
A similar command would be added to the query input:
| filter contains(user_agent, "Intel Mac OS X 10_15_7")
In Playground, value portion filters are displayed in the query tree as orange nodes.
Filter by statistical values
Suppose you want to see only an event with a response size larger than the average response size in your current resultset. In this case, you can create queries based on statistical values: select the fields from which you want to calculate the median, right-click on them, and select Statistics > Median > Greater than.
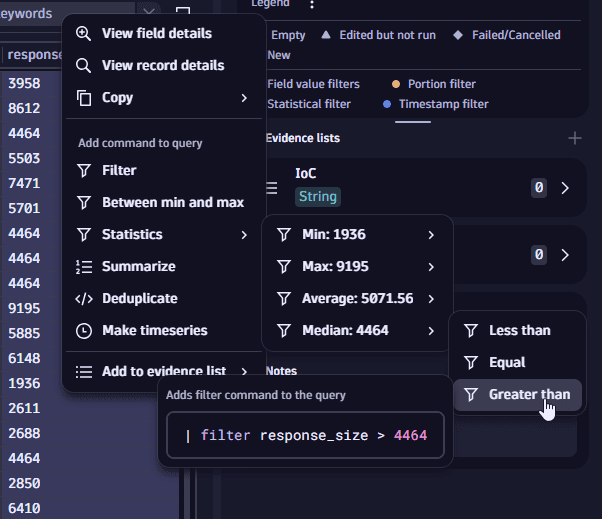
A similar command would be added to the query input (where the median value is calculated automatically):
| filter response_size > 4464
In Playground, statistical filters are displayed in the query tree as green nodes.
Filter from timestamp
Timestamps are among the most crucial data points when investigating logs and events. Investigations offers special filters for this data type, in addition to the Later than, Equal, or Earlier than filtering statements.
In Playground, timestamp filters are displayed in the query tree as blue nodes.
Filter by range
Suppose you found an interesting logline and want to understand it better. You want to see what else happened around the time your event occurred. In this case, you can filter by range: right-click on a timestamp and select Timestamp filters > Around 5 sec. This adds a filter that shows records from exactly five seconds before to five seconds after the selected event.
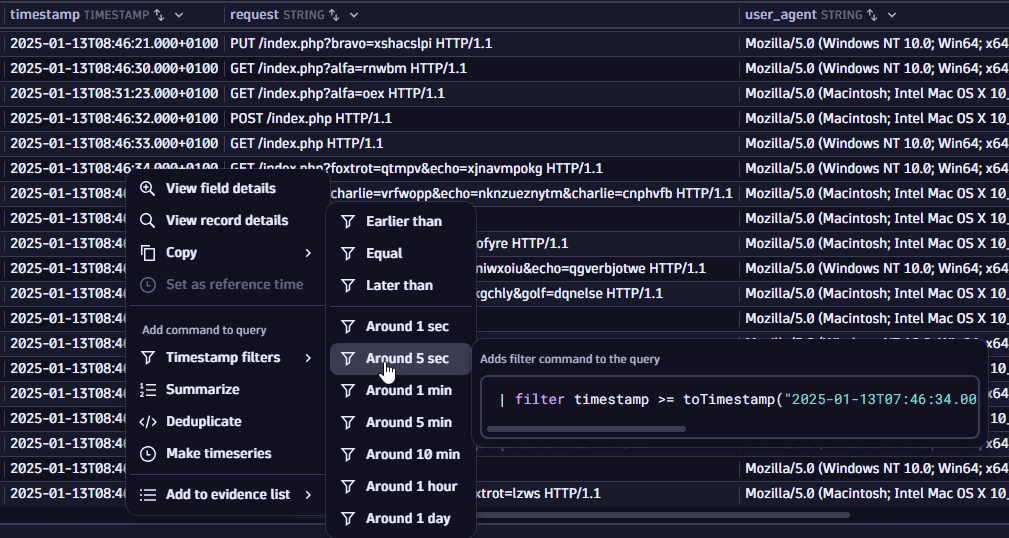
A similar command would be added to the query input:
| filter timestamp >= toTimestamp("2025-01-13T07:46:32.000000000Z")-5sand timestamp <= toTimestamp("2025-01-13T07:46:32.000000000Z")+5s
Filter by a range of multi-selected timestamp values
Suppose a scenario where multiple events from different times occur, and you want to understand what else happened in that timeframe. In this case, you can filter by a range of multi-selected timestamp values: select multiple timestamp values (with the Shift or Ctrl keys) and select Filter by range. This creates a filter that shows all records between the minimum and maximum timestamp values from the selected range.
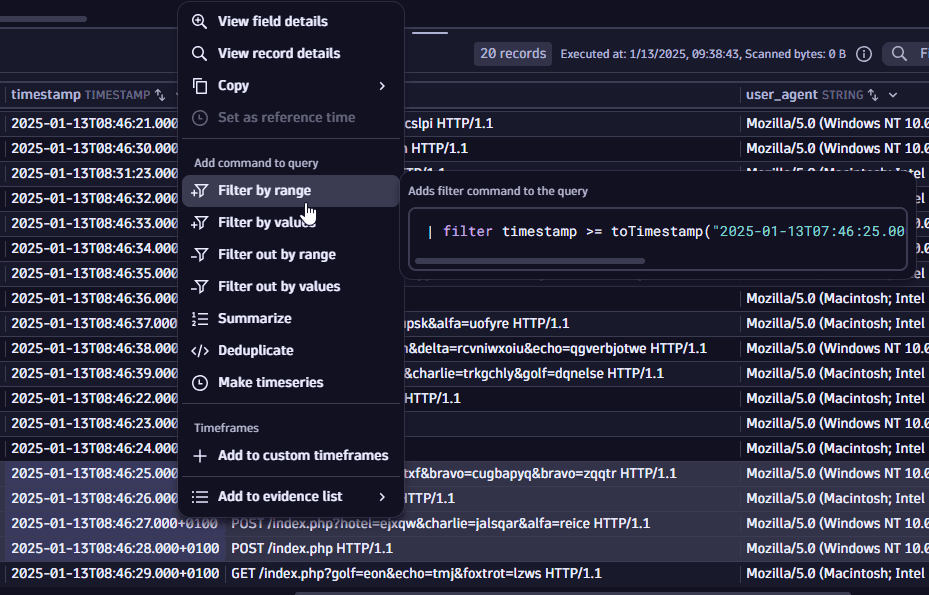
A similar command would be added to the query input:
| filter timestamp >= toTimestamp("2025-01-13T07:31:23.000Z")and timestamp <= toTimestamp("2025-01-13T07:46:37.000Z")
Copy records from the results table
There are more ways to use records than creating additional filters. With Investigations, you can access your results by different means, for example, by copying them to other systems.
Copy as text
The most basic copying mode is copying as text. You can copy either one field at a time or multiple values simultaneously using the Shift or Ctrl key. Select the fields you want to copy, right-click on them, and select Copy > As text.
Copy as DQL value
Suppose you want to use the IP address value from your results in your next DQL query and preserve its type. In this case, you can right-click on the IP address value and select Copy > As DQL value. This copies the IP address with a casting function ready to be used.
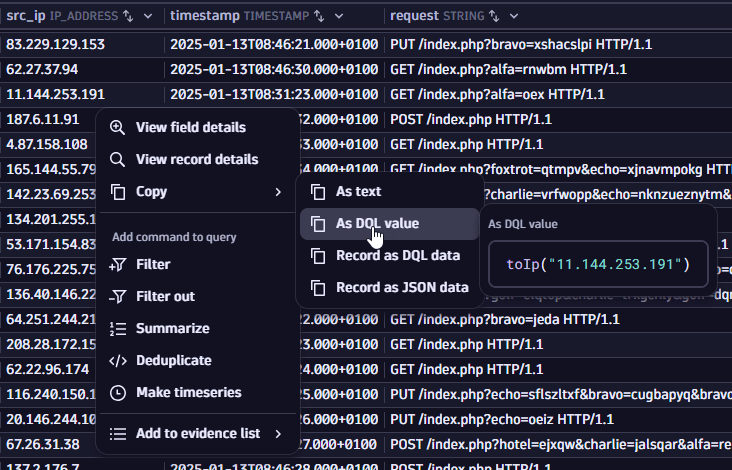
A similar command would be added to the query input:
toIp("187.6.11.91")
Copy record as DQL data
Suppose you find an interesting record to share with your coworkers. Manually copying each column would be time-consuming, and sharing the DQL query for them to execute is cumbersome. In this case, you can right-click on your record in the results table, select Copy > Record as DQL data, and paste it into Slack or add it without hassle to the Jira task. The copied record is a constructed data command that enables you to fetch the record in any Dynatrace environment.
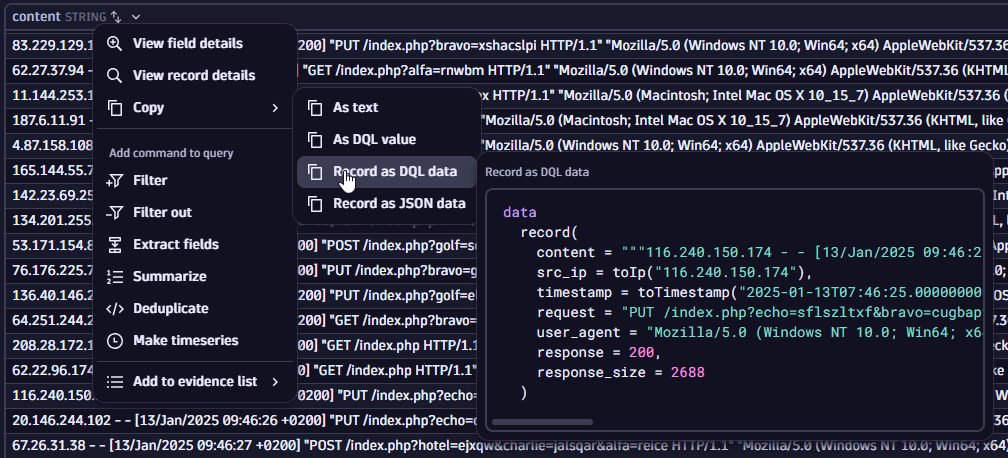
A similar command would be added to the query input:
datarecord(content = """187.6.11.91 - - [13/Jan/2025 09:46:32 +0200] "POST /index.php HTTP/1.1" "Mozilla/5.0 (Macintosh; Intel Mac OS X 10_15_7) AppleWebKit/537.36 (KHTML, like Gecko) Chrome/104.0.0.0 Safari/537.36" 200 5503""",src_ip = toIp("187.6.11.91"),timestamp = toTimestamp("2025-01-13T07:46:32.000000000Z"),request = "POST /index.php HTTP/1.1",user_agent = "Mozilla/5.0 (Macintosh; Intel Mac OS X 10_15_7) AppleWebKit/537.36 (KHTML, like Gecko) Chrome/104.0.0.0 Safari/537.36",response = 200,response_size = 5503)
Or suppose you executed a query that returned 200 results and want to filter further. In this case, you can select all records, copy them as DQL data, paste them to the query input, and execute the query. You will receive the same resultset, which you can now filter further in a much faster way.
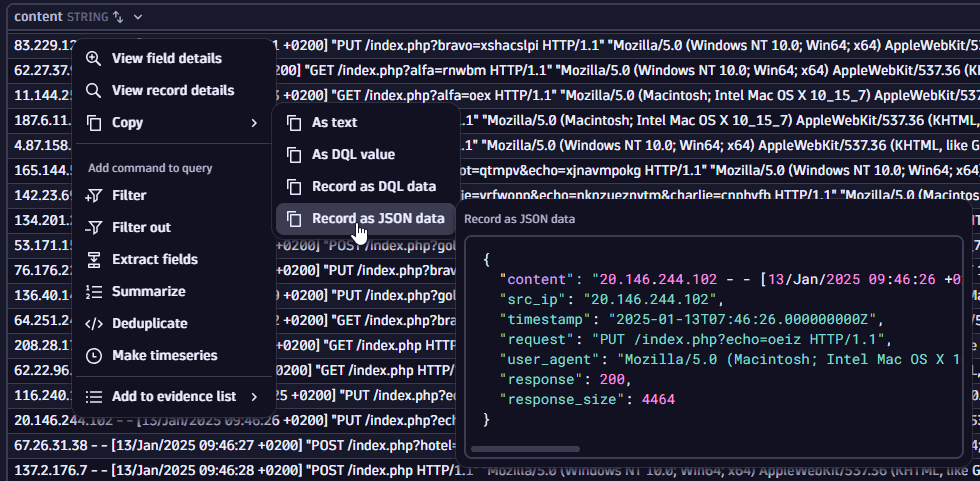
Copy record as JSON data
Suppose you want to use your findings in another system or write a custom Python script to analyze them. To support such data cross-usage, you can copy the results as JSON data: select one or multiple records in the results table, select Copy > Record as JSON data, and paste it to your Jira ticket or as input to your script.
A similar command would be added to the query input:
{"content": "62.27.37.94 - - [13/Jan/2025 09:46:30 +0200] \"GET /index.php?alfa=rnwbm HTTP/1.1\" \"Mozilla/5.0 (Windows NT 10.0; Win64; x64) AppleWebKit/537.36 (KHTML, like Gecko) Chrome/104.0.0.0 Safari/537.36\" 200 8612","src_ip": "62.27.37.94","timestamp": "2025-01-13T07:46:30.000000000Z","request": "GET /index.php?alfa=rnwbm HTTP/1.1","user_agent": "Mozilla/5.0 (Windows NT 10.0; Win64; x64) AppleWebKit/537.36 (KHTML, like Gecko) Chrome/104.0.0.0 Safari/537.36","response": 200,"response_size": 8612}
When copying multiple records as JSON data, they are copied as a JSON array object.