Dynatrace provides support for service-level objectives (SLOs) leveraging Grail. With Service-Level Objectives, you can define and review your service-level objectives utilizing Dynatrace Query Language (DQL).
1 of 3SLO management and details view
What are SLOs, SREs, and SLIs?
A service-level objective (SLO) is a proven way to ensure your system's health and performance for your end-users.
It serves as a simplified gauge for achieving your mid to long-term targets.
Dynatrace provides all the real-time information the Site Reliability Engineering (SRE) team needs to monitor their defined SLOs. An SRE team is typically responsible for finding "good" service-level indicators (SLIs) for a given service to monitor its reliable delivery closely. SLIs can differ from service to service, as not all services are equally critical regarding time and error constraints.
What is part of an SLO?
A typical SLO consists of the following:
Service-level indicator (SLI)
It's a quantitative measure of some aspect of a system's service level.
SLIs typically refer to metrics such as service success rates, successful synthetic test runs, or response times.
However, they can also be based on any other data type, representing an indicator of the end-user experience.
The SLI is given as a normalized time series expressed as a percentage value between 0 and 100%, where 100% is "good"—for example, the ratio of successful service requests over all requests.
In Dynatrace, you must use a DQL query to calculate the SLI. For more information, see the sli field when creating an SLO.
SLO target
The target defines the planned goal to achieve in terms of the service level.
A target could be, for example, that 99.99% of all service calls must return without an error or that 95% of all service requests must be fulfilled in under two seconds response time.
Evaluation period
The evaluation period is necessary to standardize communication concerning the SLO result.
Without a defined evaluation period, the notion of the service level is subjective.
SLO status
Each SLO produces an SLO status, an aggregated SLI value between 0% and 100% over a defined period.
This status reflects how well the service met its objective, such as 95% of response times under 500ms last week, and is evaluated against the predefined threshold to determine success or breach.
Metric-based SLOs
In metric-based SLOs, metrics are pre-aggregated and optimized for timeseries queries, resulting in faster evaluation and reduced data processing overhead.
Metric-based SLO types
Request-based SLOs (event-based) calculate the ratio of "good" events to total events, for example, the ratio of successful requests to total requests.
The SLI automatically adjusts to load variations.
For more information, see the Service availability for critical services example.
Time-slice-based SLOs (window-based): classify each metric interval (time slice) as either "good" or "bad" based on a threshold.
The SLI represents the percentage of "good" time slices, where the metric interval defines the time slice duration.
For more information, see the Service performance for services with a certain tag example.
SLOs in Dynatrace
Service-Level Objectives allows you to view a list of your SLOs.
The overview page shows the following details for each of your SLOs:
Name
Target
Warning
Evaluation period
Actions
To change the order in which your SLOs are displayed, select in the Name column.
Select an SLO name to view:
Status—available in graph or table view. You can also edit or delete your SLO in this section.
Critical services or entities:
If the SLO was created using an SLO template, this section allows you to select your services or entities that should meet your objective.
If the SLO was created via a custom DQL query, this section displays the defined DQL query representing the service-level indicator (SLI) of your SLO.
Criteria—in this section, you can edit the target, evaluation period, and optional warning values.
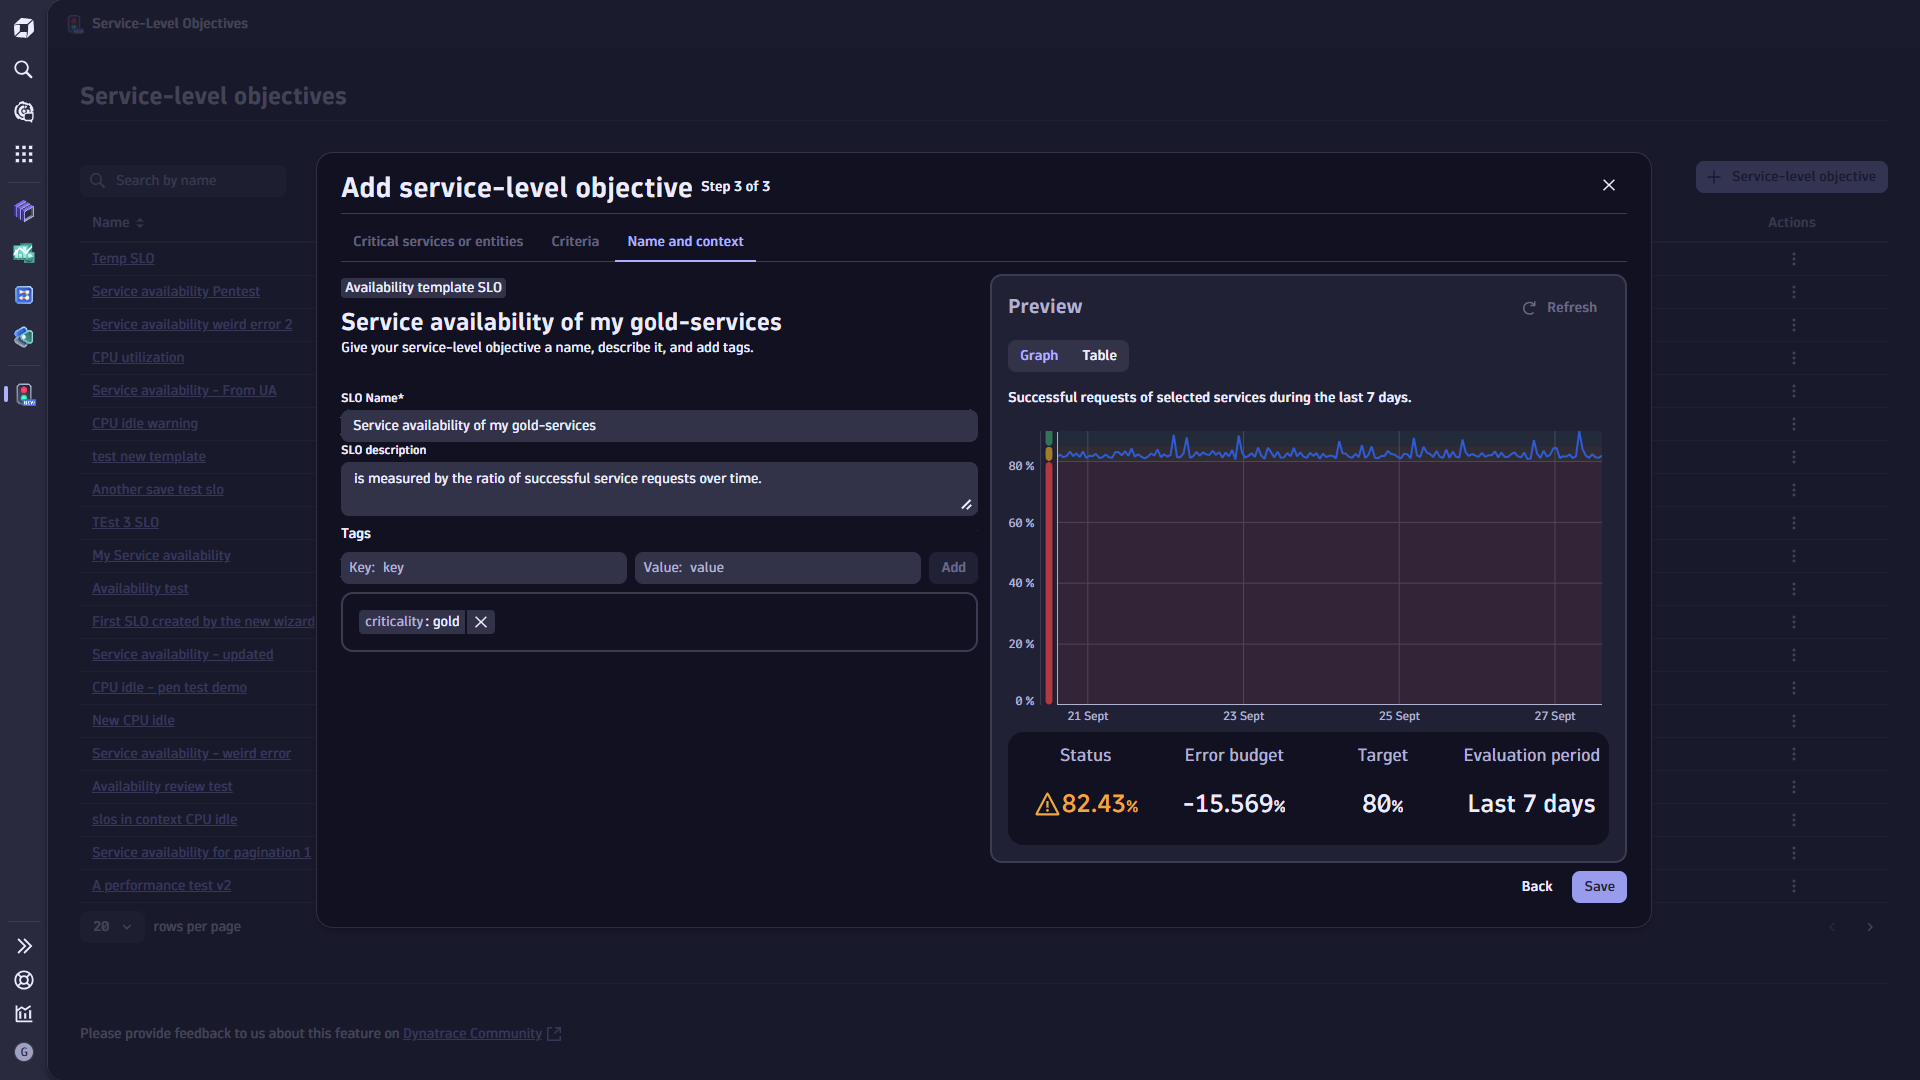
Name and context—in this section, you can edit the name, description, and tags of your SLO.
The menu in the Actions column of the overview offers the following actions:
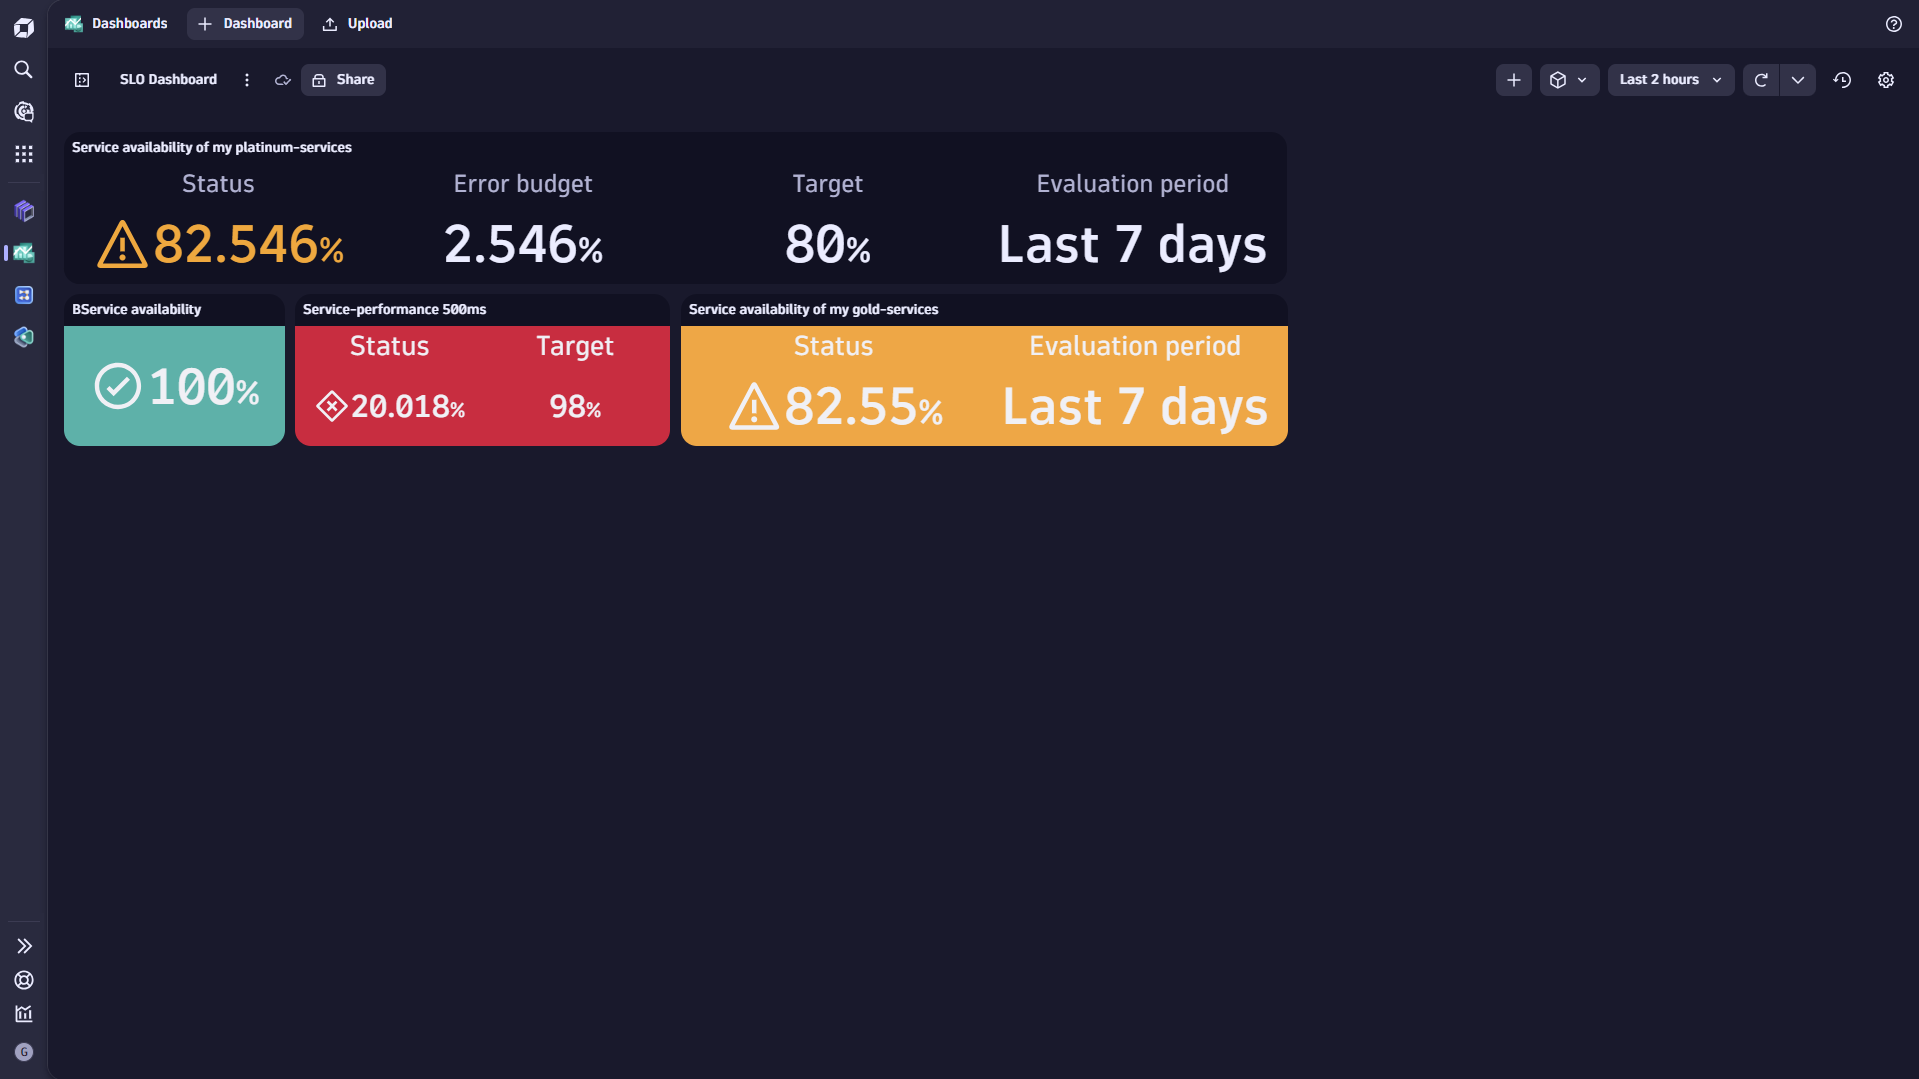
Add to Dashboard
View
Edit
Delete
What's SLO error budget and error budget burn rate?
Error budget
SLOs define the range between ideal and least-acceptable performance of selected services.
The SLO status in a normalized percentage value where 100% is "good".
The SLO threshold represents the lower threshold of an SLO.
The difference between SLO status and SLO threshold is defined as the SLO error budget.
As a perfect 100% availability and performance is neither realistic nor practicable regarding costs, the area between the ideal 100% and the predefined lower boundary SLO threshold is acceptable.
We calculate the remaining error budget of an SLO by taking the difference between the SLO status and SLO threshold.
Working with error budgets allows an improved approach to monitoring and ensuring the system's health and serves as a quality gate for new deployments.
Imagine that your availability SLO has 95% as a target over one week, and the current SLO status shows 96%, meaning you have only 1% of your error budget.
You might want to improve your availability metrics before a new release that might impact availability. For more information, see Service-level objective templates.
Error budget burn rate
Error budget burn rate represents the short-term consumption rate of the currently available SLO error budget.
A high burn rate depicts an abnormally high consumption of the error budget relative to the SLO evaluation period.
This period is typically significantly shorter than the SLO evaluation period, enabling a proactive indication or warning that meeting the SLO target is at risk.
An error budget is typically represented by the following formula:
burn rate = error rate / error budget over the look-back (alerting) window size
The look-back (alerting) window is the time duration over which to measure the error rate.
Short look-back windows allow a fast response to error budget consumption rate changes due to a problem. However, short look-back windows may lead to overly sensitive alerting, especially during low-traffic periods.
Monitor error-budget burn rates
Calculate SLO burn rates in Dynatrace
Dynatrace SLOs are defined using DQL, allowing you to determine the SLI based on your chosen data.
Calculate the error budget burn rate of an SLO by adding one additional line to the SLI definition:
| fieldsAdd sli = "YOUR SLI"
|fieldsAdd target= "YOUR SLO-target" in percentage
// Add the next line to calculate the error budget burn rate
These two lines return your SLO's error budget burn rates for each service entity contributing to the SLO and ensure that Anomaly Detection only alerts on the burn rate metrics.
Optional If you need an aggregated burn-rate value, for example, returning one burn-rate value for all contributing service entities, you need an additional aggregation.
When you use an aggregation function, the context of individual entities is lost.
This means you'll no longer see which specific services contributed to the burn rate, only the overall aggregated result.
| fieldsAdd sli = "YOUR SLI"
|fieldsAdd target= "YOUR SLO-target" in percentage
// Add the next line to calculate the error budget burn rate
You can see the burn rates in Dashboards, where you can use it as input for regularly scheduled evaluations via Site-Reliability Guardian, or you can set up automatic alerts using Anomaly Detection.
Raise SLO burn-rate events (alerts) automatically via the Anomaly Detection
You can use Anomaly Detection to automatically raise an event if the error budget burn rate exceeds a specific predefined limit.
In Anomaly Detection, enter your SLI as a DQL query.
Segments are currently not supported by Anomaly Detection.
Add the burn rate calculation.
Optional If a burn rate violation event is raised for each contributing service entity or an aggregated one, add one of the DQL queries described above.
Consider that the actor of the custom alert configurations needs to have the necessary permissions.
Recommendations for configuring custom alerts for raising burn-rate alerts
Anomaly Detection supports a look-back window of -1h, a well-suited timeframe for fast-burn rate alerts, indicating a significant drop in your remaining error budget, setting your SLO target at risk, and requiring you to react without losing too much time.
A "good" starting point for static threshold detection for a -1h look-back window is 10-14.
Based on your specific requirements and circumstances, such as the criticality of your SLO or its overall evaluation period, a higher or lower burn-rate threshold may result in a better alerting sensitivity.
Anomaly Detection also provides custom event properties to add if the alerting conditions are met.
We recommend adding the following event properties to the anomaly detection:
dt.source entity: it ensures the affected service entities are added to the burn-rate event
event.type using ERROR_EVENT, AVAILABILTIY_EVENT or PERFORMANCE_EVENT, ensures that the event is properly matched with other Dynatrace Intelligence root cause analysis and correlations to provide more contextual information automatically.
slo.name makes it easy to relate to the corresponding SLO, as the SLO names are unique within Dynatrace.
dt.owner is a team identifier that allows automatic routing and ticketing to the correct team in case of a burn rate alert event.
After defining the custom alert, an event with the set event properties is raised. This event is automatically considered in case of detected problems via Dynatrace Intelligence. Furthermore, the events can be used as a trigger for workflows, such as automated and targeted notifications and ticketing.
Use cases
SLOs provide a handy and efficient tool to define and track error budgets for your critical components, which allows you to proactively take action in case your error budgets are consumed abnormally fast and put your SLAs at risk.
Typically, SLOs are set based on latency, failure rate, and availability metrics, but they can also be defined to identify an increase in a particular error-log pattern.
Learning modules
Go through the following process to learn using the Service-Level Objectives:
 Service-Level Objectives, you can define and review your service-level objectives utilizing Dynatrace Query Language (DQL).
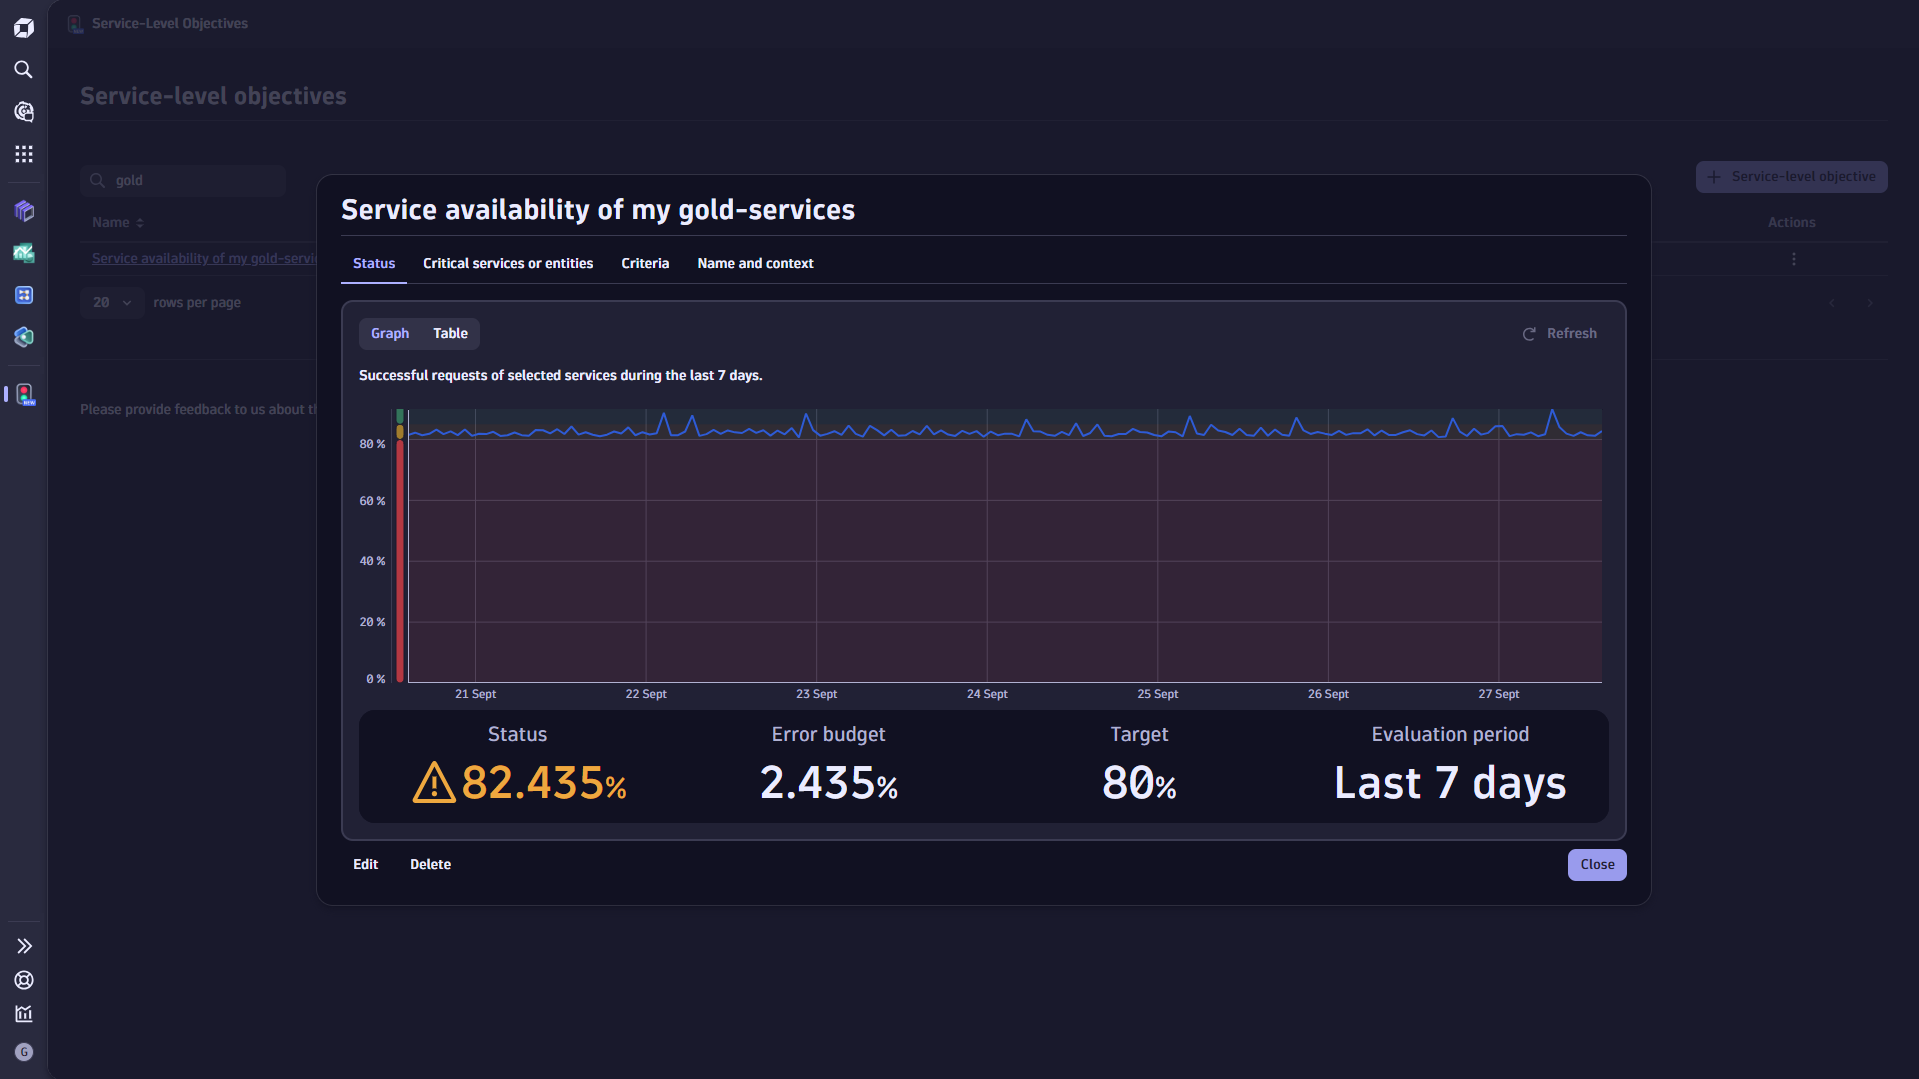


 Service-Level Objectives